

Persistence & Retention – 2014
First-Year Persistence and Retention Rates by Starting Enrollment Intensity: 2009-2012
Of all associate degrees earned in 2008-09 that were reported to the National Student Clearinghouse, 488,046 were found to be the first postsecondary credential earned by a student. Forty-one percent of these students went on to earn a bachelor’s degree within six years.
Persistence Rates Slip While Retention Holds Steady
The overall persistence rate for first-time college students has dropped 1.2 percentage points since 2009, while the retention rate has remained nearly constant.The persistence rate is the percentage of students who return to college at any institution for their second year, while the retention rate is the percentage of students who return to the same institution for their second year.
Of all students who started college in fall 2012, 68.7 percent returned to college at any U.S. institution in fall 2013, and 58.2 percent returned to the same institution.
For each entering cohort year, the overall persistence rate is about 11 percentage points higher than the retention rate. Thus, about one in nine students who start college in any fall term transfer to a different institution by the following fall.
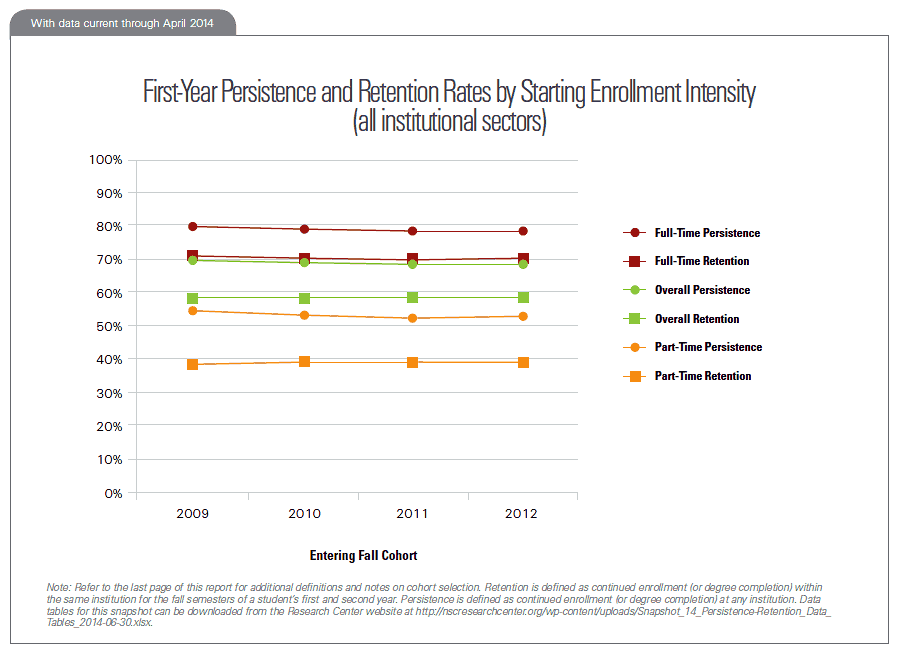
Note: Refer to Definitions and Notes on Cohort Selection section below for additional definitions and notes on cohort selection. Retention is defined as continued enrollment (or degree completion) within the same institution for the fall semesters of a student’s first and second year. Persistence is defined as continued enrollment (or degree completion) at any institution.
Persistence Rate Falling Fastest for Youngest Students
For students who are age 20 or under at college entry, the persistence rate has fallen 1.8 percentage points since 2009, while the retention rate has remained nearly constant.
For students in the >20 to 24 age group at college entry, the persistence rate has fallen 0.6 percentage points since 2009, while the retention rate has increased 0.4 percentage points. For students over age 24 at college entry, the persistence rate has fallen 1.4 percentage points since 2009, while the retention rate has fallen 1.0 percentage points.
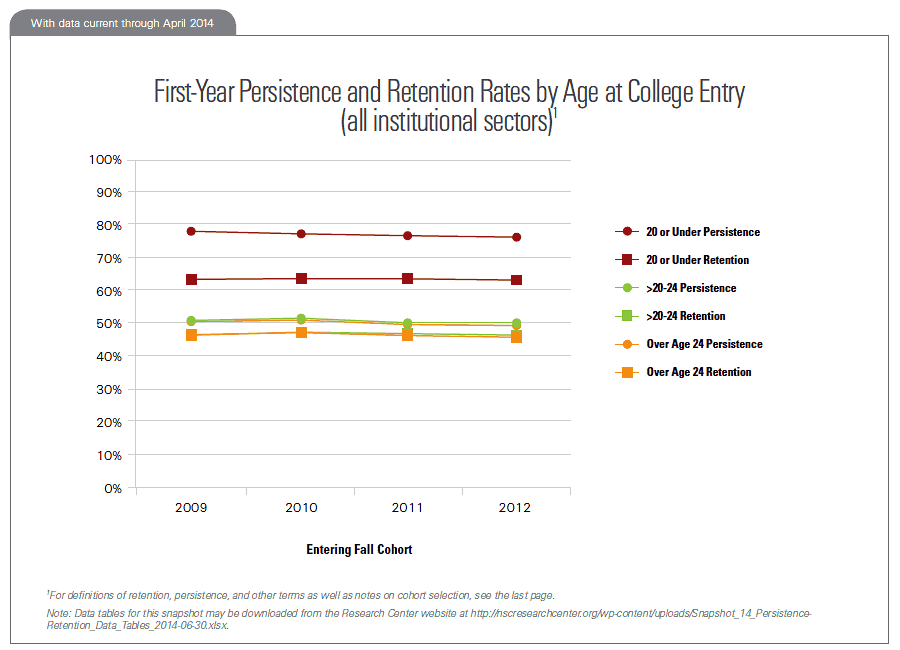
Note: Refer to Definitions and Notes on Cohort Selection section below for additional definitions and notes on cohort selection
Four-Year Publics: Persistence Rate Down 2.3 Percentage Points
The overall persistence rate for students who start college in the four-year public sector has fallen 2.3 percentage points since 2009, while the retention rate has dropped 1.0 percentage points.
Of all students who started college in this sector in fall 2012, 79.1 percent returned to college at any U.S. institution in fall 2013, and 68.2 percent returned to the same institution. For full-time starters in this sector, the persistence rate has fallen 2.3 percentage points since 2009, while the retention rate has dropped 1.4 percentage points. For part-time starters in this sector, the persistence rate has fallen 2.5 percentage points since 2009, while the retention rate has dropped only 0.3 percentage points.
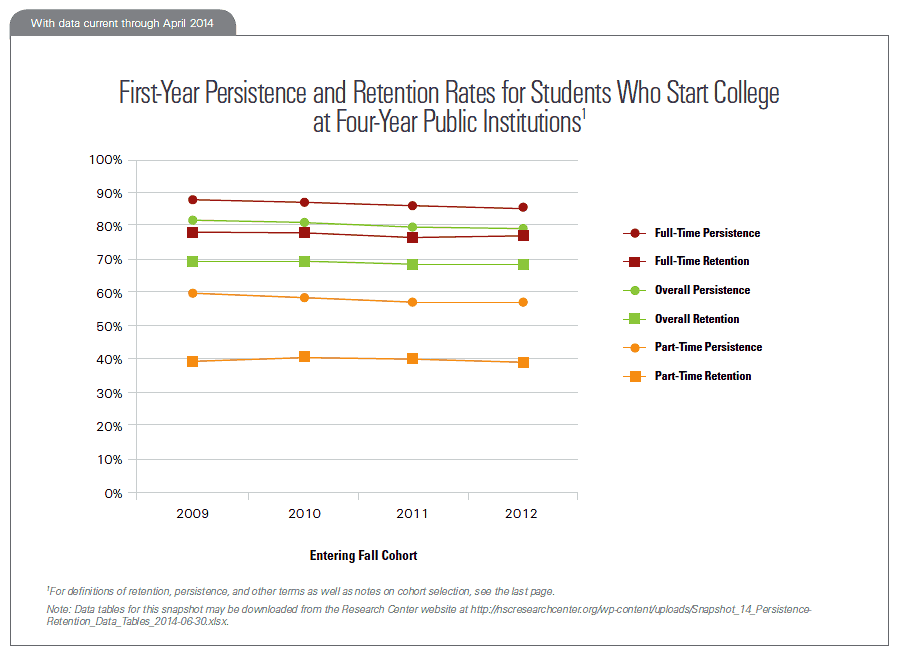
Note: Refer to Definitions and Notes on Cohort Selection section below for additional definitions and notes on cohort selection.
Four-Year Privates: Persistence Rate Down 2.8 Percentage Points
The overall persistence rate for students who start college in the four-year private nonprofit sector has fallen 2.8 percentage points since 2009, while the retention rate has dropped 1.1 percentage points.
Of all students who started college in this sector in fall 2012, 83.1 percent returned to college at any U.S. institution in fall 2013, and 72.9 percent returned to the same institution. For full-time starters in this sector, the persistence rate has fallen 2.2 percentage points since 2009, while the retention rate has dropped 1.1 percentage points. For part-time starters in this sector, a group that made up less than 12 percent of the entering cohort, the persistence rate has fallen 6.8 percentage points since 2009, while the retention rate has dropped 0.4 percentage points.
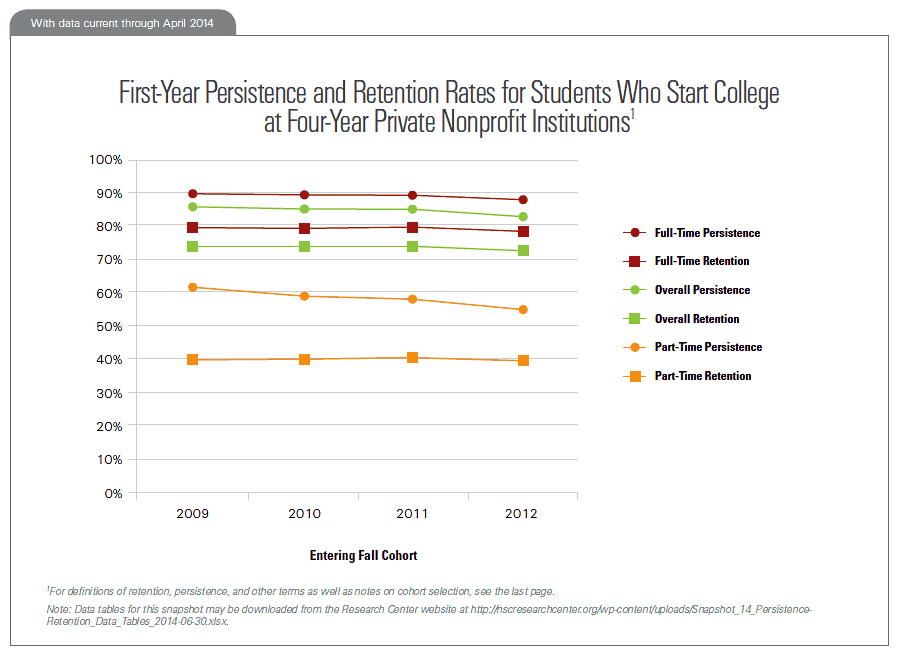
Note: Refer to Definitions and Notes on Cohort Selection section below for additional definitions and notes on cohort selection.
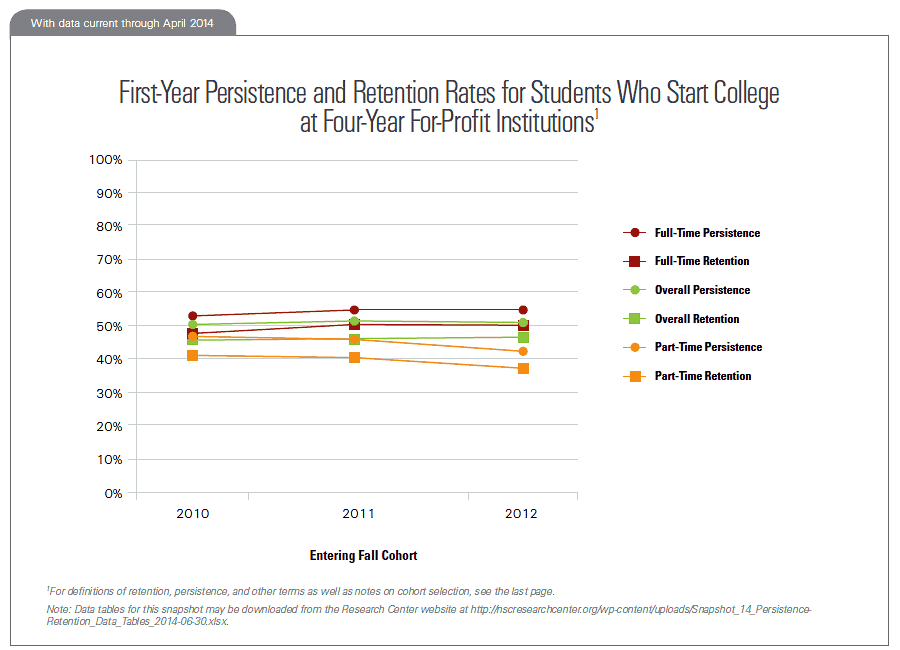
Four-Year For-Profits: Persistence Rate Up 0.7 Percentage Points
The overall persistence rate for students who start college in the four-year for-profit sector has increased 0.7 percentage points since 2010, while the retention rate has increased 1.0 percentage points.
Of all students who started college in this sector in fall 2012, 51.2 percent returned to college at any U.S. institution in fall 2013, and 46.2 percent returned to the same institution. For full-time starters in this sector, the persistence rate has increased 1.7 percentage points since 2010, while the retention rate has increased 1.9 percentage points. For part-time starters in this sector, the persistence rate has fallen 4.6 percentage points since 2010, while the retention rate has dropped 4.2 percentage points.
Note: Refer to Definitions and Notes on Cohort Selection section below for additional definitions and notes on cohort selection.
Note: Due to reporting changes, the fall 2009 entering cohort is not directly comparable to subsequent cohorts in this sector, and is therefore excluded from this chart. However, institutions from the for-profit sector are included in the overall results for the 2009 cohort.
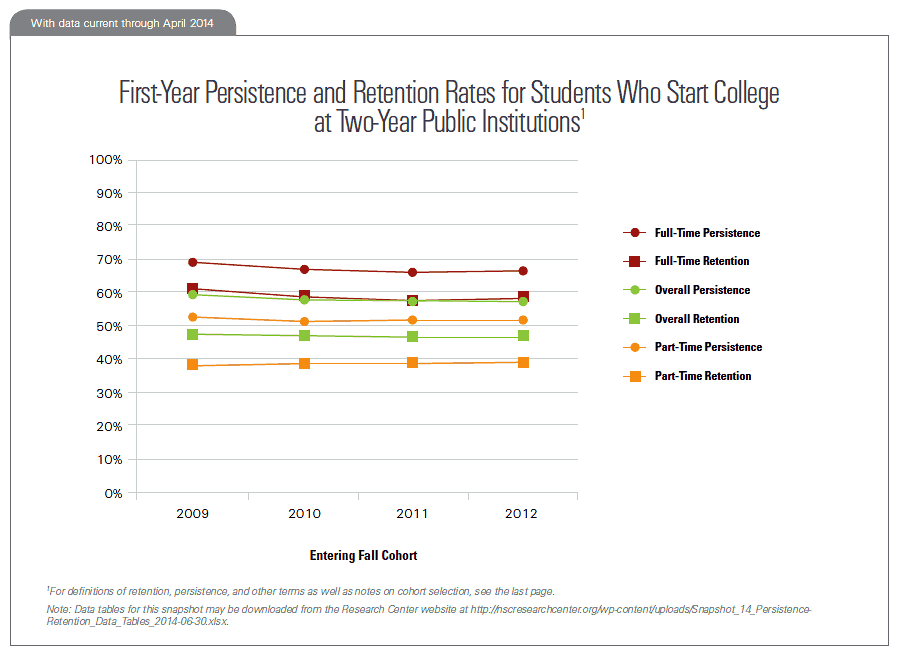
Two-Year Publics: Persistence Rate Down 2.3 Percentage Points
The overall persistence rate for students who start college in the two-year public sector has fallen 2.3 percentage points since 2009, while the retention rate has dropped 1.1 percentage points.
Of all students who started college in this sector in fall 2012, 57 percent returned to college at any U.S. institution in fall 2013, and 46.5 percent returned to the same institution. For full-time starters in this sector, the persistence rate has fallen 2.8 percentage points since 2009, while the retention rate has dropped 2.2 percentage points. For part-time starters in this sector, the persistence rate has fallen 1.1 percentage points since 2009, while the retention rate has increased 1.0 percentage points.
Note: Refer to Definitions and Notes on Cohort Selection section below for additional definitions and notes on cohort selection.
Definitions and Notes on Cohort Selection
Retention – Defined in this report as continued enrollment (or degree completion) within the same higher education institution in the fall semesters of a student’s first and second year.
Persistence – Defined in this report as continued enrollment (or degree completion) at any higher education institution — including one different from the institution of initial enrollment — in the fall semesters of a student’s first and second year.
Enrollment Intensity – A student is classified as having started college in a full- or part-time status based on his or her earliest reported enrollment intensity within the entering fall term. The part-time grouping comprises half-time and less-than-half-time students, some of whom may be non-degree-seeking.
First-Time Status – This report uses historical Clearinghouse enrollment and degree data to confirm that students included in the study (1) showed no previous college enrollment in the four years prior to the entering cohort year and (2) had not previously completed a college degree. In order to reliably identify students with prior enrollments, this report is limited to institutions that began submitting enrollment data to the Clearinghouse for terms beginning on or before June 1, 2005.
Included Institutions – This report is based on a fixed panel of institutions for all four starting cohorts. These are U.S. Title IV degree-granting institutions that have been submitting student enrollment data to the Clearinghouse since at least June 1, 2005.
Degree-Seeking Status – The retention rates reported by IPEDS are limited to degree-seeking students. This report differs in that it includes all entering students.
Former Dual Enrollment Students – The cohorts used in this study include former dual enrollment students: first‐time college students who had taken college courses prior to graduating from high school. Students were identified as former dual enrollment students if their enrollment or degree record prior to the entering cohort year was before the student turned 18 years old.
Fall Enrollment – A student is counted as having been enrolled in the fall if they were enrolled for any length of time in a term that began between August 13 and October 31, inclusive.
Sponsored in part by the Lumina Foundation, committed to enrolling and graduating more students from college.