Yearly Success and Progress Rates
Fall 2016 Beginning Cohort
April 4, 2023
The Yearly Success and Progress Rates report goes beyond traditional student outcome measures by showing year-by-year rates of retention, persistence, transfer, completion, and stop-out. It shows the highest level of academic progress made, broken out by the type of starting institution and enrollment intensity at entry. The report is designed to help institutions and states better identify and inform effective intervention points to increase student success.
The latest data presents yearly academic progress for approximately 2.3 million individuals who began college for the first time in fall 2016 with the intent to earn a credential. Their overall four-year and six-year completion rates have increased compared to the fall 2015 cohort but the disadvantage for those enrolling part time remains unchanged.
This report series measures academic progress in each subsequent academic year for six years after entry, broken out by the type of starting institution and enrollment intensity at entry (full-time vs. part-time). Results do not account for enrollment intensity changes after entry.
The outcome categories are modeled after those used in the Student Achievement Measure (SAM), and can be used as the most current national and state benchmarks for institutions participating in SAM. Unlike in SAM reporting, undergraduate certificates are counted as completions in this report.
National Highlights
-
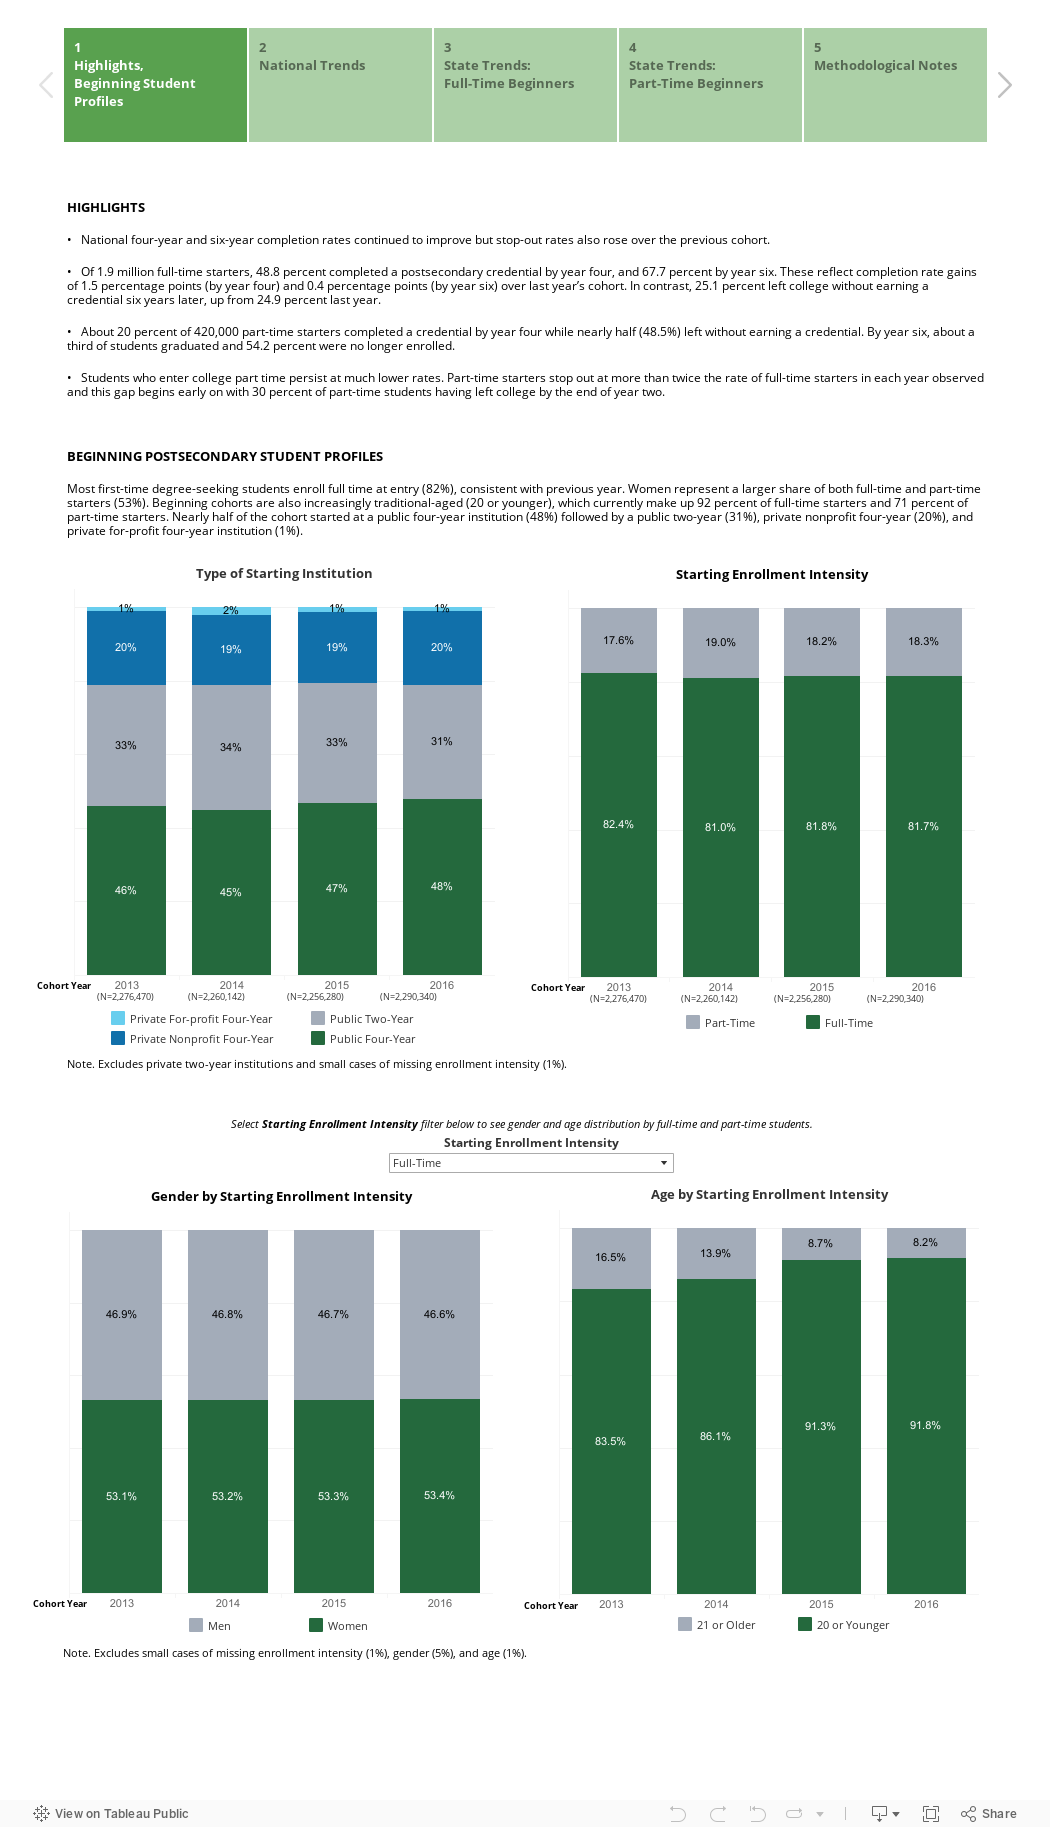
National four-year and six-year completion rates continued to improve but stop-out rates also rose over the previous cohort.
-
Of 1.9 million full-time starters, 48.8 percent completed a postsecondary credential by year four, and 67.7 percent by year six. These reflect completion rate gains of 1.5 percentage points (by year four) and 0.4 percentage points (by year six) over last year’s cohort. In contrast, 25.1 percent left college without earning a credential six years later, up from 24.9 percent last year.
-
About 20 percent of 420,000 part-time starters completed a credential by year four while nearly half (48.5%) left without earning a credential. By year six, about a third of students graduated and 54.2 percent were no longer enrolled.
-
Students who enter college part time persist at much lower rates. Part-time starters stop out at more than twice the rate of full-time starters in each year observed and this gap begins early on with 30 percent of part-time students having left college by the end of year two.
Yearly Progress and Success Rates Within Six Years of Enrolling
Beginning Postsecondary Students Each Fall, 2009 to 2016
Compare cohort outcomes by starting institution and enrollment intensity, using the tabs at the top and the drop-down list in each tab.