
Clearinghouse Enrollment Insights Series:
Final Spring Enrollment Trends

May 22, 2025
The Current Term Enrollment Estimates spring report provides the final enrollment estimates for the spring term based on comprehensive data. This report will be known as the Final Spring Enrollment Trends report starting June 2026. It provides national enrollment estimates by credential type, institutional sector and other characteristics (e.g., locale, program focus), enrollment intensity, student demographics (e.g., age, race/ethnicity, gender), and major field, as well as state-level enrollment estimates. Enrollment estimates are adjusted for Clearinghouse data coverage rates by institutional sector, state, and year. Postsecondary institutions actively submitting enrollment data to the Clearinghouse account for 97 percent of the total enrollments at Title IV, degree-granting institutions in the U.S.
The dashboard-based report allows users to explore the longitudinal data through interactive visualizations. Specific major family-related data are available in the Data Appendix for download.
> Go back to Clearinghouse Enrollment Insights series page.
Spring 2025 Highlights
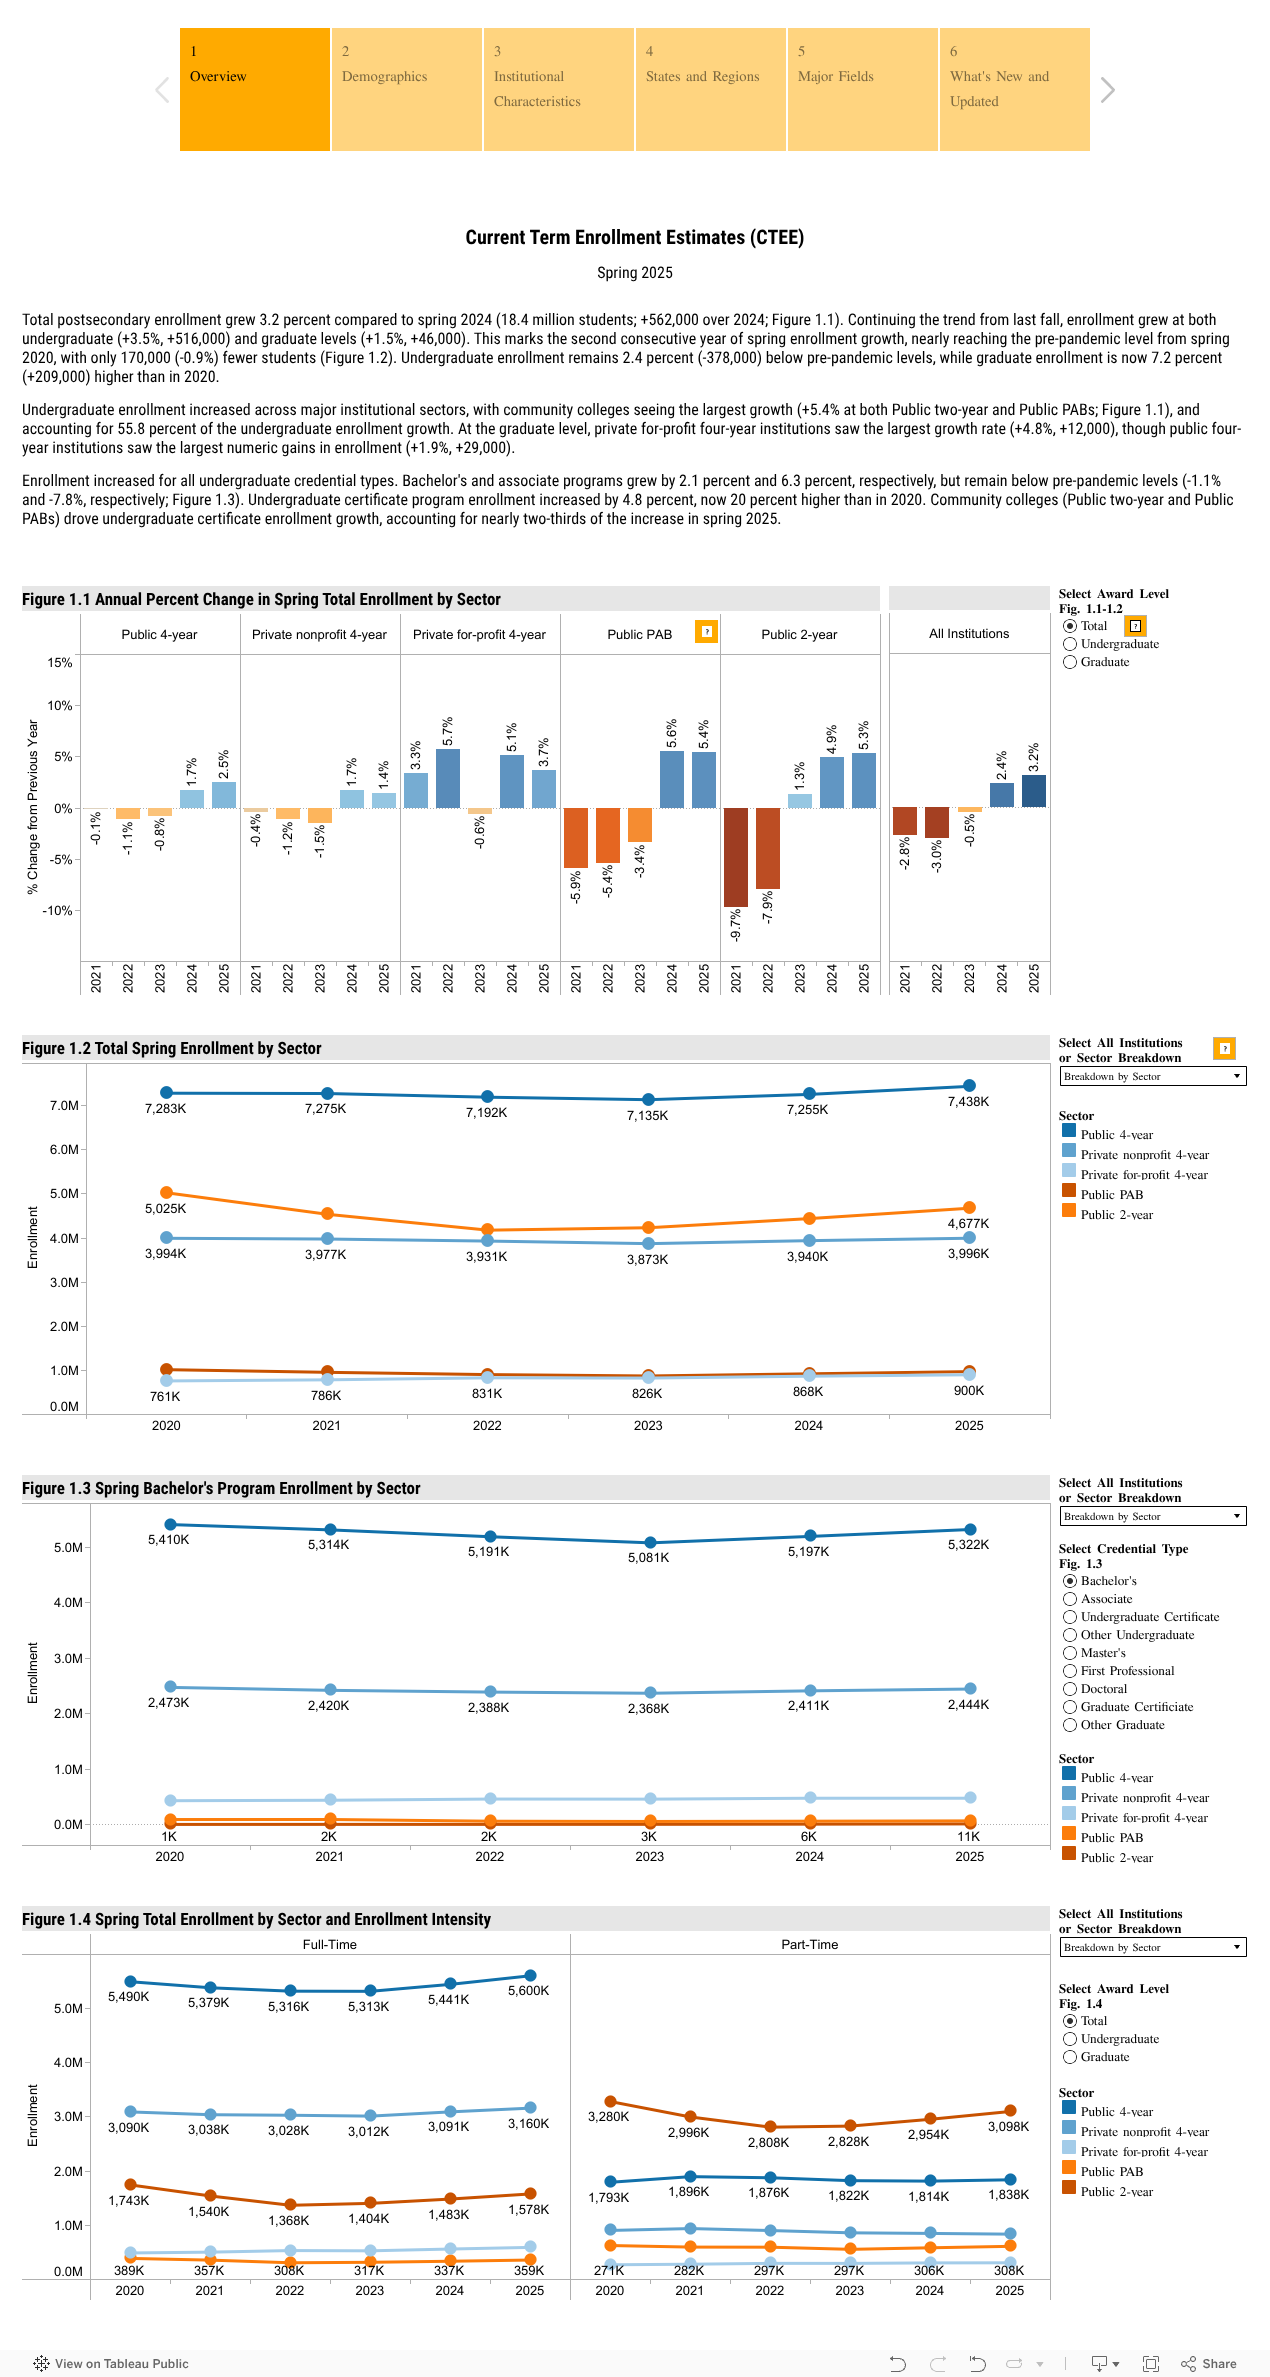
- Total postsecondary enrollment is up 3.2 percent this spring (+562,000), compared to spring 2024. Undergraduate enrollment grew 3.5 percent, reaching 15.3 million but remains below pre-pandemic levels (-2.4%, -378,000). Graduate enrollment also increased 1.5 percent, now 7.2 percent (+209,000) higher than in 2020.
- Undergraduate enrollment increased across major institutional sectors, with community colleges (Public two-year and Public PABs) seeing the largest growth (+5.4%, +288,000).
- Enrollment increased for all undergraduate credential types. Bachelor’s and associate programs grew by 2.1 percent and 6.3 percent, respectively, but remain below spring 2020 levels. Undergraduate certificate program enrollment continued to grow this spring (+4.8%) and is now 20 percent above 2020.
- Most ethnoracial groups saw increases in enrollment this spring, with Black and multiracial undergraduate students seeing the largest growth (+10.3% and +8.5%, respectively).
- The number of undergraduate students in their twenties increased this spring (+3.2% for students 21-24 and +5.9% for students 25-29), marking a start of a recovery after consistent declines since the pandemic.
- For the third consecutive year, high vocational public two-years had substantial growth in enrollment (+11.7%, +91,000). Enrollment at these trade-focused institutions increased almost 20 percent since the spring of 2020 (871,000 students; +19.4% over 2020) and now comprises 19.4 percent of public two-year enrollment.
Navigate using the tabs at the top of the dashboard to see details for different institutions and student groups.
Have suggestions for new analyses related to this publication?

Looking for insights beyond our research reports?
Work directly with our team to design research that answers your organization’s specific questions, with the depth, rigor, and data authority the National Student Clearinghouse is known for.