
Clearinghouse Enrollment Insights Series:
Final Fall Enrollment Trends

January 15, 2026
The Final Fall Enrollment Trends report (previously known as the Current Term Enrollment Estimates fall report) is published every January and provides the final enrollment estimates for the fall term based on comprehensive data. It provides national enrollment estimates by credential type, institutional sector and other characteristics (e.g., locale, selectivity), enrollment intensity, student demographics (e.g., age, race/ethnicity, gender), and major field, as well as state-level enrollment estimates. Enrollment estimates are adjusted for Clearinghouse data coverage rates by institutional sector, state, and year.
The Final Fall Enrollment Trends report differs from the Preliminary Fall Enrollment Trends report, which is designed to offer institutions, policy makers, and researchers an early look at enrollment trends for the fall based on a panel of institutions that consistently reported their fall term enrollments in each of the years included in the report. Hence, enrollment estimates may differ between the Preliminary and Final Enrollment Trends reports due to the difference in methodology and institution coverage. Postsecondary institutions actively submitting enrollment data to the Clearinghouse account for 97 percent of the total enrollments at Title IV, degree-granting institutions in the U.S.
The dashboard-based report allows users to explore the longitudinal data through interactive visualizations. Specific major family-related data are available in the downloadable Data Appendix.
> Go back to Clearinghouse Enrollment Insights series page.
Highlights from the Final Fall Enrollment Trends 2025 Report
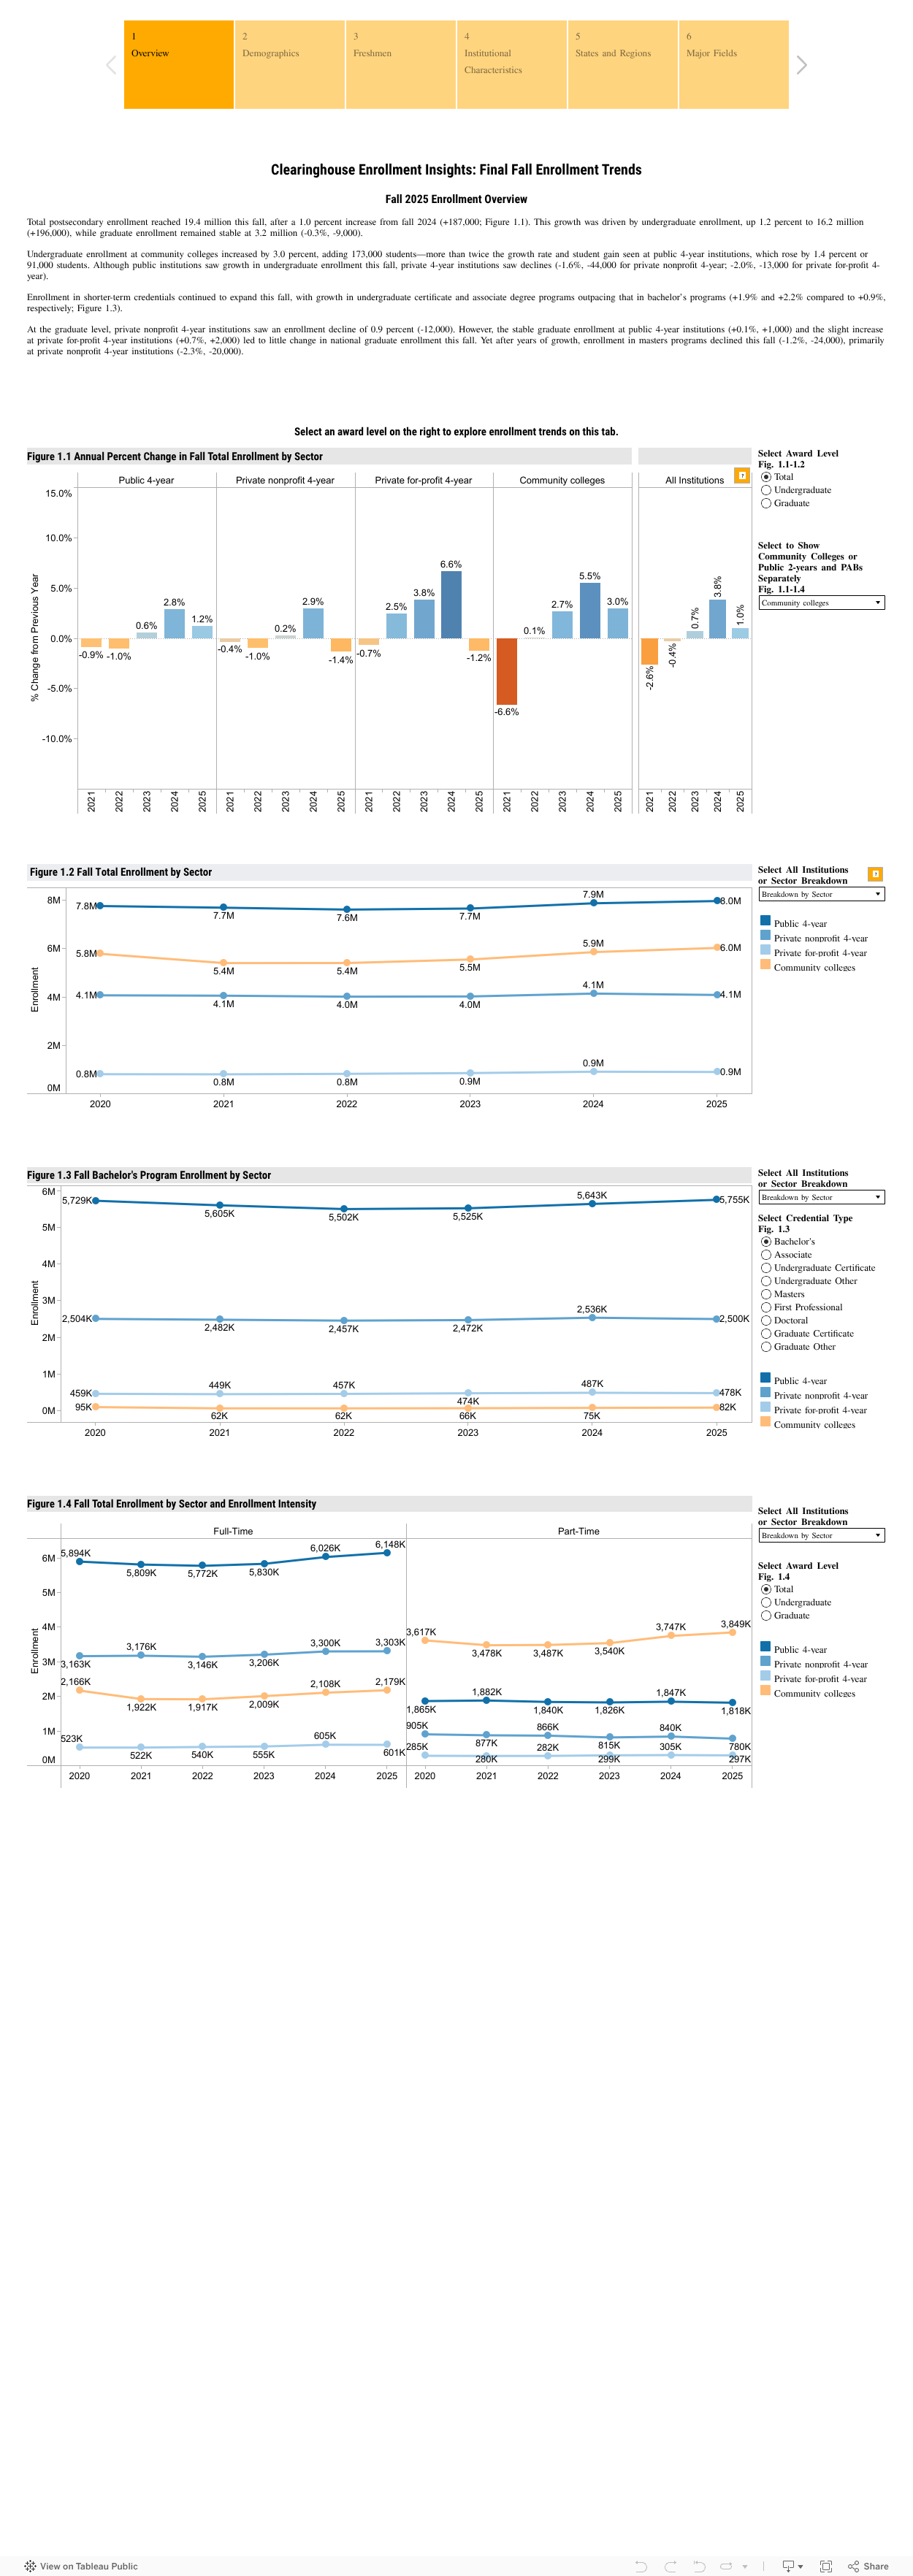
- In fall 2025, there were over 19.4 million postsecondary enrollments —16.2 million undergraduate and 3.2 million graduate students. Compared to 19.2 million students last fall, this is a 1.0 percent increase in total postsecondary enrollment, driven by undergraduate gains (+1.2%) while graduate enrollment remained stable (-0.3%).
- Growth in undergraduate enrollment was driven by a 3.0 percent increase in community college enrollment, compared to a 1.4 percent increase at public 4-year colleges. Private 4-year institutions saw declines in undergraduate enrollment this fall (-1.6% at nonprofit and -2.0% at for-profit institutions).
- Enrollment in undergraduate certificate and associate degree programs continues to grow at a faster pace than bachelor’s program enrollment (+1.9% and +2.2% compared to +0.9%). After four years of consecutive growth, there are now 752,000 enrollments in undergraduate certificate programs at community colleges, a total increase of 28.3 percent from fall 2021.
- Graduate international student enrollment declined 5.9 percent after years of steady growth (-10,000). At the undergraduate level, there was an increase in international enrollment (+3.2%, +5,000) but at less than half the rate than last fall (+8.4%).
- Freshman enrollment remained stable this fall (-0.2%) at 2.5 million students. Public 4-year institutions experienced a 1.9 percent increase in freshmen (+18,000 to 971,000 students) while private 4-year institutions saw declines (-10,000 at each sector). There were 965,000 freshmen at community colleges, an increase of only 4,000 students (+0.5%) after three consecutive years of strong growth.
- Enrollment in Computer and Information Science programs declined across all award and institution types, ranging from -3.6 percent at undergraduate PAB institutions to -14.0 percent at the graduate level.
Navigate using the tabs at the top of the dashboard to see details for different institutions and student groups.
Past Reports
2024: Fall + Appendix (Dashboard)
Special Analysis of 18-year-old Freshmen (Dashboard)
2021: Fall
2020: Fall
Have suggestions for new analyses related to this publication?

Looking for insights beyond our research reports?
Work directly with our team to design research that answers your organization’s specific questions, with the depth, rigor, and data authority the National Student Clearinghouse is known for.