
High School Benchmarks
National college progression rates for high schools participating in the National Student Clearinghouse StudentTracker service

September 17, 2025
This thirteenth annual report provides the most current data on high school graduates’ postsecondary enrollment, persistence, and completion outcomes. These data are the most relevant benchmarks for monitoring and evaluating progress in assisting students to make the high school to college transition and earn a credential in a timely manner.
The current report examines first-fall (immediate) college enrollment for the high school graduating class of 2024, persistence for the class of 2022, and completion for the class of 2018. Outcomes are disaggregated across high school income, minority, and locale-centric characterizations.
The High School Benchmarks report is presented as a data dashboard-only publication. The results are also available in downloadable (xlsx) format.
About this report
The High School Benchmarks report series is designed for secondary education practitioners and policymakers to be able to benchmark key postsecondary outcomes of their high school graduates as measured by enrollment, first-year persistence, and eventual completion of a postsecondary credential. Secondary education practitioners can use these benchmarks to evaluate and monitor progress in assisting students to make the transition from high school to college. The student outcomes are disaggregated by high school characteristics based on income level, minority enrollment, and locale to ensure that the postsecondary outcomes provided can be relevant to the specific needs and characteristics of different types of high schools.
National Highlights
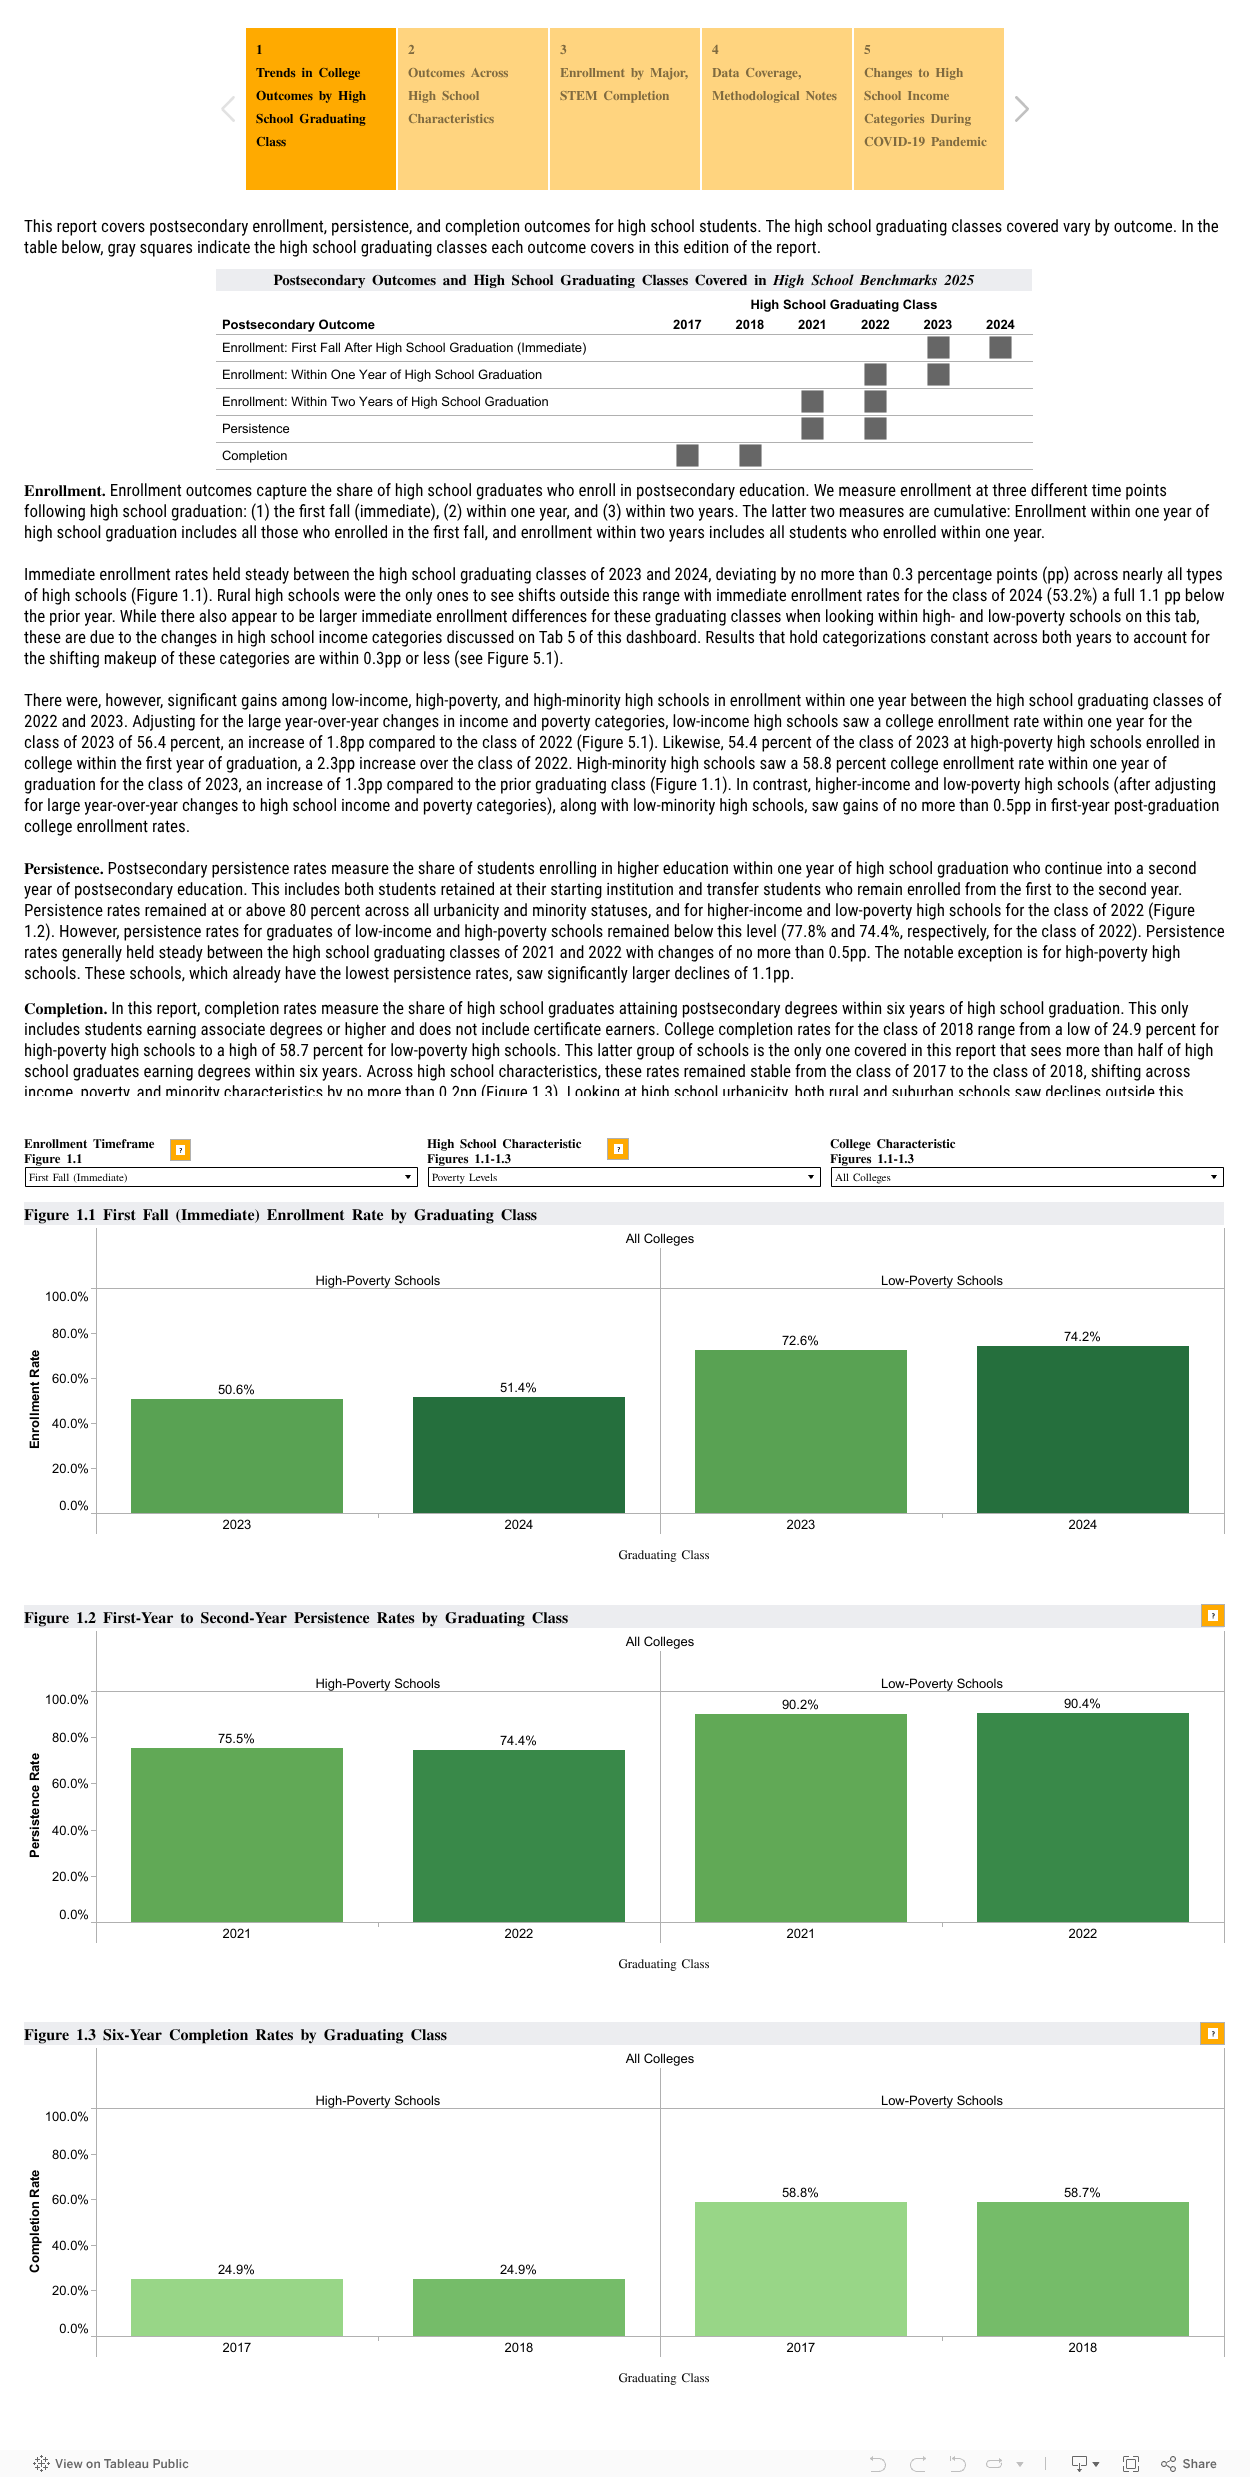
- Differences in immediate fall enrollment remained stable across nearly all high school characteristics for the high school graduating classes of 2023 and 2024.
- Enrollment within one year of high school graduation increased by more than 1 percentage point for low-income, high-poverty, and high-minority high schools between the high school graduating classes of 2022 and 2023.
- Persistence rates from the first to second year of college held largely steady except for high-poverty high schools. These schools—which already have the lowest persistence rates—saw a decline of 1.1pp for the class of 2022 to 74.4 percent.
- Low poverty high schools were the only high schools where more than half of the 2018 high school graduates completed an associate degree or higher within six years. This was true of only one-quarter of 2018 graduates of high poverty high schools.
- Graduates of low-poverty and higher-income high schools were more likely to complete STEM degrees within six years (22.4% and 17.5%, respectively) than their counterparts at high-poverty (8.1%) and low-income (9.1%) high schools.
High School Benchmarks
High School Graduating Classes of 2018, 2022, and 2024
Compare postsecondary enrollment, persistence, and completion rates by high school characteristics using the tabs at the top of the dashboard.
Past Reports
2024: Full Report | Appendix
2023: Full Report | Appendix
2022: Full Report
2021: Full Report
2021: Full COVID-19 Report
2024: Full Report | Appendix
2023: Full Report | Appendix
2022: Full Report
2021: Full Report
2021: Full COVID-19 Report
2020: Full Report
2019: Full Report
2018: Full Report
2017: Full Report
2016: Full Report
2015: Full Report
2014: Full Report
2013: Full Report
Have suggestions for new analyses related to this publication?

Looking for insights beyond our research reports?
Work directly with our team to design research that answers your organization’s specific questions, with the depth, rigor, and data authority the National Student Clearinghouse is known for.