
Completing College – National Extra – 2013
This Signature Completions Extra will present the six-year outcomes for the fall 2007 cohort, not including dual enrollment students. The data will allow readers to compare the fall 2007 cohort results to the fall 2006 cohort results that were presented in November 2012 as part of Signature Report 4, the National Student Clearinghouse Research Center’s first college completion study.
Preview Regarding the Upcoming Second College Completion Study
In December 2013, the National Student Clearinghouse Research Center will release its second college completion study, covering the cohort of first-time students who started in postsecondary education institutions in fall 2007. The study will present postsecondary outcomes for an expanded cohort of students that includes dual enrollment students — those who have previously enrolled in college courses while still in high school. As a result, it is worthwhile to bear in mind a few points that will be different from the first completion study released by the Research Center in November 2012.
- The cohort will be substantially larger in the second college completion study due to the inclusion of the dual enrolled students.
- Dual enrollment students are almost exclusively traditional-age college students and their completion rates are generally higher than other students. Therefore, simply by virtue of including dual enrollment students, the overall completion rates will be higher than those shown in the first completions report for the fall 2006 cohort.
- This difference draws attention to the fact that there are many ways to define a starting cohort and the composition of the cohort can impact the results.
What You Will Find in this Signature Completions Extra Report
In the following brief discussion, we present six-year outcomes for the fall 2007 cohort using the same cohort definitions used in the first completions report for the fall 2006 cohort (excluding dual enrollment students from the cohort). It is our hope that presenting the data in this way will enable a direct comparison with the findings from the first completion study released in 2012.
Results show that while the overall completion and persistence rates remained steady, completion rates for different types of institutions did change slightly. Analysis by the type of the starting institution showed that completion rates increased 1.3 percentage points for students who started at four-year public institutions and 1.1 percentage points for students who started at two-year public institutions.
A Note on Data
The data for this report were drawn from the StudentTracker® and DegreeVerify℠ services, administered by the National Student Clearinghouse® (The Clearinghouse), which tracks 95 percent of college enrollments nationwide across all postsecondary institutions, including all institution types: two-year and four-year institutions, public and private institutions, and nonprofit and for-profit institutions.
This preview report represents selected results for the fall 2007 cohort (N=2,023,429), excluding dual enrollment students (n=374,095). The results using the cohort with dual enrollment students will be reported in the second college completions report to be released in December 2013.
Results
Figure 1. Six-Year Outcomes by Starting Institution Type (Dual Enrollment Students Excluded)
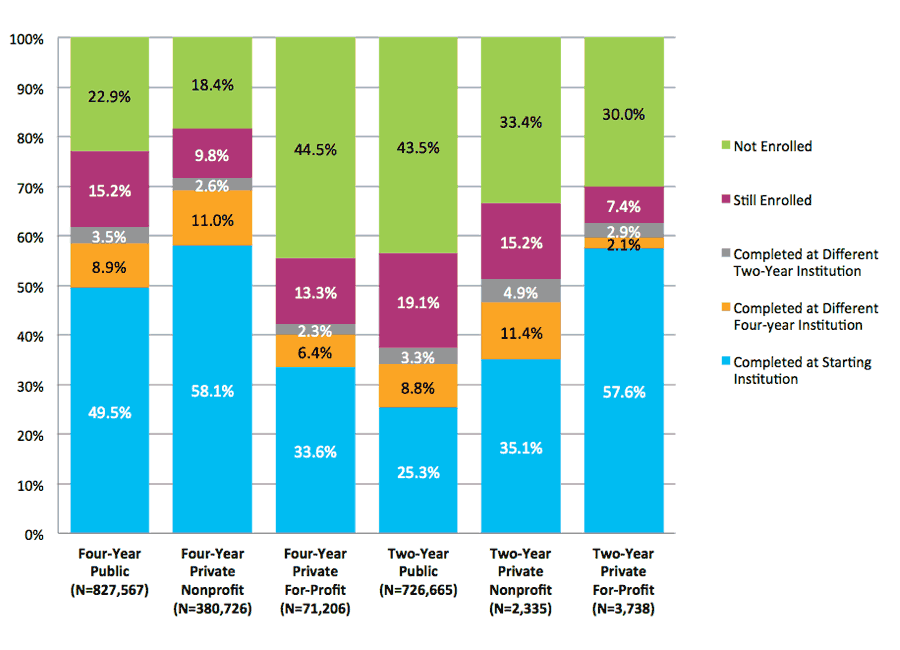
Figure 1 shows six-year outcomes, broken out by the type of institution where students started their postsecondary education. Overall, the total completion rate was the highest for students who started at four-year private nonprofit institutions (71.7 percent). Students who started at four-year public and two-year private for-profit institutions showed similar total completion rates (61.9 percent and 62.6 percent, respectively). The total completion rate was the lowest for students who started at two-year public institutions with only 37.4 percent of students obtaining a credential within six years. The same pattern was observed in Signature Report 4, although completion rates were slightly higher for the 2007 cohort for students who started at four-year public, two-year public, and two-year private nonprofit institutions.
Figure 2. Six-Year Outcomes by Enrollment Intensity (Dual Enrollment Students Excluded)
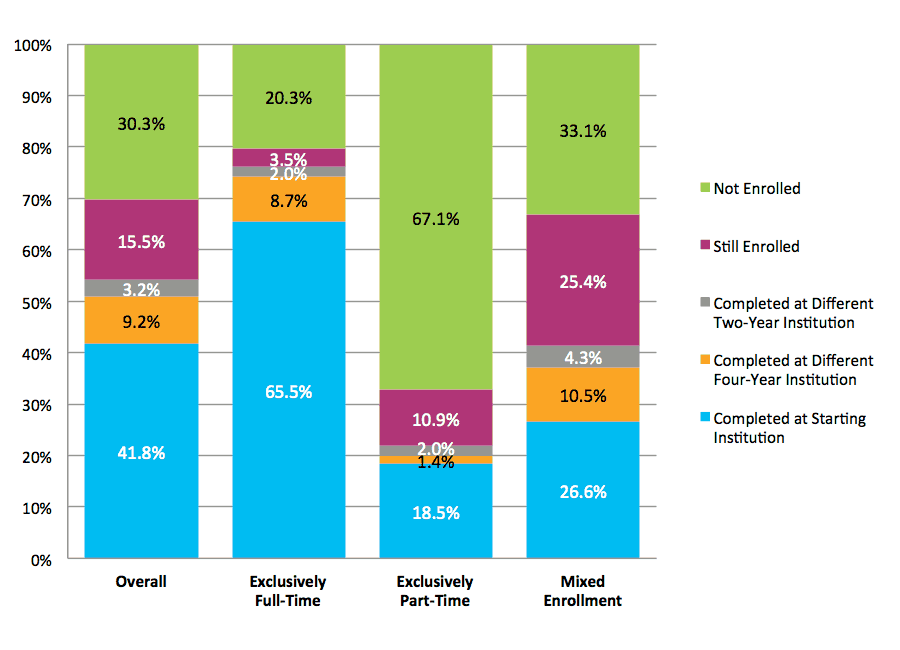
Figure 2 shows six-year student outcomes, including first degree or certificate completion, continuing enrollment during the last year of the study period, and stop-out by enrollment intensity.
Overall, 54.2 percent of the students obtained a credential within six years, with 41.8 percent completing at their starting institution and 12.4 percent at a different institution. These results remained almost unchanged from the first completion study that used the fall 2006 cohort. In the first study, the total completion rate was 54.1 percent, with 42 percent completing at their starting institution and 12.1 percent at a different institution. Completion rates for the three enrollment intensity categories show marked differences.
Exclusively full-time students showed a total completion rate of 76.2 percent, including 10.7 percent who completed at institutions other than their starting institution. 3.5 percent of the exclusively full-time students were still enrolled at the end of the study period, leaving only 20.3 percent of this group no longer enrolled for at least a year before the end of the study period. These results are almost identical to those of the exclusively full-time students in the fall 2006 cohort.
Exclusively part-time students showed a much lower completion rate with only 21.9 percent completing degrees or certificates within six years. As we noted in the previous completion study, six years is not an adequate time frame for capturing completions of students who enroll exclusively part time. The results underscore the need to continue to follow these students over longer periods in order to obtain definitive degree outcomes. This rate is, however, slightly higher (by 1.3 percentage points) than the completion rate of the exclusively part-time students in the fall 2006 cohort.
Mixed enrollment students, a group that comprised more than half of the full cohort, had a total completion rate of 41.4 percent: 26.6 percent completed first at their starting institution and 14.8 percent completed first at a different institution. Another key finding is that the highest proportion of students still enrolled without completing a degree or a certificate by the end of the study period appeared among mixed enrollment students: one-quarter of this group (25.4 percent) were still enrolled at the end of the study period, leaving the percentage of stop-outs at 33.1 percent.
Figure 3. Six-Year Outcomes by Age at First Entry and Enrollment Intensity (Dual Enrollment Students Excluded)
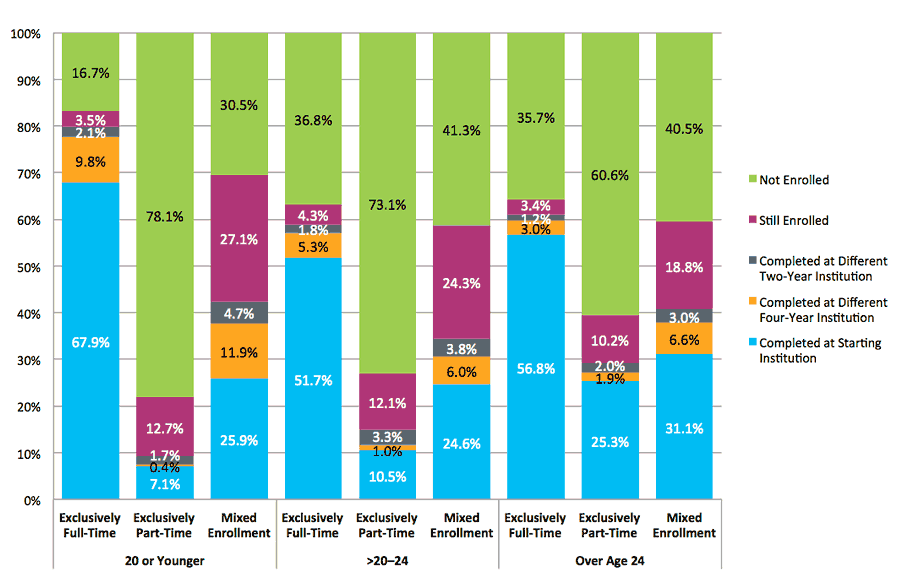
Note: Students with date of birth data missing were excluded from the above figure.
Figure 3 shows students’ six-year outcomes based on age at first entry and enrollment intensity. Not surprisingly, completion rates were the highest for exclusively full-time students regardless of age at first entry. Among exclusively full-time traditional-age students, 79.9 percent obtained a degree or certificate within six years, with 67.9 percent completing first at their starting institution and an additional 12 percent completing first at a different institution. Exclusively full-time students in the adult learners group showed lower completion rates both at their starting institution (56.8 percent) and at a different institution (4.2 percent).
It should be noted that this completion study has three age groups: 20 years old and younger, over 20 years old through age 24, and older than age 24 years. This is different from the two age groups shown in the first completion study (age 24 or younger and over age 24).
Nonetheless, a comparison is possible because:
- The adult learners group was defined in the same way and
- The group over 20 years old through age 24 at first entry (which was part of traditional-age students in the first completion study) was only 6 percent of the cohort.
Therefore, the results for traditional-age students across the two studies are still comparable.
Completion rates for adult learners in the fall 2007 cohort slightly increased across all three enrollment intensity categories, as compared with the rates for adult learners in the fall 2006 cohort. The largest increase was for exclusively part-time students in this group whose completion rate increased from 27.5 percent to 29.2 percent. The completion rates of traditional-age students slightly increased for exclusively full-time and mixed enrollment students, but remained unchanged for exclusively part-time students.
Summation
This Signature Completions Extra demonstrates that the overall completions rate for the entering 2007 cohort remained unchanged from the rates for the 2006 cohort, released in the first report in 2012. Nonetheless, there were small improvements for students who started at specific institution types, notably four-year publics and two-year publics.
The upcoming second Signature Completions Report will present many additional new findings and enable comparisons with the previous cohort. It will also inform public policymakers and the general public about six-year outcomes for the expanded cohort that includes dual enrollment students. The second completion study will also contain completion and persistence rates broken down by subgroups that were not present in the first study, including by gender and other combinations of gender, age, and enrollment intensity.
About This Report
AUTHORS
National Student Clearinghouse Research Center
- Doug Shapiro
- Afet Dundar
Project on Academic Success, Indiana University
- Mary Ziskin
- Xin Yuan
- Autumn Harrell
ACKNOWLEDGEMENTS
The authors would like to thank Vijaya Sampath, Jason DeWitt, and Diana Gillum from the National Student Clearinghouse Research Center and Robin R. LaSota from University of Illinois at Urbana-Champaign, for their efforts to make the Clearinghouse data analysis-ready and sharing their deep knowledge of the data with the authors. Of course, any remaining errors or omissions are solely the responsibility of the authors.