
Persistence & Retention
This report series helps institutions understand first-year college persistence and retention patterns and identify disparities between different students, institutions, or states in this important early success indicator.

This report series helps institutions understand first-year college persistence and retention patterns and identify disparities between different students, institutions, or states in this important early success indicator.

The Final Spring Enrollment Trends report, published each June, provides comprehensive national spring enrollment estimates by credential type, institutional sector, enrollment intensity, student demographics, major field, and state.

The Undergraduate Degree Earners Report provides Insights into undergraduate completers in the 2024-25 academic year by demographic and educational profiles.

A report series on the outcomes for students who start at a community college and transfer to a four-year institution. Outcomes include retention after transferring and bachelor’s completion rates across student groups, four-year institutional characteristics, and states.

The Clearinghouse Enrollment Insights series is created to offer higher education institutions, policy makers, and researchers a continuous and cohesive understanding of enrollment trends. It includes three reports released throughout the academic year.

The Final Fall Enrollment Trends report (previously known as the Current Term Enrollment Estimates fall report) is published every January and provides the final enrollment estimates for the fall term based on comprehensive data. It provides national enrollment estimates by credential type, institutional sector and other characteristics (e.g., locale, selectivity), enrollment intensity, student demographics (e.g., age, race/ethnicity, gender), and major field, as well as state-level enrollment estimates.

The Yearly Progress and Completion report contains many elements previously published in the NSC Research Center’s two primary reports focused on student progress toward credential attainment, Yearly Success and Progress and Completing College. This report combines the year-over-year look at a cohort’s journey toward completion (Yearly Success and Progress) with the in-depth analysis of six-year and eight-year cohort completion rates (Completing College) into an interactive dashboard.

The Preliminary Fall Enrollment Trends report is published every November, providing preliminary enrollment estimates for the fall term. It is first of the Clearinghouse Enrollment Insights series, designed to offer institutions, policy makers, and researchers an early look at enrollment trends for the fall.

The High School Benchmarks Report provides high school-to-college transition rates for graduates of different types of high schools.

This report series seeks to understand the educational trajectories of millions of U.S. adults who left postsecondary education without receiving a postsecondary credential and are no longer enrolled.

Latest enrollment estimates for the current term nationally and by state, reported on by institution types, student groups, and major fields.

A report series on the transfer enrollment and pathways of undergraduate students. How many students transferred, where they transferred to and from, and transfer student demographics are reported for fall 2020 through fall 2024.

The PDP Insights report focuses on students’ first year credit completion ratio (CCR) and credit accumulation rate (CAR). These early momentum measures can offer insights into students’ progression toward degree completion and provide indicators of when and where gaps in ultimate degree attainment between groups may begin.

In the aftermath of the COVID-19 pandemic, colleges and universities are pressed to re-evaluate their long- and short-term strategies, particularly as they pertain to enrollment management and student support services. The Research Center’s Stay Informed report series continues to enable educational and policy leaders to make informed decisions through timely enrollment trend reporting that began with the pandemic.

Transfer enrollment represents 13.2 percent of all continuing and returning undergraduates in fall 2023. The number of students who transferred into a new institution in fall 2023 grew 5.3 percent in fall 2023 compared to fall 2022 (+62,600), driven by students transferring from a two-year institution to a four-year institution (upward transfer, +7.7%).

The Completing College report series provides a comprehensive overview of postsecondary completion trends nationally and by state. For all students who enter postsecondary education for the first time each year, it examines the diverse pathways the student traversed toward completion, as well as a degree or certificate completion rate within six and eight years of enrolling.

A national view of how students are affected by college closures, detailing the subsequent enrollment pathways and completions of more than 143,000 students that attended 467 closed campuses.

This report series measures academic progress in each subsequent academic year for six years after entry, broken out by the type of starting institution and enrollment intensity at entry (full-time vs. part-time). Results do not account for enrollment intensity changes after entry.

As the ninth report in the series, this edition highlights notable transfer enrollment changes and student persistence post-transfer over a two-year period since the pandemic started, disaggregated by academic year, student demographic characteristics, and institution sector and selectivity.

In fall 2019, overall postsecondary enrollments decreased 1.3 percent or more than 231,000 students from the previous fall to 17.9 million students.

This seventh annual report provides the most current data on high school graduates’ postsecondary enrollment, persistence, and completion outcomes. It provides the most relevant benchmarks for evaluating and monitoring progress in assisting students to make the transition from high school to college. This year’s report examines the immediate college enrollment for high school graduating class of 2018, persistence for class of 2016, and completion for class of 2012. We continue to see large gaps between higher-income and low-income high schools on all fronts.

Among all students who enrolled in college for the first time in fall 2017, 73.8 percent persisted at any U.S. institution in fall 2018, while 61.7 percent were retained at their starting institution

In the current term (spring 2019) overall postsecondary enrollments decreased 1.7 percent from the previous spring.

By the end of year four, 43.7 percent had completed a postsecondary credential, while 23.0 percent were no longer enrolled. By the end of year six, 64.3 percent had graduated, while 26.6 percent had left college without earning a credential.

This supplemental feature to our Signature Report on College Completions released in December 2016, contains an analysis of the eight-year completion outcomes for the fall 2010 cohort. In our previous signature reports on college completions, we provided a brief analysis of the eight-year outcomes following the main discussion of six-year outcomes.

This seventh annual report on national college completion rates offers a look at the six-year outcomes for students who began postsecondary education in fall 2012. It looks at the various pathways students took toward degree completion, as well as the completion rates through Spring 2018 for the different groups of students who followed each pathway.

In the current term (fall 2018) overall postsecondary enrollments decreased 1.7 percent from the previous fall.

Our sixth annual report provides the most updated data on high school graduates’ college access, persistence, and completion outcomes. The report provides the most relevant benchmarks for evaluating and monitoring progress in assisting students to make the transition from high school to college.

This third report on transfer and mobility examines multiple transfer pathways for the cohort of students who started postsecondary education in fall 2011. It analyzes student enrollment patterns across different institutions and across state boundaries, including — for the first time — disaggregations by race and ethnicity.

Of all students who started college in fall 2016, 73.9 percent persisted at any U.S. institution in fall 2017, while 61.6 percent were retained at their starting institution.

In the current term (spring 2018) overall postsecondary enrollments decreased 1.3 percent from the previous spring.

By the end of year four, 42.1 percent of individuals who began college in fall 2011 had completed a postsecondary credential, while 23.5 percent were no longer enrolled. By the end of year six, 63.1 percent had graduated, while 27.4 percent had left college without earning a credential.

In fall 2017, overall postsecondary enrollments decreased 1.0 percent from the previous fall.

This sixth annual report on national college completion rates offers a look at the six-year outcomes for students who began postsecondary education in fall 2011. It looks at the various pathways students took toward degree completion, as well as the completion rates through June 2017 for the different groups of students who followed each pathway.

Of all associate degrees reported to the Clearinghouse for the 2010-11 academic year, 575,067 were earned by students with no previous degrees or certificates. Within the next six academic years, 65.1 percent of these students enrolled at four-year institutions and 41.4 percent earned bachelor’s degrees.

Our fifth annual report provides the most updated data on high school graduates’ college access, persistence, and completion outcomes. The report provides the most relevant benchmarks for evaluating and monitoring progress in assisting students to make the transition from high school to college.

Of all associate degrees reported to the Clearinghouse for the 2010-11 academic year, 575,067 were earned by students with no previous degrees or certificates. Within the next six academic years, 65.1 percent of these students enrolled at four-year institutions and 41.4 percent earned bachelor’s degrees.

Of all students who started college in fall 2015, 73.4 percent persisted at any U.S. institution in fall 2016, while 61.1 percent were retained at their starting institution. The persistence rate is the percentage of students who return to college at any institution for their second year, while the retention rate is the percentage of students who return to the same institution.

In spring 2017, overall postsecondary enrollments decreased 1.5 percent from the previous spring.

This supplement to our Signature Report 12 provides six-year completion rates disaggregated by race and ethnicity for students who began postsecondary education in fall 2010.

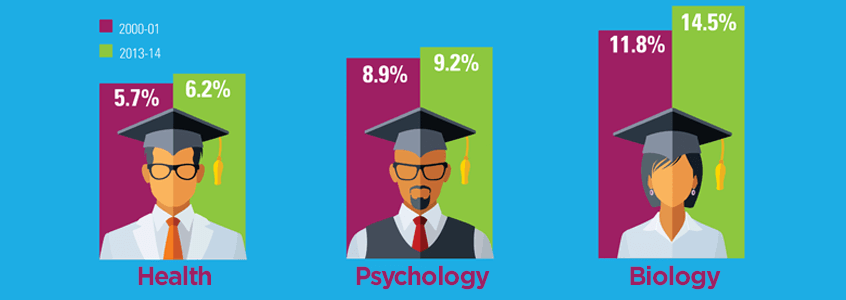
From 2006 to 2016, degree attainment in the so-called “hard sciences” increased in prevalence for both genders. Excluding social sciences and psychology, the percentage of bachelor’s degrees accounted for by S&E disciplines increased five percentage points for men, and two percentage points for women.

In the 2015-16 academic year, 49 percent of students who completed a four-year degree were enrolled at a two-year institution at some point in the previous 10 years.

By the end of year four, 40.5 percent of individuals who began college in fall 2010 as full-time degree-seeking students had completed a postsecondary credential, while 24.5 percent were no longer enrolled. By the end of year six, 61.1 percent had graduated, while 28.5 percent had left college without earning a credential.

Key community college metrics are provided for three areas — college access and persistence, transfer and mobility, and certificate and degree completion — which are important indicators of community college progress.

In fall 2016, overall postsecondary enrollments decreased 1.4 percent from the previous fall.

This fifth annual report on national college completion rates offers a look at the six-year outcomes for students who began postsecondary education in fall 2010, toward the end of the Great Recession. It looks at the various pathways students took toward degree completion, as well as the completion rates through May 2016 for the different student types who followed each pathway.

Our fourth annual report provides new data on high school graduates’ college access, persistence, and completion outcomes. The data in this report are presented for students from different types of high schools, such as low versus higher income and low versus high minority, to enable more focused discussions, particularly about low income and minority students traditionally not well served by higher education.

This report examines time to degree completion for a cohort of students who earned an associate degree as their first and only postsecondary degree or a bachelor’s degree as their first four-year degree between July 1, 2014, and June 30, 2015. Overall, the average time enrolled for associate and bachelor’s degree earners was 3.3 years and 5.1 years, respectively. However, as the report shows, the time required for successful degree attainment could be influenced by the pathway the student followed as well as by factors, such as stop outs and less than full-time enrollment status.
During the Great Recession, there was a slight increase in the percentage of bachelor’s degree earners who opted to continue their educations at two-year institutions. However, that percentage has now dropped well below pre-recession levels, with only 5.8 percent of 2013-14 bachelor’s degree earners having returned to college at two-year institutions.

Of all associate degrees reported to the National Student Clearinghouse for the 2009-10 academic year, 536,351 were earned by students with no previous degrees or certificates. Within the next six academic years, over 64 percent of these students enrolled at a four-year institution and 41 percent earned a bachelor’s degree.

In spring 2016, overall postsecondary enrollments decreased 1.3 percent from the previous spring.

Of all students who started college in fall 2014, 72.1 percent persisted at any U.S. institution in fall 2015, while 60.6 percent were retained at their starting institution.

During the 2014-15 academic year, 9.4 percent of all students attended more than one institution, a figure that has remained constant for the last three years. In each year shown, the mobility rate was highest for students who began the academic year at a two-year public institution.

This snapshot goes beyond traditional measures of postsecondary attainment by tracking the fall 2009 entering cohort over time, and showing persistence, stop-out, and completion rates at the end of each subsequent academic year. The model tracks outcomes for both full-time and part-time starters, and takes spring and summer terms into account.
In the current term (fall 2015 overall postsecondary enrollments decreased 1.7 percent from the previous fall.

Signature Report 10 from the National Student Clearinghouse Research Center provides six-year outcomes for first-time degree-seeking students, including former dual enrollment students, who started in postsecondary education institutions in fall 2009. It offers a look at the attainment rates for students who began their postsecondary education as the Great Recession was ending.

Our third annual report provides new data on high school graduates’ college access, persistence, and completion outcomes, including completions in STEM fields. Data are presented for students from different types of high schools, such as low versus higher income and low versus high minority, to enable more focused discussions about low income and minority students traditionally not well served by higher education.

This second report on transfer and mobility, examines multiple transfer pathways for the cohort of students who started postsecondary education in 2008. It reveals how student enrollment patterns that involve multiple movements among two or more institutions and across state boundaries has become the new normal, demonstrating the need for a comprehensive view of student transfer and mobility to inform education policymaking and institutional improvement efforts.

Of all associate degrees earned in 2008-09 that were reported to the National Student Clearinghouse, 488,046 were found to be the first postsecondary credential earned by a student. Forty-one percent of these students went on to earn a bachelor’s degree within six years.

In the current term (spring 2015), overall postsecondary enrollments decreased 1.9 percent from the previous spring. This report includes national enrollment estimates as well as subtotals by institutional sector, state, enrollment intensity, age group, and gender.

The overall persistence rate for students who entered college in Fall 2013 was 1.0 percentage points higher than that of students who entered college in Fall 2012, while the retention rate increased by 1.1 percentage points.

In the 2013-14 academic year, 46 percent of students who completed a four-year degree were enrolled at a two-year institution at some point in the previous 10 years.

Nationally, 14.6 percent of all 2013-14 college graduates attended college in at least one other state or territory in the 10 years prior to receiving a credential.

From 2004 to 2014, science and engineering degrees increased in prevalence for both genders. The trend was driven by growth in the so-called “hard sciences.”
In fall 2014, overall postsecondary enrollments decreased 1.3 percent from the previous fall. In fall 2014, enrollments decreased among two-year public institutions (-6.0 percent) and four-year for-profit institutions (-0.4 percent). Enrollments increased among four-year public institutions (+2.2 percent) and four-year private non-profit institutions (+1.6 percent).

Signature Report 8 from the National Student Clearinghouse Research Center provides six-year outcomes for first-time degree-seeking students, including former dual enrollment students, who started in postsecondary education institutions in fall 2008. This is the first look at the attainment rates for students who began their postsecondary education during the Great Recession.

Our second annual report provides high school-to-college transition rates for graduates of public non-charter, public charter, and private high schools. For students of public non-charter high schools the rates are reported in 12 categories based on the school-level demographic and geographic characteristics.

Of all associate degrees earned in 2008-09 that were reported to the National Student Clearinghouse, 488,046 were found to be the first postsecondary credential earned by a student. Forty-one percent of these students went on to earn a bachelor’s degree within six years.
In the current term (spring 2014), overall postsecondary enrollments decreased 0.8% from the previous spring. Enrollments decreased among four-year for-profit institutions (-4.9 percent) and two-year public institutions (-2.7 percent). However, enrollments increased slightly among four-year public institutions (+0.7%) and four-year private non-profit institutions (+2.0%).

Just over 9% of all students attended more than one institution during the 2012-13 academic year. Overall, student mobility rates increased from 2010-11 to 2011-12, and then stabilized in 2012-13.
This second annual report on national college completions rates continues to respond to the limitations of institution-based research by focusing on student-level data, tracking the completion of postsecondary certificates and degrees among first-time degree-seeking students who started their postsecondary education in fall 2007 and tracking their enrollments nationwide for six years, through the spring of 2013. The report also introduces an enhancement to the first Completions Report by including in the cohort students who entered college with prior experience in college-level courses through dual enrollment opportunities while still in high school.
In fall 2013, overall postsecondary enrollments decreased 1.5% from the previous fall. In fall 2013, enrollments decreased among four-year for-profit institutions (-9.7 percent) and two-year public institutions (-3.1 percent). However, enrollments increased slightly among four-year public institutions (+0.3%) and four-year private non-profit institutions (+1.3%).
This Signature Completions Extra will present the six-year outcomes for the fall 2007 cohort, not including dual enrollment students. The data will allow readers to compare the fall 2007 cohort results to the fall 2006 cohort results that were presented in November 2012 as part of Signature Report 4, the National Student Clearinghouse Research Center’s first college completion study.
Between 2009 and 2013, students over the age of 26 showed a 25% growth rate in science and engineering bachelor’s degree completion compared to a 19% growth rate among students age 26 or under at time of completion.
Between 2009 and 2013, S&E bachelor’s degree completions for both men and women had almost identical growth at 20% and 21%, respectively. With social sciences and psychology included, women accounted for 50% of all S&E bachelor’s degrees in both 2009 and 2013.
This report provides high school-to-college transition rates for graduates of public high schools. The rates are reported for students from six categories of high schools, based on the school-level demographic and geographic characteristics.
In our fifth Signature Report, we examine an increasingly important role community colleges play in helping students attain a baccalaureate degree. As our results show, going from a two-year to a four-year institution is a very successful pathway to a bachelor’s degree for those who transfer.
6.5% of students who graduated with a bachelor’s degree in 2008-09 enrolled in a two-year institution within the next two academic years, an increase from 5.9 percent of 2004-05 graduates.
In the current term (spring 2013), enrollments have decreased, compared to the previous spring, in every sector except four-year private nonprofits, with the largest decreases taking place among four-year for-profits (-8.7 percent) and two-year publics (-3.6 percent).
In the current term (fall 2012), enrollments have decreased in every sector except four-year private nonprofits, with the largest decreases taking place among four-year for-profits (-7.2 percent) and two-year publics (-3.1 percent).
In academic year 2011-12, nearly a third of the first-time college students in two-year public institutions began college in January or later months.
In our fourth Signature Report, we examine the various pathways that students take to complete a college degree or certificate. Our report goes beyond traditional graduation rate calculations that focus on first-time full-time students who finish at their starting institution to provide the most comprehensive look at student outcomes on today’s campuses.
The National Student Clearinghouse Research Center examined the postsecondary outcomes of students who transferred from two-year to four-year institutions in three different academic years.
From 2007-08 to 2010-11, the number of degrees awarded to students age 25 and older increased by 22%, compared to 17% for those under age 25.
For many students, the path to successfully completing a degree at a four-year institution includes enrollment at one or more two-year institutions. In the 2010-11 academic year, 45 percent of all students who completed a degree at a four-year institution had previously enrolled at a two-year institution.
On average, 15.1 percent of all U.S. postsecondary students who received undergraduate degrees in 2010-11 had previously attended college in at least one other state or territory. The National Student Clearinghouse Research Center has identified the percentage of undergraduate degree completers in the 2010-11 academic year who had prior enrollments in at least one other state or territory.
In our third Signature Report, we examine enrollment pathways of reverse transfer students, those who moved from four-year to two-year institutions outside of summer months. Understanding this type of student mobility can help campus policymakers at both two-year and four-year institutions craft policies that will help institutions reach their enrollment goals and better assist students in making decisions about their educational pathways.
According to the National Student Clearinghouse Research Center, on average, 38 percent of all students, undergraduate and graduate, in a fall term are adult learners.
In our second Signature Report, we analyze students’ transfer behaviors to better understand their postsecondary pathways. A detailed view of transfer rates is critical in helping institutions and policymakers develop strategies and policies that facilitate successful outcomes.
According to the National Student Clearinghouse Research Center, 3.2% of all students attended two or more postsecondary institutions concurrently during its one-year study period. Concurrent enrollment in this report occurs when a student’s enrollment at two or more postsecondary institutions overlaps by at least 30 days.
According to the National Student Clearinghouse Research Center, 8% of students attended more than one postsecondary institution in 2010-2011. The most mobile students were those with both full- and part-time statuses, with 17.2% of these students attending more than one institution during a single year.
National Student Clearinghouse Research Center Snapshot Report on college student’s persistence rates by percentage of college students staying in school and how persistence varied by type of institution for 2010.
The first Signature Report separates fact from fiction on the Great Recession’s impact on higher education enrollment, bringing college administrators and policymakers the knowledge on how the changed economy has altered student behaviors in enrollment and persistence.