

Completing College – National – 2017
This sixth annual report on national college completion rates offers a look at the six-year outcomes for students who began postsecondary education in fall 2011. It looks at the various pathways students took toward degree completion, as well as the completion rates through June 2017 for the different groups of students who followed each pathway.
Suggested Citation: Shapiro, D., Dundar, A., Huie, F., Wakhungu, P.K., Yuan, X., Nathan, A. & Bhimdiwali, A. (2017, December). Completing College: A National View of Student Completion Rates – Fall 2011 Cohort (Signature Report No. 14). Herndon, VA: National Student Clearinghouse Research Center.
Table of Contents
- About This Report
- Executive Summary
- Introduction
- Figures and Tables
- Results
- Students Who Started at Two Year Public Institutions
- Students Who Started at Four-Year Private Non-profit Institutions
- Students Who Started at Four-Year Private For-Profit Institutions
- Supplemental Feature: Eight‐Year Outcomes for Fall 2009 Cohort
- Discussion
- References
- Appendix A: Methodological Notes
- Appendix B: Coverage Tables
- Appendix C: Results Tables
About This Report
AUTHORS
National Student Clearinghouse Research Center
- Doug Shapiro
- Afet Dundar
- Faye Huie
Project on Academic Success, Indiana University
- Phoebe Khasiala Wakhungu
- Xin Yuan
- Angel Nathan
- Ayesha Bhimdiwala
ACKNOWLEDGEMENTS
The authors would like to thank Victor Borden, director of Project on Academic Success and Professor of Higher Education and Student Affairs at Indiana University. His comments and suggestions were extremely important to the development of the report. We would also like to acknowledge Youngsik Hwang, a member of the Project on Academic Success team, for his efforts and thoughtful comments and Diana Gillum, the team member of the National Student Clearinghouse Research Center, for her work to make the Clearinghouse data analysis ready. Of course, any remaining errors or omissions are solely the responsibility of the authors.
Executive Summary
This Signature Report investigates the six-year completion outcomes of the students who began their postsecondary education in fall 2011. The overall national six-year completion rate for the fall 2011 cohort was 56.9 percent, an increase of 2.1 percentage points from the fall 2010 cohort. This higher completion rate represents about 48,000 more graduates than the fall 2010 cohort, even with a slightly smaller cohort size.
Major Findings and Implications
Continued Increase in Overall Completion Rates
One of the major findings from the previous completions report, on the fall 2010 entering cohort, was that the overall completion rate had increased for the first time since the Great Recession, rising 1.9 percentage points to 54.8 percent. Although promising, that was still more than one point lower than the pre-recession high of 56.1 percent reached by the cohort that entered college in 2007. For the current 2011 cohort, the six year completion rate grew by an additional 2.1 points, surpassing the pre-recession rate.
Increases in Traditional-Age Students and Full-Time Enrollments
There was a three percentage point increase in the proportion of traditional-age students, from 73.8 percent to 76.8 percent, and a decrease in the proportion of adult enrollments, from 18.8 to 13.7 percent of the cohort. Prior reports have shown that traditional-age students are more likely than delayed-entry and adult learners to complete a credential within six years. In the 2011 cohort, 61.7 percent of traditional-age students completed a credential, compared to 41.7 percent for adult learners. The shift to a younger cohort alone accounts for some of the rise in the overall completion rate, yet there was also a nearly two percentage point increase in the completion rate for traditional-age students, from 59.9 percent to 61.7 percent, and a nearly one point increase among adult learners, from 40.8 to 41.7 percent.
Along with more traditional-age students, the share of full-time students also increased, from 39.5 percent in 2010 to 45.7 for the 2011 cohort. This contributed directly to the overall increase in the completion rate as well. Specifically, 80.1 percent of students who enrolled exclusively full-time completed a degree, compared to 20.5 percent for exclusively part-time students and 39.5 percent for mixed enrollment students.
Increase in Completion Rates for Students Who Started at Four-Year Public and Four-Year Private Nonprofit Institutions
The share of students enrolling in four-year public institutions increased by 2.7 percent of the cohort, and 1.9 percent more enrolled at four-year private nonprofits, compared to the 2010 cohort. These institutional sectors have higher completion rates to begin with, yet each also showed markedly improved rates this year. The total completion rate for students who started at a four-year public institution increased from 62.4 to 64.7 percent, while the four-year private nonprofit rate grew from 73.9 to 76.0 percent, an increase of over 2 percentage points from the 2010 cohort for both sectors.
Decrease in Two-Year Public Enrollments
There was a substantial decrease in the proportion of students enrolling in two-year public institutions, from 37.3 percent of the 2010 cohort to 33.8 percent of the 2011 cohort. There was also a decline in the total completion rate for two-year starters, from 39.3 percent for the 2010 cohort to 37.5 percent for 2011, regardless of whether the completions occurred at a two-year or a four-year institution. About half of the decline in the share of the cohort, and all of the decline in the completion rate, however, were due to a definitional change: dual enrollment high school students were excluded from the 2011 cohort. Without this exclusion, the completion rate would have increased slightly, to 40.1 percent.
Enrollment and Completion Disparities by Race and Ethnicity
When examined by race and ethnicity, Asian and white students had much higher completion rates (68.9 percent and 66.1 percent, respectively) than Hispanic and black students (48.6 percent and 39.5 percent, respectively). Black students represent the only group that is more likely to stop out or discontinue enrollment than to complete a credential within six years (total completion rate of 39.5 percent, compared to the no longer enrolled rate of 42.8 percent).
Among students who started in four-year public institutions, black students had the lowest six-year completion rate (46.0 percent). The completion rate of Hispanic students was almost 10 percentage points higher (55.7 percent). Over two-thirds of white students (71.7 percent) and three-quarters of Asian students (75.8 percent) completed a degree within the same period.
Eight-Year Outcomes for the Fall 2009 National Cohort
We examined the eight-year outcomes for the fall 2009 cohort, tracking both their six-year enrollment and completion patterns as of spring 2015, and their eight-year outcomes as of spring 2017. Given these two extra years, an additional 6.1 percent of the cohort completed degrees. This brought the total completion rate to 59.0 percent, including 42.8 percent who completed at their starting institution and an additional 16.1 percent who completed at a transfer institution. At the same time, the percentage of students who were still enrolled at the end of the eight-year period was 7.1 percentage points lower than at the six-year period (7.0 percent and 14.1 percent, respectively).
Implications for Policy
In our previous reports, the effects of the Great Recession on higher education were clear. There were large increases in enrollments among adult and part-time students and declines in the proportion of students completing a credential. In last year’s report, on outcomes for the 2010 entering cohort, signs of the post-recession recovery were beginning to show. Enrollments began to return to normal and the completion rates rebounded as well. For the 2011 cohort, the signs of post-recession recovery were even clearer: adult students shrank as a share of the cohort, enrollments in four-year public and four-year private nonprofit institutions increased their share of the cohort, and the total completion rate surpassed the pre-recession high.
In the coming years, demographic changes will overtake economic shifts in their impact on college completion rates, as the number of high school graduates declines and their diversity continues to increase. The challenges for institutions now serving the potential graduates of the cohorts that entered college in 2012 and later include continuing to adapt their programs to better meet the size, demographic composition, and academic needs of these cohorts.
The gaps in completion rates identified in this report, based on student enrollment behaviors, such as enrollment intensities, age at entry, and transfer and mobility among multiple institutions, can help point the way, showing where more work is needed to tailor programs and policies for specific student populations.
Using comprehensive student-level data to investigate enrollment and completion outcomes on the national level enables a broad understanding of the changes that occur each year in postsecondary education in the U.S. We hope this report serves as a useful benchmarking tool for practitioners and policymakers as they create, track and evaluate the efficacy of current policies and programs for serving the needs of today’s students.
Introduction
This report, the sixth in an annual series of completions reports from the National Student Clearinghouse Research Center, presents six-year outcomes for students who first entered college in the fall of 2011. One of the key features of these reports is the calculation of a single national college completion rate that takes into account all first-time students, regardless of enrollment intensity or type of institution attended. We do this because in today’s world of post-traditional mobile students, it no longer makes sense to presume that educational goals and pathways are determined by the enrollment behaviors observed in the very first semester of college. For example, most students today are neither full-time nor part-time exclusively, but pursue a mix of enrollment statuses during different semesters over time. Two-thirds of all bachelor’s degree graduates attend more than one institution in pursuit of their degree, including over half who attend community colleges along the way and one-fifth who earn an associate degree first. Even among associate degree recipients, nearly half now attend more than one institution (all figures from Time to Degree, Shapiro et al., 2016a). Given this level of student mobility among colleges, degree programs and enrollment statuses, it makes sense simply to ask: of all students who started college in fall 2011, how many completed a degree or certificate, of any kind, anywhere by spring 2017?
Over the span of our six reports, we have observed the overall national college completion rate varying from a high of 56.1 percent, for the pre-recession 2007 entering cohort, to a low of 52.9 percent for the students who entered college during the depths of the recession in fall 2009 (Shapiro et al., 2013, 2015, respectively). These variations are important indicators of the shifting national context of student success, within which individual colleges and universities need to consider the outcomes of their own students.
At the same time, institutions also need clear benchmarks for measuring the outcomes of similar students at similar types of institutions to their own. To that end, this report also presents detailed breakdowns of completions rates by student age, gender and enrollment status as well as institutional level and control. These results provide institutions, states, researchers, and policymakers with current benchmarks to document and evaluate graduation rate changes and progress over time.
As college completion continues to be the focus of state and national policy agendas, many organizations and states have undertaken initiatives to increase graduation rates and improve student success. Leading policy and educational organizations have set goals to increase, by as much as double, the number of individuals with a college degree or credential by 2025 (Bill and Melinda Gates Foundation, 2015; College Board Advocacy and Policy Center, 2010; Lee, et al., 2011; Lumina Foundation for Education, 2009). Supplementing the efforts of national campaigns, states have also adopted programs focused on identifying barriers in the areas of college admissions, affordability, access, and success.
Research reveals continued gaps in college completion among various racial and ethnic groups (Shapiro et al., 2017; U.S Department of Education, 2016, 2017). While the goal of various initiatives is to increase college completion rates overall, there is also an ongoing need to minimize the gaps in college participation and completion rates among demographic and socioeconomic groups, and across states (Witham et al., 2015). Furthermore, in order to improve college graduation rates, policymakers and researchers suggest that colleges and universities increase their use of data to inform their decisions, and incorporate more evidence-informed practices in their processes and practices. Institutions can use data-based analyses and evaluation to make informed decisions that can contribute to increasing college completion rates (College Board Advocacy and Policy Center, 2008; Phillips and Horowitz, 2013). For these reasons, we introduced breakdowns by student race and ethnicity in a supplement to the 2016 National Completions Report, and incorporate them fully into the main report with this release.
Community colleges play a unique and important role in the U.S. higher education system, not only by awarding certificates and degrees, but also by serving as an entry point for many students who ultimately obtain a bachelor’s degree (National Center for Public Policy and Higher Education, 2011). Approximately, over a third of first-time freshmen begin their postsecondary education at a community college (Shapiro et al., 2016b). Of those students, 75 percent are minority students and 44 percent are low-income students (Ma & Baum, 2016). Despite initiatives to promote student success, especially among those from low income and minority groups, many barriers remain that make it difficult for students to seamlessly transfer from two-year to four-year institutions (Senie, 2014; Townsend & Wilson, 2009; Kopko & Crosta, 2016). Some issues include disparities in student academic preparedness, others have to do with articulation agreements, or lack thereof, between two-year and four-year institutions (Bailey, 2012; Bailey & Cho, 2010; Doyle, 2009; Henry & Stahl, 2017; Ishitani, 2006). For these reasons, we pay particular attention in this report to the completions at four-year institutions earned by students who started in two-year institutions, including completions for students who transferred after having first earned an associate degree and those who did not.
What to Find in This Report
This report examines the rate of completion of postsecondary certificates and degrees by first-time-in-college degree-seeking students who initially enrolled in two- and four-year colleges and universities (public, private nonprofit, or private for-profit) nationwide in fall 2011. It tracks their enrollment behaviors and outcomes for six years, through spring 2017. The study cohort includes former dual enrollment students (first-time college students in fall 2011 who had previously taken college courses while still in high school) and excludes current dual enrollment students (who first took college courses while still in high school in fall 2011).
- Measures of Success: Six-year outcomes provided in this report include completions at students’ starting institutions, completions at transfer institutions, and continued enrollment (for noncompleters) through the end of the study period. While the report emphasizes students’ first completions, it also examines subsequent completions at four-year institutions for students whose first credential was awarded by a two-year institution. Six-year postsecondary outcomes are presented by students’ age at first entry into college, gender, race and ethnicity and the level and control of the institution where they first enrolled. Results are also presented for students in three categories of enrollment intensity: (1) exclusively full-time enrollment, (2) exclusively part-time enrollment, and (3) enrollments showing both full- and part-time terms during the six years examined (mixed enrollment).
- Supplemental Feature: Explores eight-year postsecondary outcomes for students in the fall 2009 entering cohort.
- Discussion Section: Highlights and discussion of the major findings of the report, including how they compare to the outcomes for the fall 2010 cohort.
A Note on the Data
Data Source
The data for this report were drawn from the StudentTracker℠ and DegreeVerify℠ services, administered by the National Student Clearinghouse® (The Clearinghouse), which tracks 97 percent of college enrollments nationwide across all postsecondary institutions, including all institution types: two-year and four-year institutions, public and private institutions, and nonprofit and for-profit institutions. In order to ensure the most accurate possible representation of student outcomes for the study cohort, the results reported here are weighted according to the formula described in Appendix A using the state-by-state coverage rate for each institution type (sector and control). A complete explanation of national coverage rates and the weights used to ensure that results reflect enrollment and completion by sector and control can be found in Appendices A and B.
The student outcomes captured in this report are based on student-level data representing an unduplicated headcount of students across all institutions, a feature of the Clearinghouse data sets that distinguishes them from many other data sources, including the Integrated Postsecondary Education Data System (IPEDS), that may not accurately capture the complexity of postsecondary pathways because they are not structured to identify multiple enrollments by individual students. The capability of StudentTracker to link enrollment records across institutions nationally allows researchers to follow students longitudinally as they move from institution to institution, producing a fuller picture of college persistence and completion.
Cohort Definition
The cohort examined in this study is made up of first-time degree-seeking students, of age 18 or older, who began their postsecondary studies in the fall of 2011. Showing intent to earn a degree or certificate was defined as follows:
- For students who started at four-year institutions, enrolled at least one term with an intensity of half-time or higher; and
- For students who started at two-year institutions, either:
- Enrolled full-time for at least one term before August 13, 2012, or
- Enrolled three-quarter-time for at least one term before December 31, 2012, or
- Enrolled at least half-time for any two terms before December 31, 2012.
First-time status was established by confirming that a student (1) did not show any postsecondary enrollment record prior to fall 2011 (not counting dual enrollments while still in high school), and (2) did not receive a degree or certificate from any postsecondary institution prior to fall 2011, according to Clearinghouse data.
Former dual enrollment students, identified as those with postsecondary enrollment prior to fall 2011 that occurred before the student turned 18 years old, represent 17.2 percent of the fall 2011 cohort. By sector, these students represent 20 percent of those who started in four-year public institutions, 15 percent of the students who started in two-year public institutions, and 16 percent of those who started in four-year private nonprofit institutions. Only 5 percent of the students who started in four-year private for-profit institutions had prior dual enrollments. Results throughout this report include former dual enrollment students.
Depending on the strengths and limitations of the data sets they use in their analysis, researchers face considerable complexity in operationalizing the category “first-time student.” For this report, the Clearinghouse and the Project on Academic Success (PAS) balanced competing priorities in selecting a method for identifying the study cohort. On the one hand, Clearinghouse data allowed the researchers to capture a unique headcount of students nationally and, therefore, to follow individual students while also accounting for concurrent enrollments. In addition, Clearinghouse data allowed the researchers to establish first-time enrollment status empirically, i.e., by searching for prior enrollments rather than by relying on institutions’ reports, which may include idiosyncratic definitions as well as errors in transactional records. On the other hand, some limitations do arise with the method for identifying the study cohort in this report.
This year, to improve the definition of “first-time student,” two changes were made from the methods of previous Research Center completions reports:
- We excluded students who were enrolled in college courses in fall 2011 while still in high school (“current” dual enrollment students);
- We extended our look-back for prior postsecondary enrollments to all years of Clearinghouse data (up to 25 years) when identifying non-first-time (returning) students to exclude.
In previous years’ reports, we excluded students with prior enrollments based on a look-back of only four years prior to the cohort year, and we did not exclude students who were dual enrolled in high school during fall 2011.
See Appendix A (Methodological Notes) for a more detailed discussion of current and previous cohort definitions, as well as comparisons of the new vs. old definitions in terms of cohort demographic composition and outcomes.
Figures and Tables
Figure 1. Fall 2011 Cohort By Starting Institution Type (N=2,270,070)*
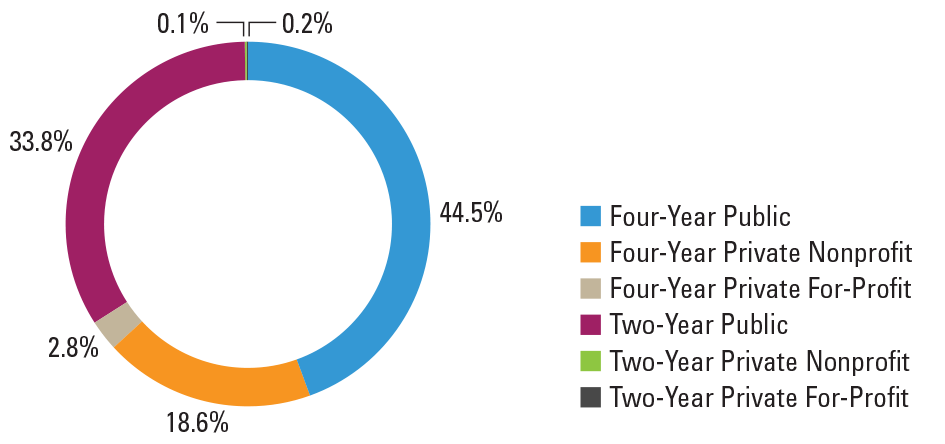
Figure 1 shows the fall 2011 cohort (n=2,270,070), disaggregated by type of starting institution. The largest proportion of students (44.5 percent, n=1,010,658) were enrolled at four-year public institutions, followed by two-year public institutions (33.8 percent, n=767,129), and four-year private nonprofit institutions (18.6 percent, n=423,190). Four-year private for-profit institutions enrolled 2.8 percent of students (n=63,378) whereas the lowest proportion of enrollments were at two-year private nonprofit institutions and two-year private for-profit institutions (0.1 percent and 0.2 percent, respectively).
Figure 2. Fall 2011 Cohort by Age at First Entry (N=2,270,070)*
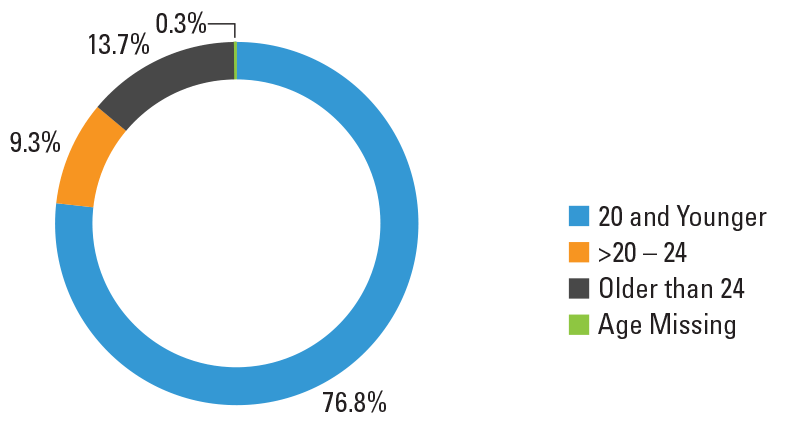
Figure 2 shows that the majority of the students in the study cohort were traditional-age students (76.8 percent), followed by delayed entry students (9.3 percent), and adult learners (13.7 percent)
Figure 3. Fall 2011 Cohort by Enrollment Intensity (N=2,270,070)*
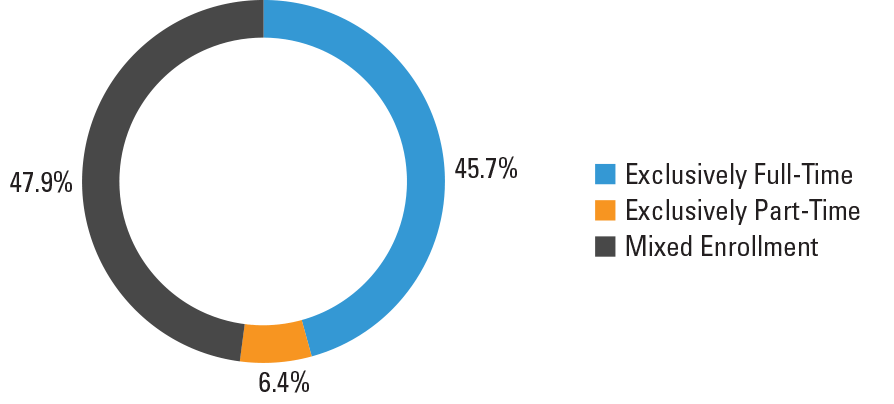
*This figure is based on data shown in Appendix C, Table 2.
Figure 3 depicts students’ enrollment intensity and reveals that 45.7 percent of students in the 2011 cohort were enrolled exclusively full-time during the study period, while 6.4 were enrolled exclusively part-time. “Exclusively” means during all regular terms, excluding summers, in which the student was enrolled, and hence does not exclude stop-outs. In addition, almost one-half of the cohort (47.9 percent) were mixed enrollment students; that is, students enrolled full-time for some terms and part-time for other terms during the study period (see Appendix A for further detail).
Note that this is a considerable variation to the definition of enrollment status than the one commonly used in graduation rate studies based on IPEDS data. IPEDS cohorts are based on student enrollment status in the first fall term only. Instead, this definition takes into account enrollment status of students over time and across institutions, allowing for a more nuanced classification.
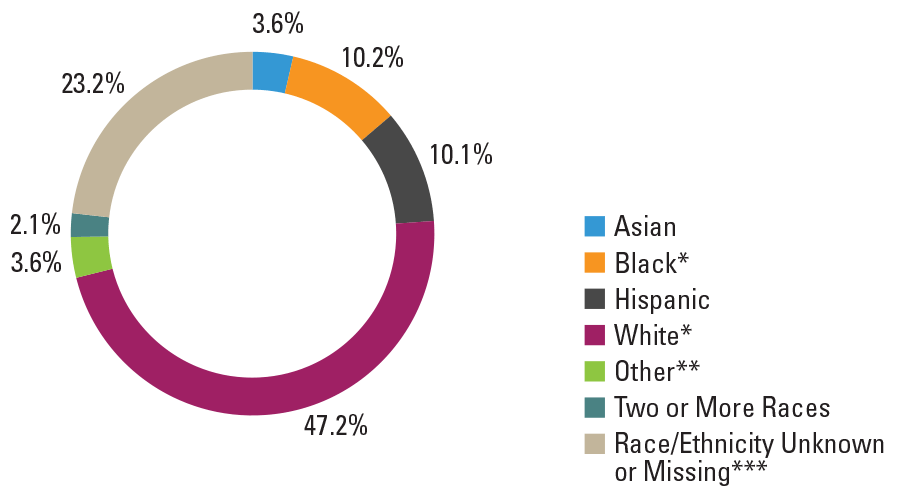
Figure 4. Fall 2011 Cohort by Race and Ethnicity (N=2,270,070)*
* This figure is based on data shown in Appendix C, Table 3.
**Excludes Hispanic origin.
*** The other category includes non-resident alien, American Indian/Alaskan native, Pacific Islander, native Hawaiian or other Pacific Islander.
**** 5.08 percent (n=115,386) with an actual “unknown” race/ethnicity value and 18.12 percent (n=411,334) with a missing race/ethnicity value.
Figure 4 shows the study cohort by race and ethnicity. The highest proportion of students were white students (47.2 percent), followed by black (10.2 percent), Hispanic (10.1 percent), and Asian (3.6 percent) students.
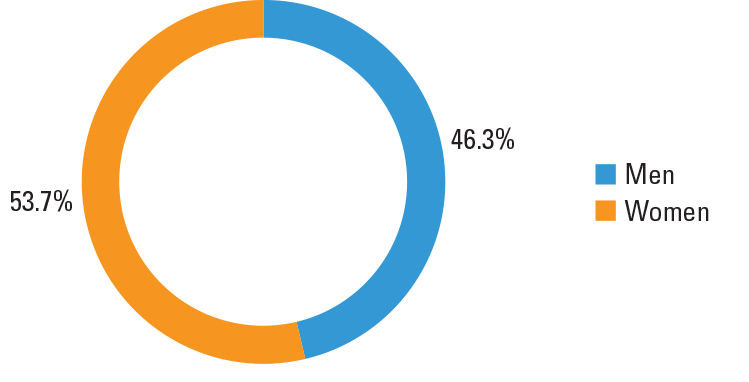
Figure 5. Fall 2011 Cohort by Gender (N=2,135,318)*
*This figure is based on data shown in Appendix C, Table 6.
Figure 5 presents the proportion of men and women in the 2011 cohort. Consistent with previous Signature Reports and national figures on postsecondary education attendance, women accounted for more than one-half of the cohort (53.7 percent).
Figure 6. Fall 2011 Cohort by Race and Ethnicity and Gender (N=1,551,392)*
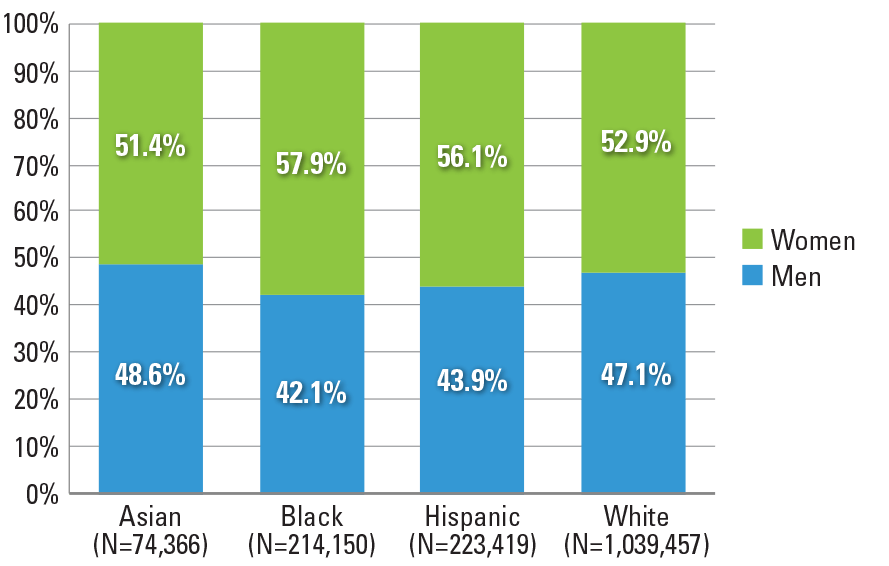
*This figure is based on data shown in Appendix C, Table 7.
Figure 6 displays the distribution of the study cohort by gender, and race and ethnicity categories. Women enrolled at a higher proportion than men regardless of race and ethnicity.
Results
Overall Six-Year Outcomes
The results describe six-year outcomes of degree-seeking students who first entered college in the fall of 2011. Each student’s first degree or certificate earned was examined, offering a national picture of college completion while taking a closer look at college outcomes disaggregated by starting institution type, enrollment intensity, race and ethnicity, gender, and age.
Overall, almost one-half (45.4 percent) of the cohort completed a credential at their starting institution and an additional 11.5 percent completed at a different institution, bringing the national total completion rate to 56.9 percent. This figure includes all students in the cohort, regardless of the starting institution type. Disaggregating by the level of institution, two in three students (66.7 percent) who started at four-year institutions and nearly two in five (37.7 percent) at two-year institutions, completed college before the end of the six-year study period. Meanwhile, the stop-out, or no longer enrolled rate, at two-year institutions was twice that of four-year institutions (47.1 percent and 23.3 percent, respectively) (Figure 7). These are students who had earned no degree or certificate, and had no enrollment activity during the final year of the study period.
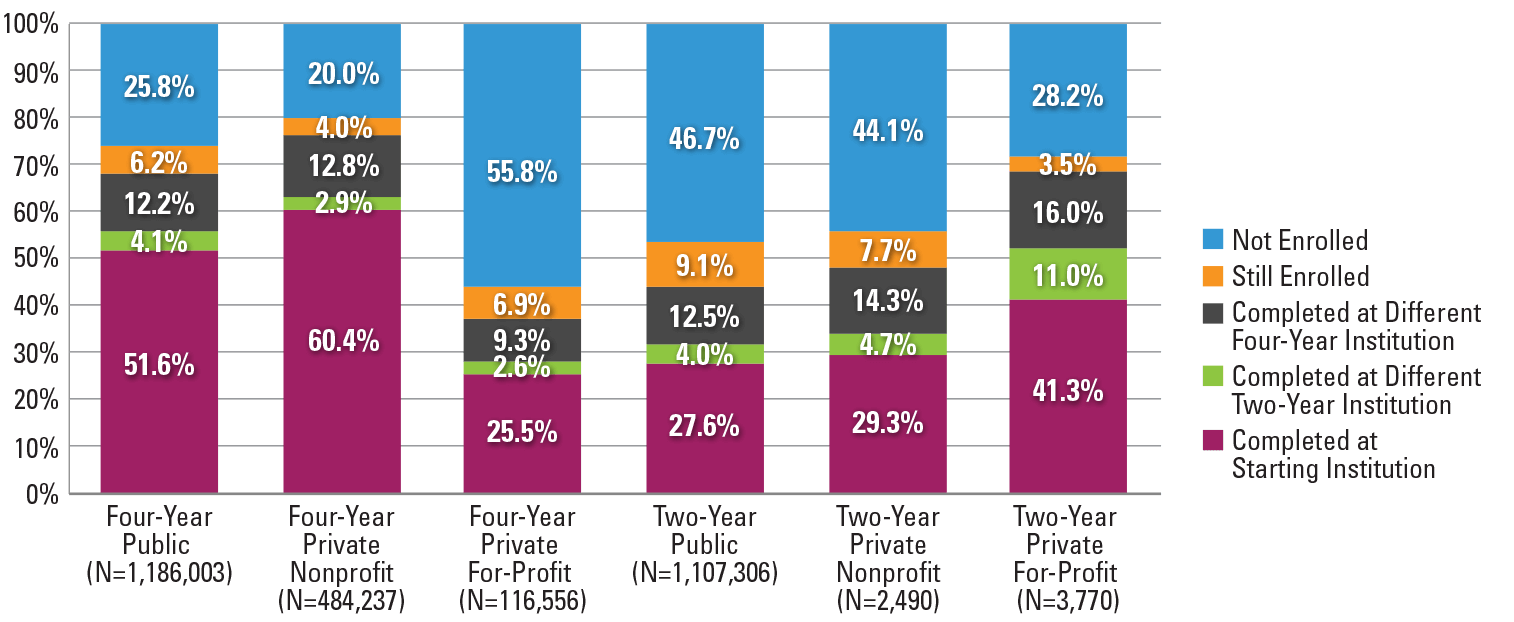
Among the four largest categories of institutions (four-year public, four-year private nonprofit, two-year public and four-year private for-profit), students who started at four-year private nonprofit institutions had the highest completion rates (76.0 percent), followed by students at four-year public (64.7 percent), two-year public (37.5 percent) and four-year private for-profit (35.3 percent) institutions (Figure 8). Stop-out rates were the highest (54.1 percent) at four-year private for-profit institutions, followed by two-year public institutions (47.3 percent) (Figure 8). In addition, among those who completed, a higher proportion of students who started at a four-year private for-profit institution had completed their credential at a different institution (37.4 percent) than the one where they started. The proportion of students who completed at a different institution was similar for students who started at a four-year public and a four-year private nonprofit institution (17.3 percent and 16.2 percent, respectively) (Figure 9).
Among students who maintained full-time status throughout their enrollment pathways, four in five (80.1 percent) had completed a degree or certificate by the end of the study period. The highest proportion of students who were still enrolled at the end of the study period (21.3 percent) was observed among those in the mixed enrollment category. Exclusively part-time students displayed the highest stop-out rate (70.7 percent) compared to full-time or mixed enrollment students (Figure 10). Mixed enrollment students also had the highest proportion (33.2 percent) of completers who graduated at a different institution, in comparison to students with other enrollment intensities (Figure 11).
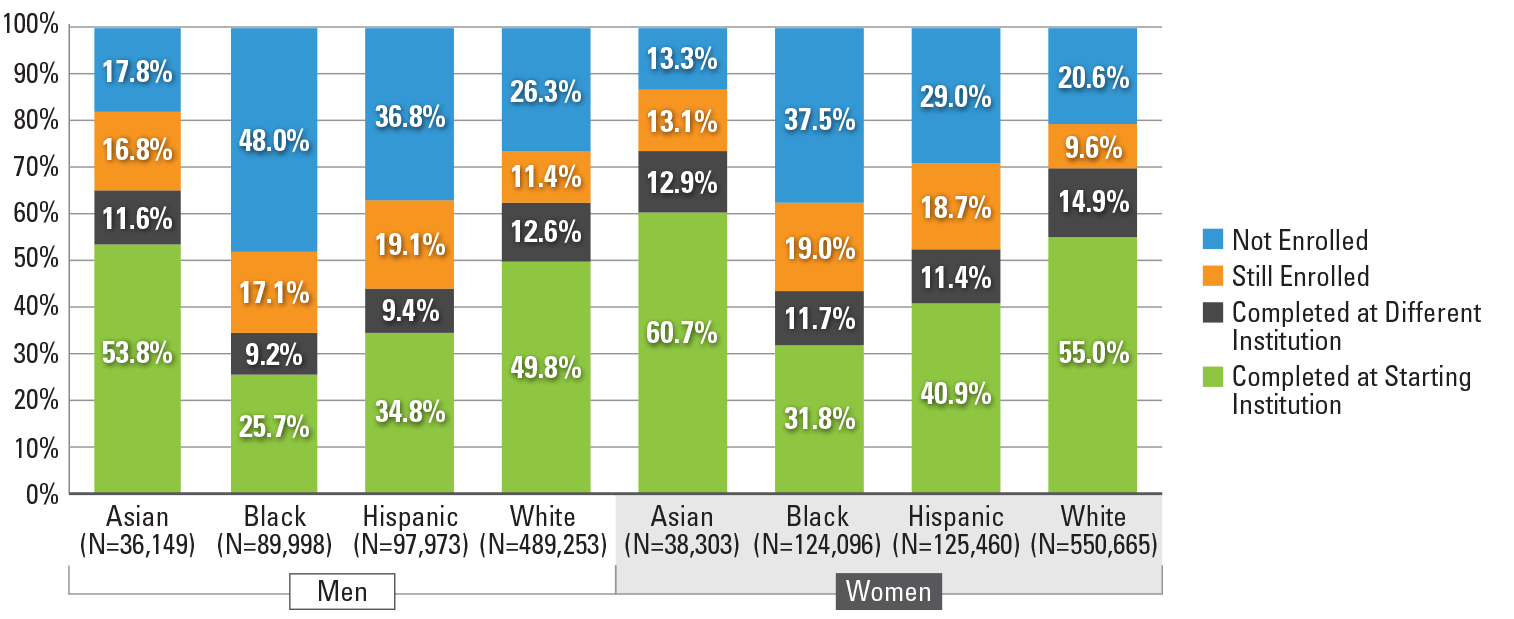
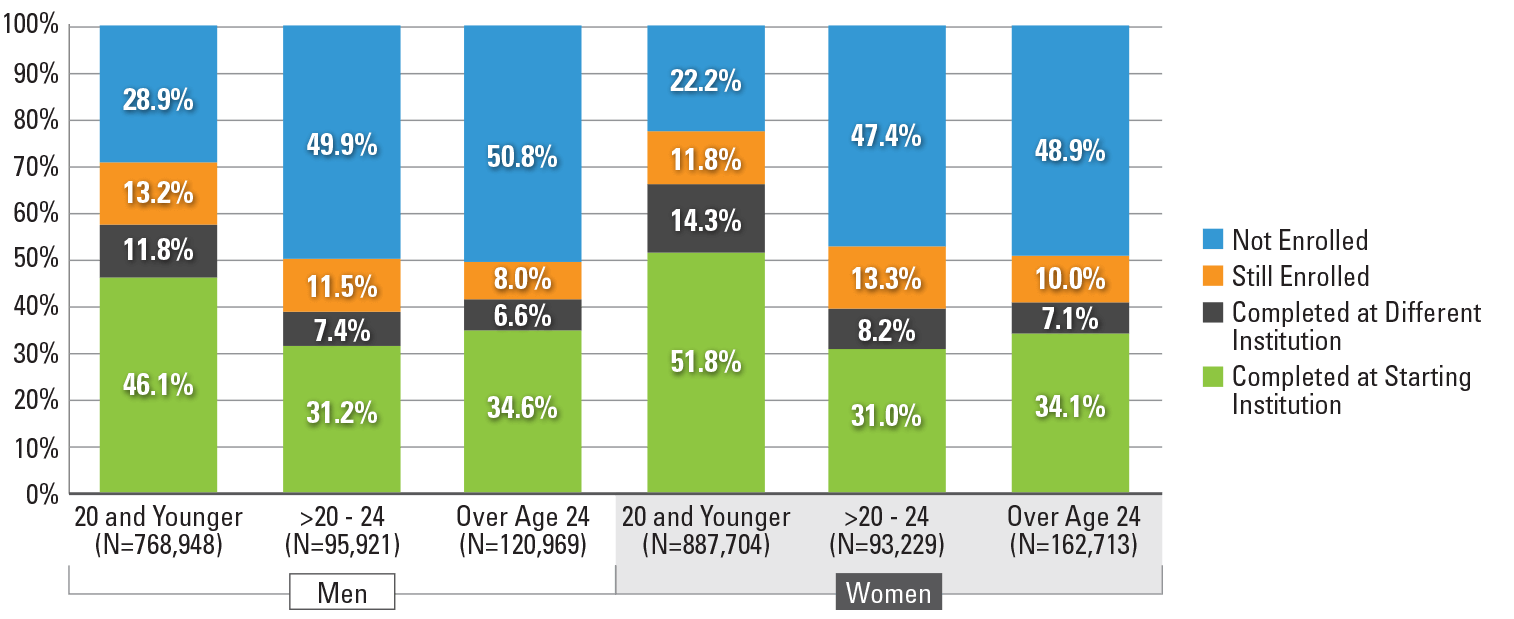
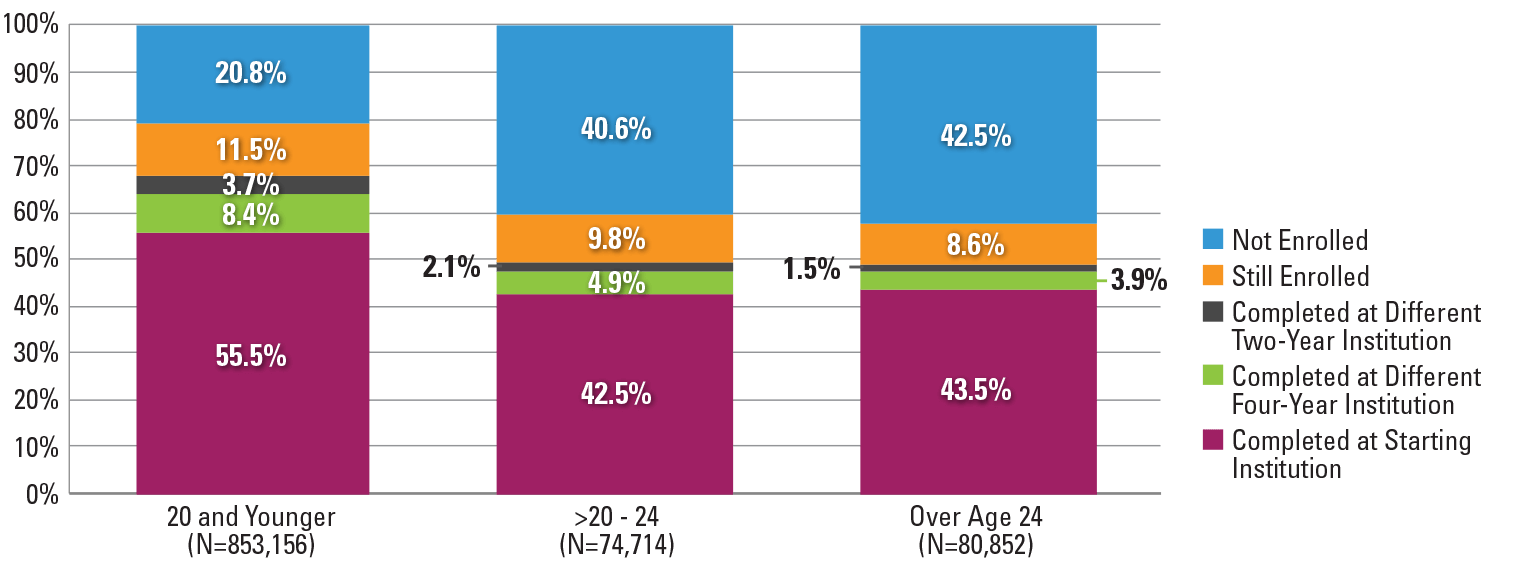
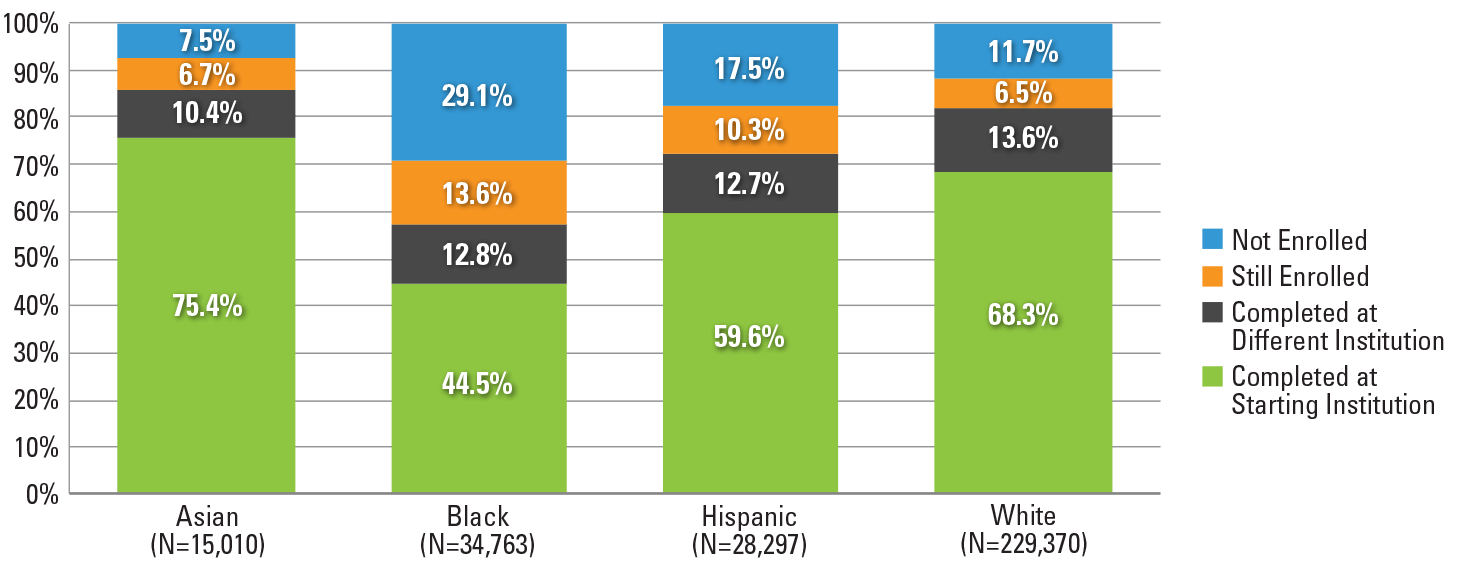
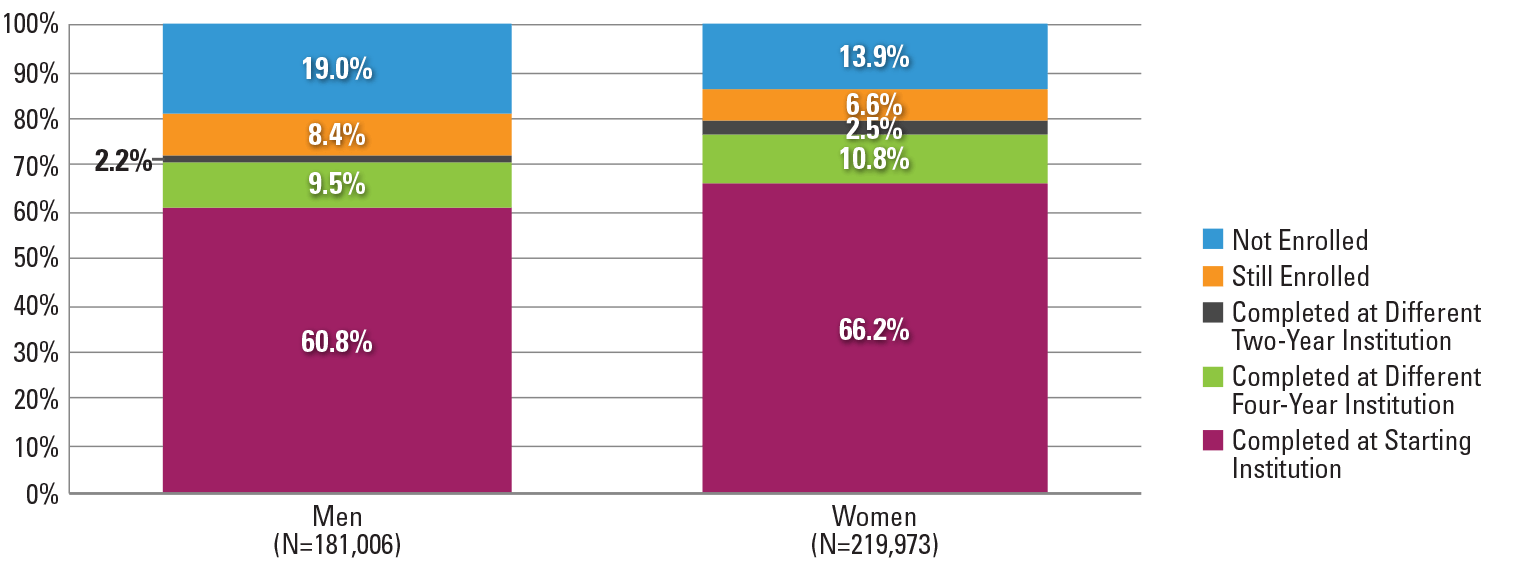
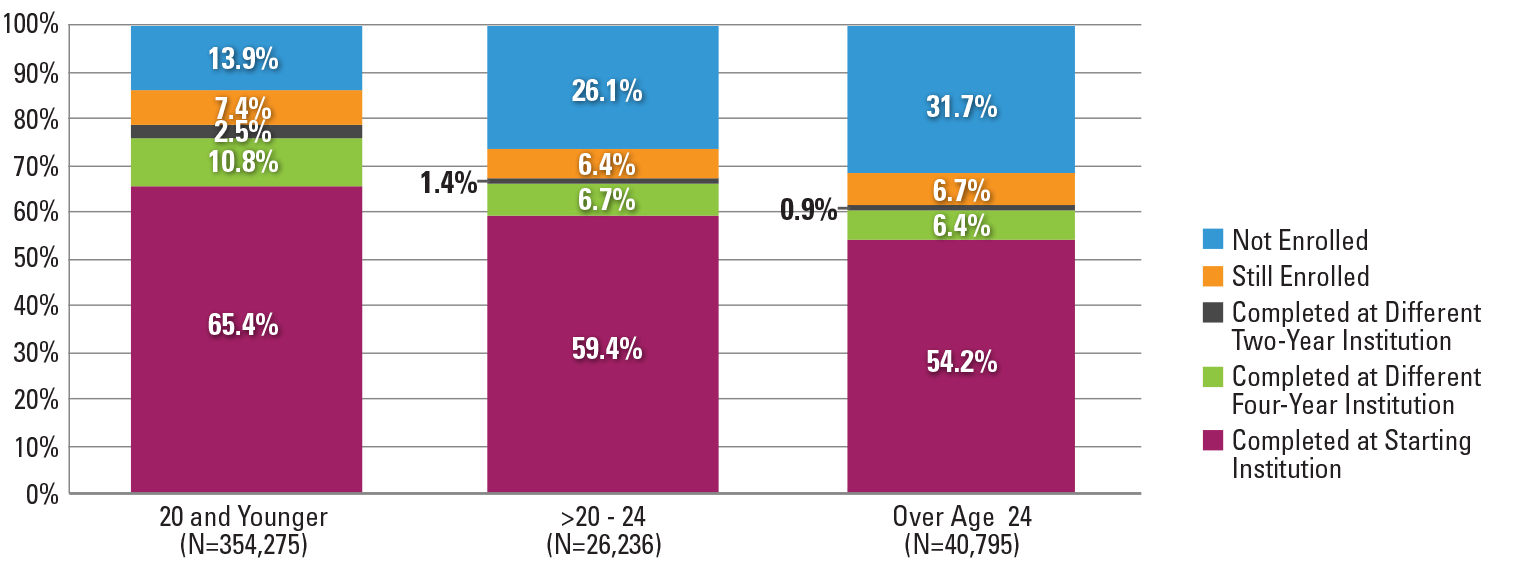
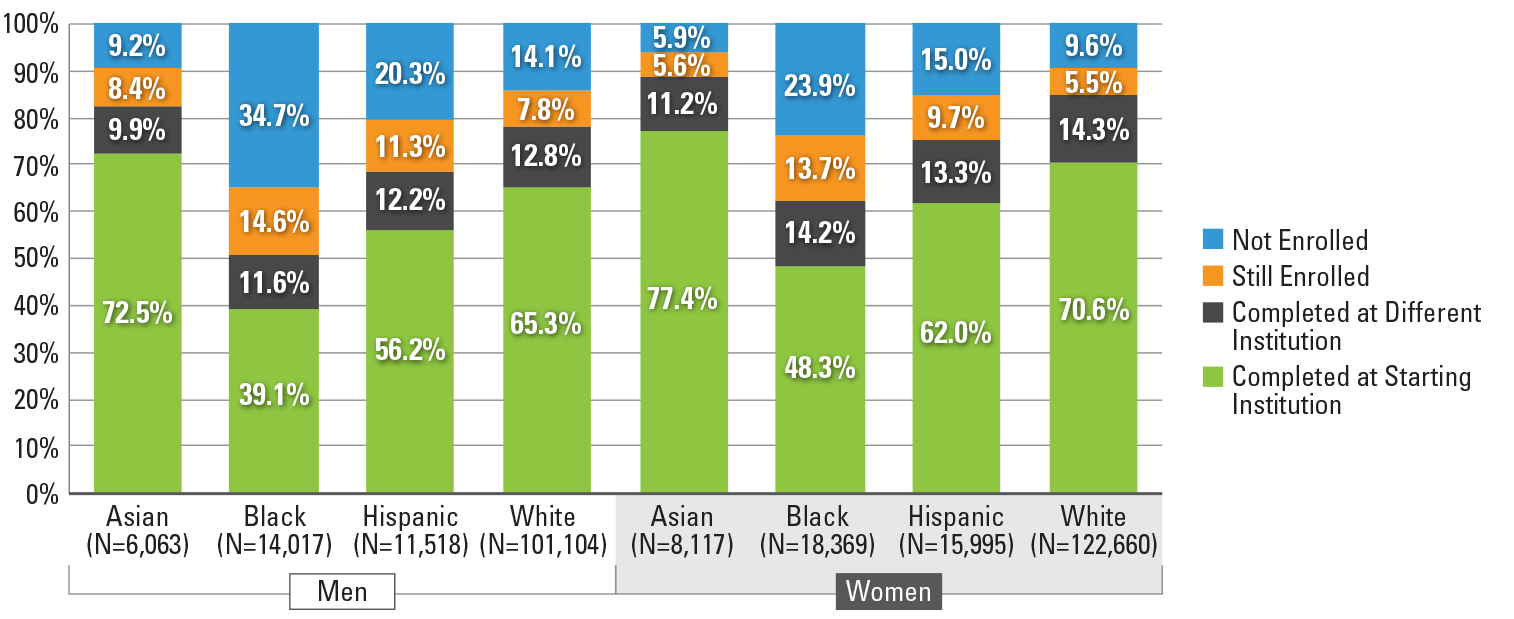
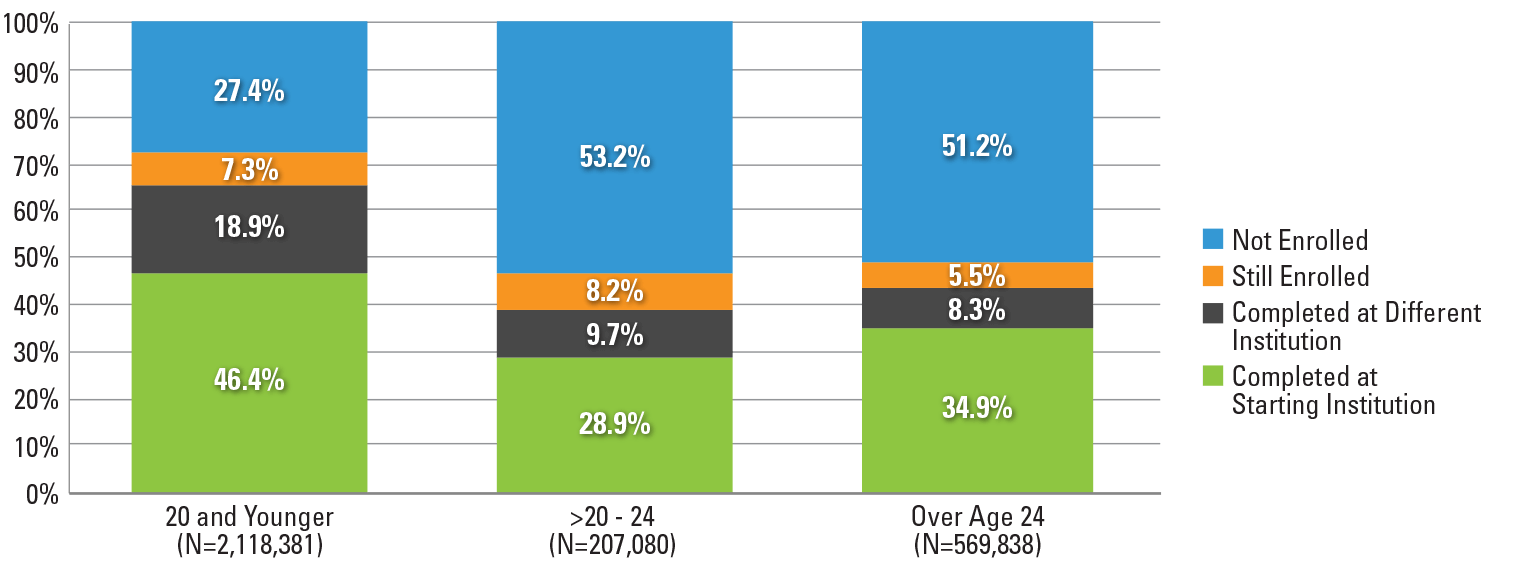
When six-year outcomes were disaggregated by race and ethnicity, our findings show that Asian students showed the highest completion rate at 68.9 percent, followed by white students at 66.1 percent. Asian students were also more likely to complete a credential at the starting institution (57.0 percent) as compared to white students (52.5 percent). Black and Hispanic students had much lower completion rates (29.2 and 38.2 percent, respectively) (Figure12). Women had higher completion rates (60.2 percent) than men (53.9 percent), and this is true regardless of race and ethnicity (Figures 13 and 16) and age at first entry (Figure 17). In terms of age, traditional-age students (20 or younger) displayed the highest completion rates (61.7 percent), while about one-half of delayed entry students (over age 20 through 24) and adult learners (over 24) were no longer enrolled in college at the end of the study period, irrespective of gender differences (Figures 14 and 17). Black students had the highest stop-out rates, regardless of gender and age (Figures 16 and 18).
Figure 7. Six-Year Outcomes for All Students, Students Who Started at Four-Year Institutions,
and Students who Started at Two-Year Institutions (N=2,264,948)*
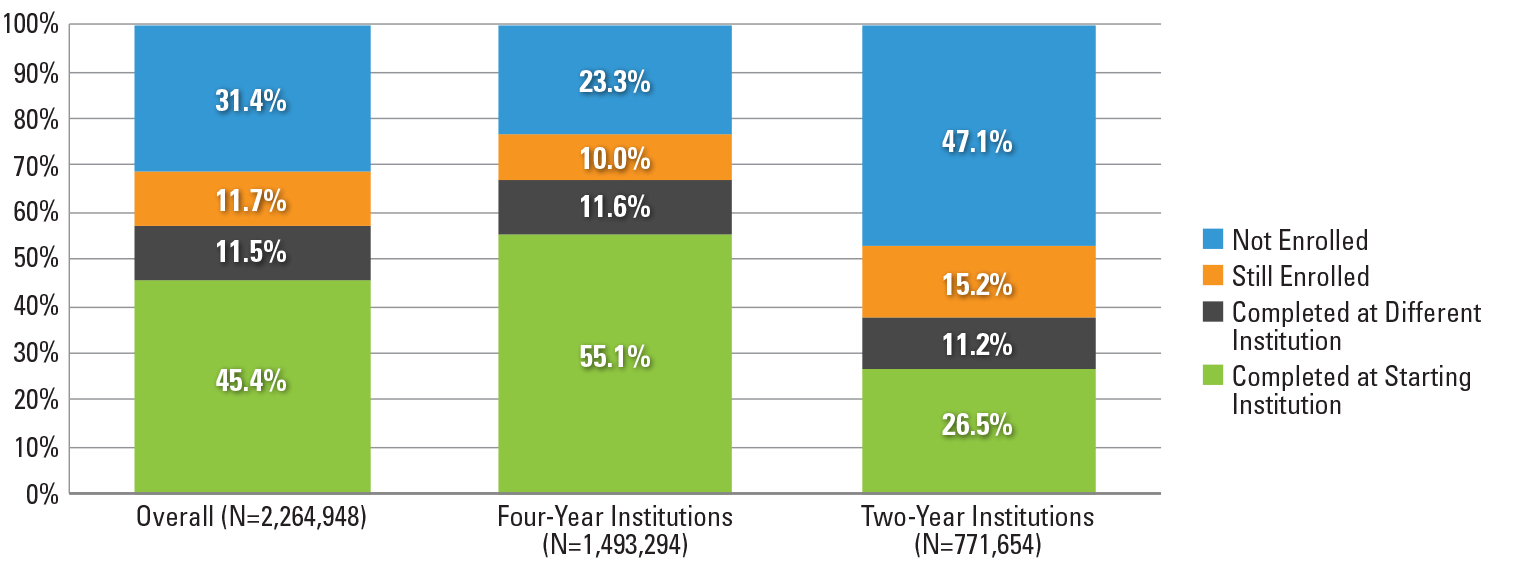
*This figure is based on data shown in Appendix C, Table 15.
Figure 8. Six-Year Outcomes by Starting Institution Type (N=2,259,591)*
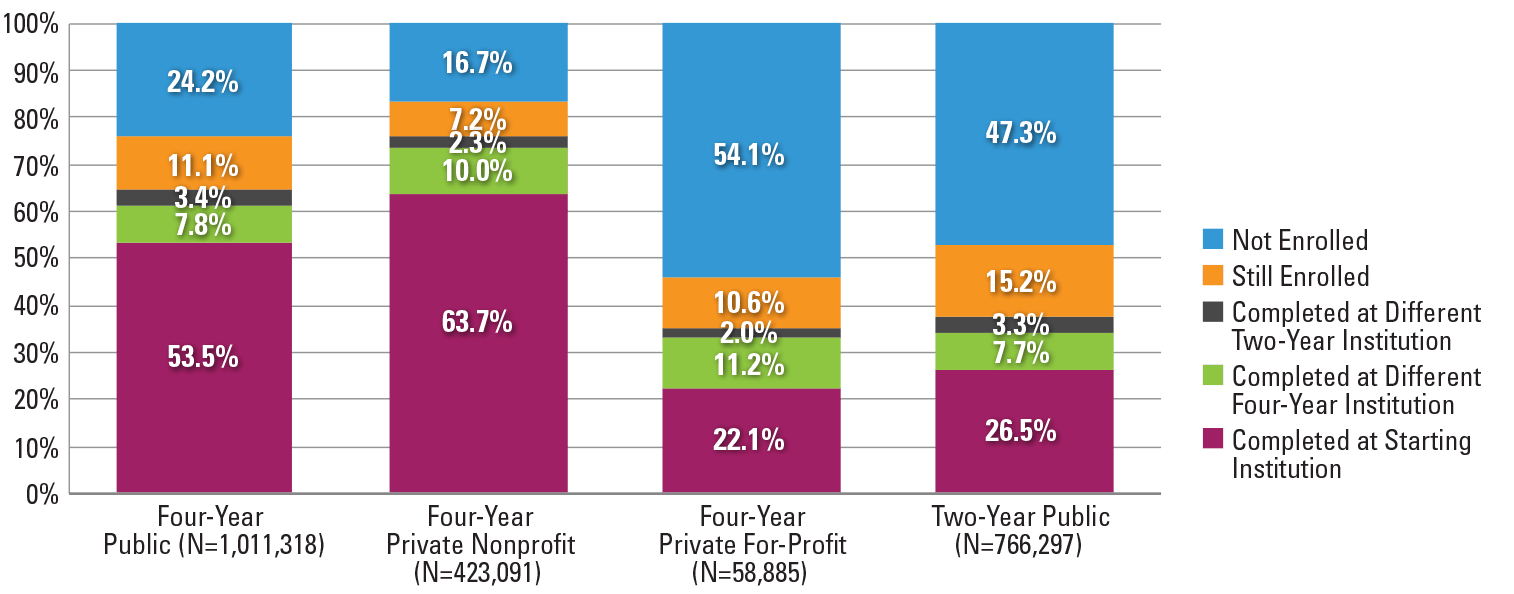
*This figure is based on data shown in Appendix C, Table 15.
Figure 9. Completion at Starting vs. Different Institution by Starting Institution Type (N=1,284,494)*
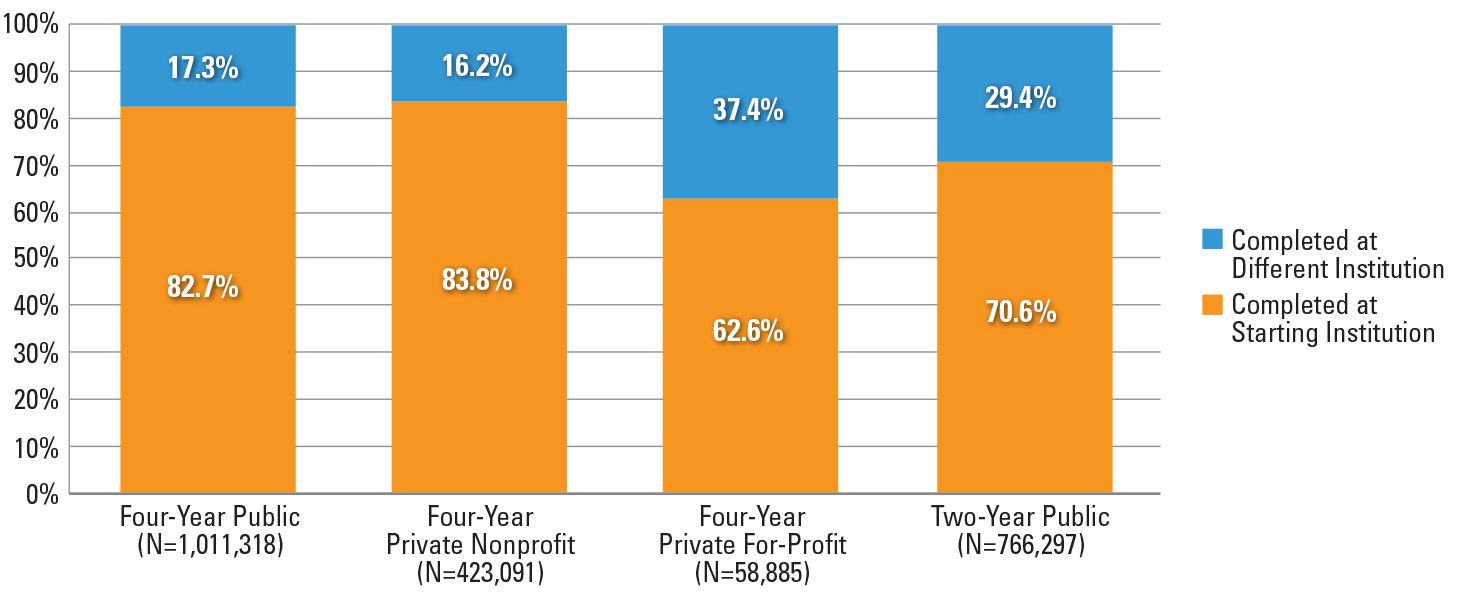
*This figure is based on data shown in Appendix C, Table 15.
Figure 10. Six-Year Outcomes by Enrollment Intensity (N=2,264,491)*
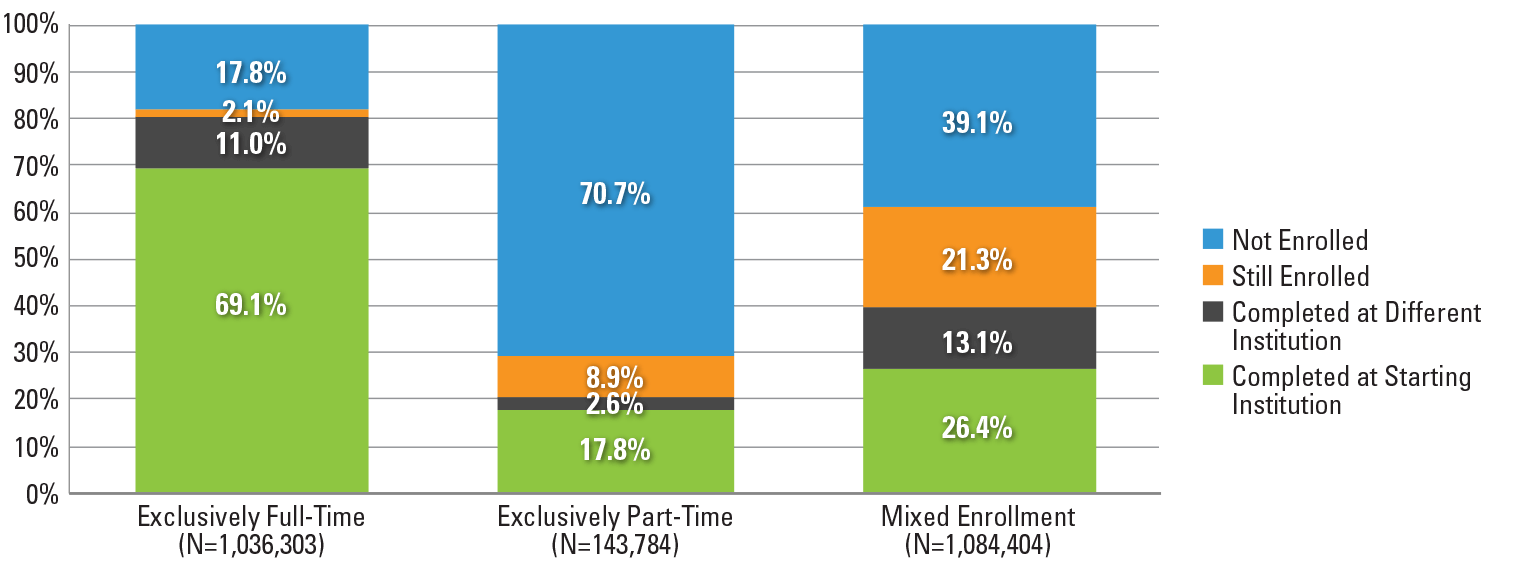
*This figure is based on data shown in Appendix C, Table 16.
Figure 11. Completion at Starting vs. Different Institution by Enrollment Intensity (N=1,287,748)*
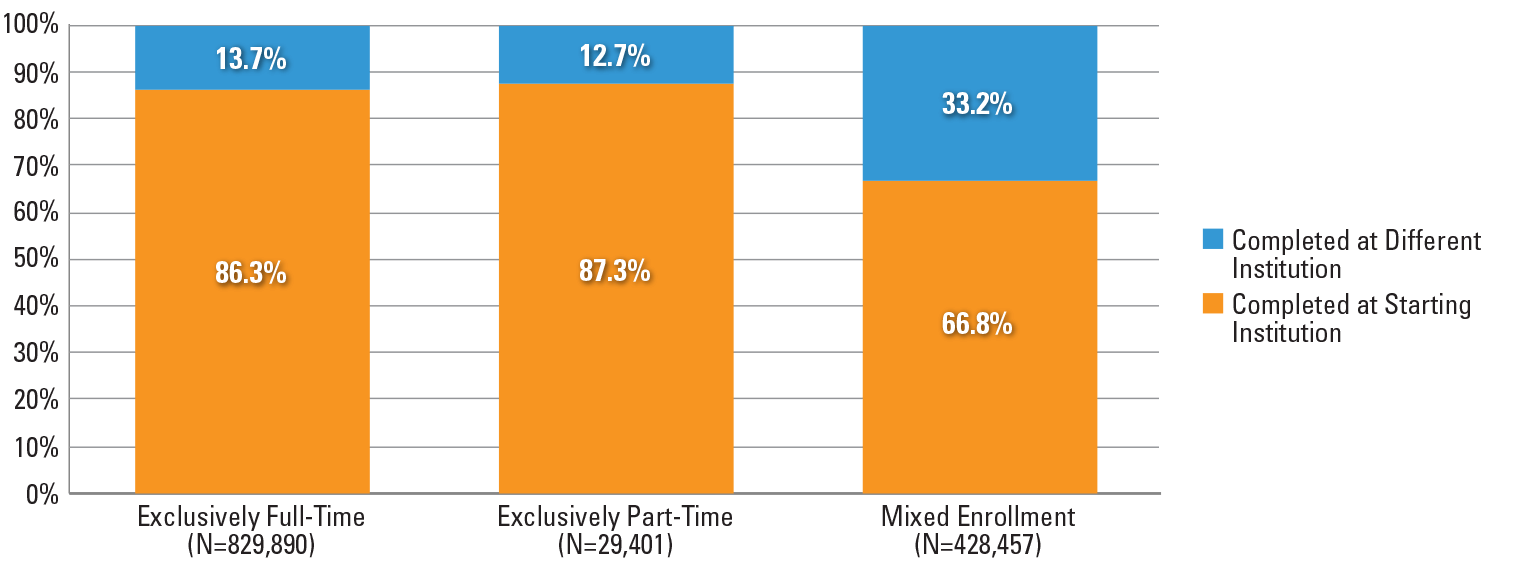
*This figure is based on data shown in Appendix C, Table 16.
Figure 12. Six-Year Outcomes by Race and Ethnicity (N=1,614,110)*
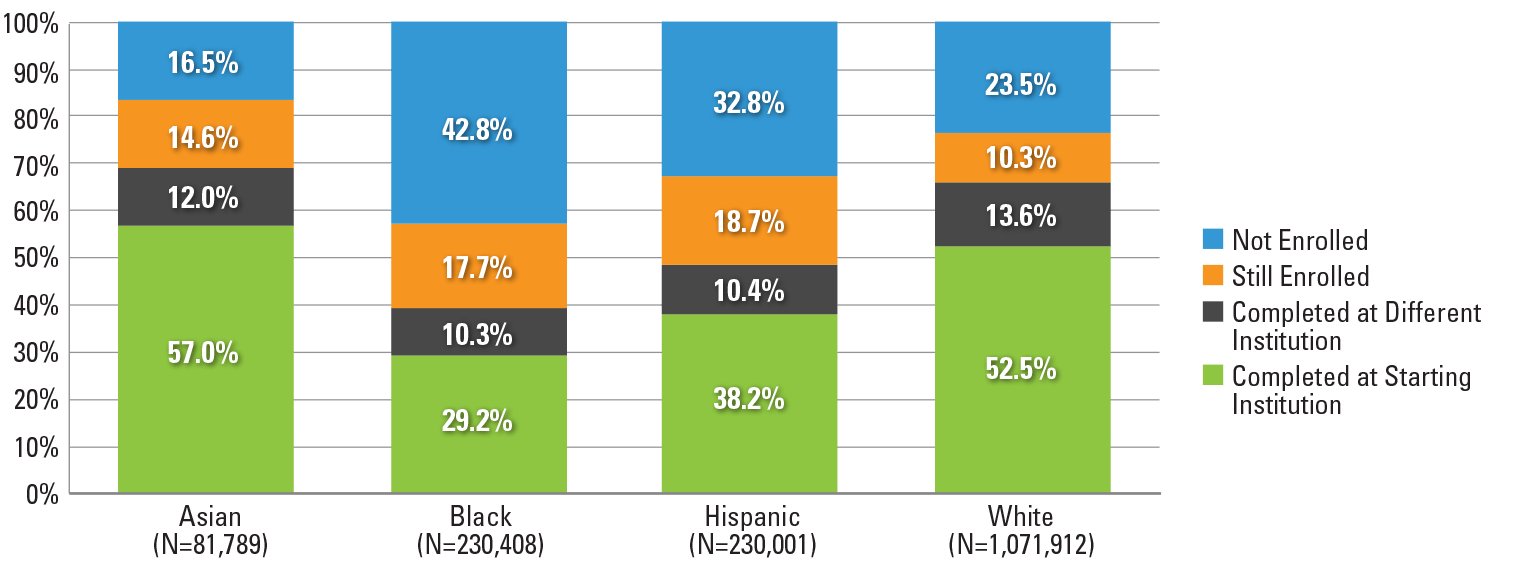
*This figure is based on data shown in Appendix C, Table 17.
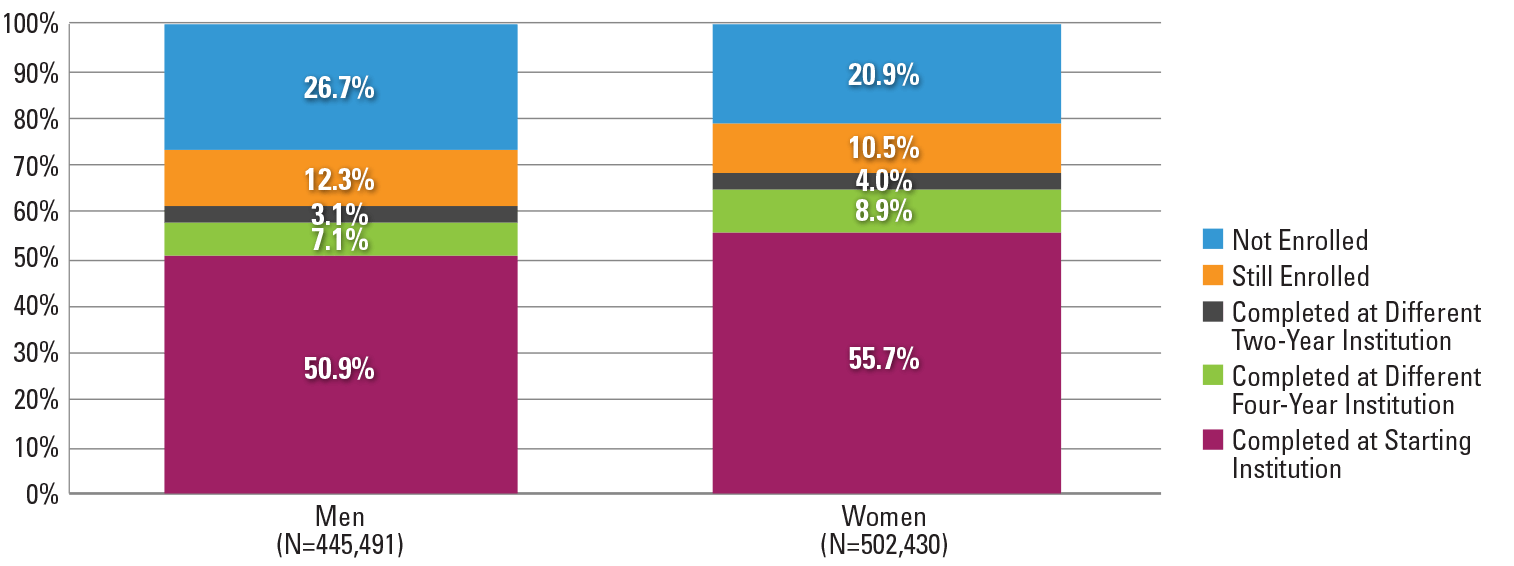
Figure 13. Six-Year Outcomes by Gender (N=2,130,663)*
Note: Students with gender data missing were excluded from the above figure.
*This figure is based on data shown in Appendix C, Table 18.
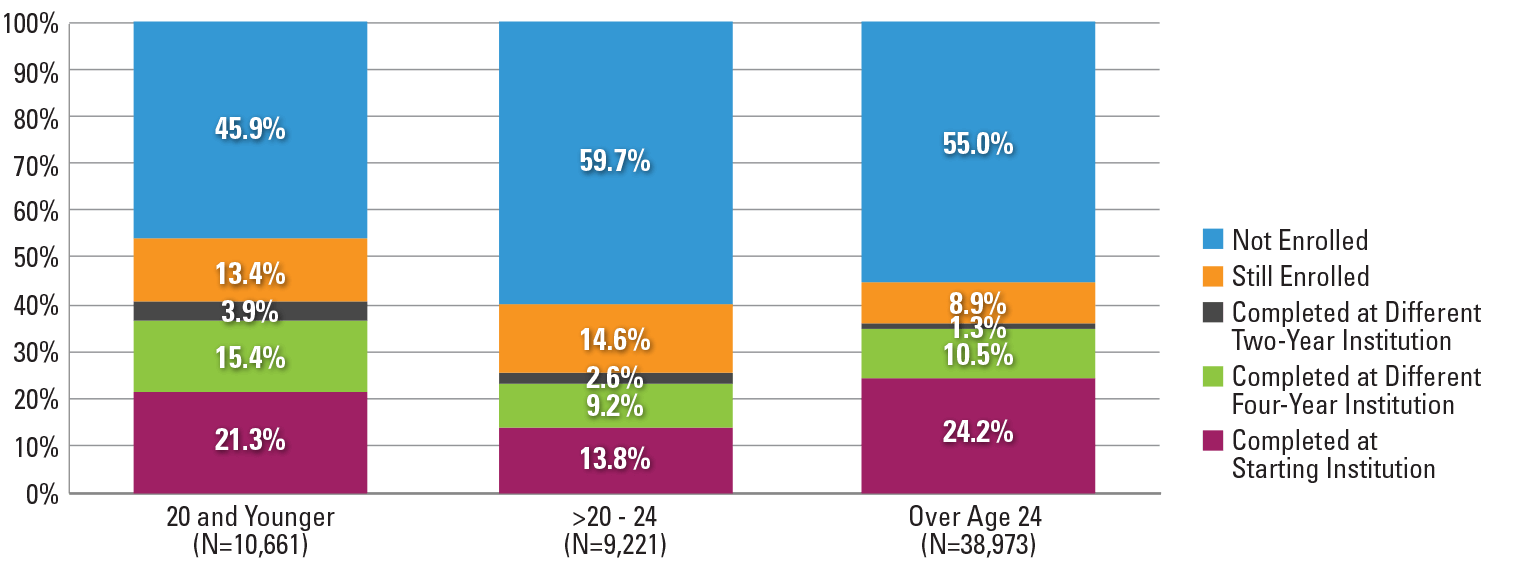
Figure 14. Six-Year Outcomes by Age at First Entry (N=2,259,376)*
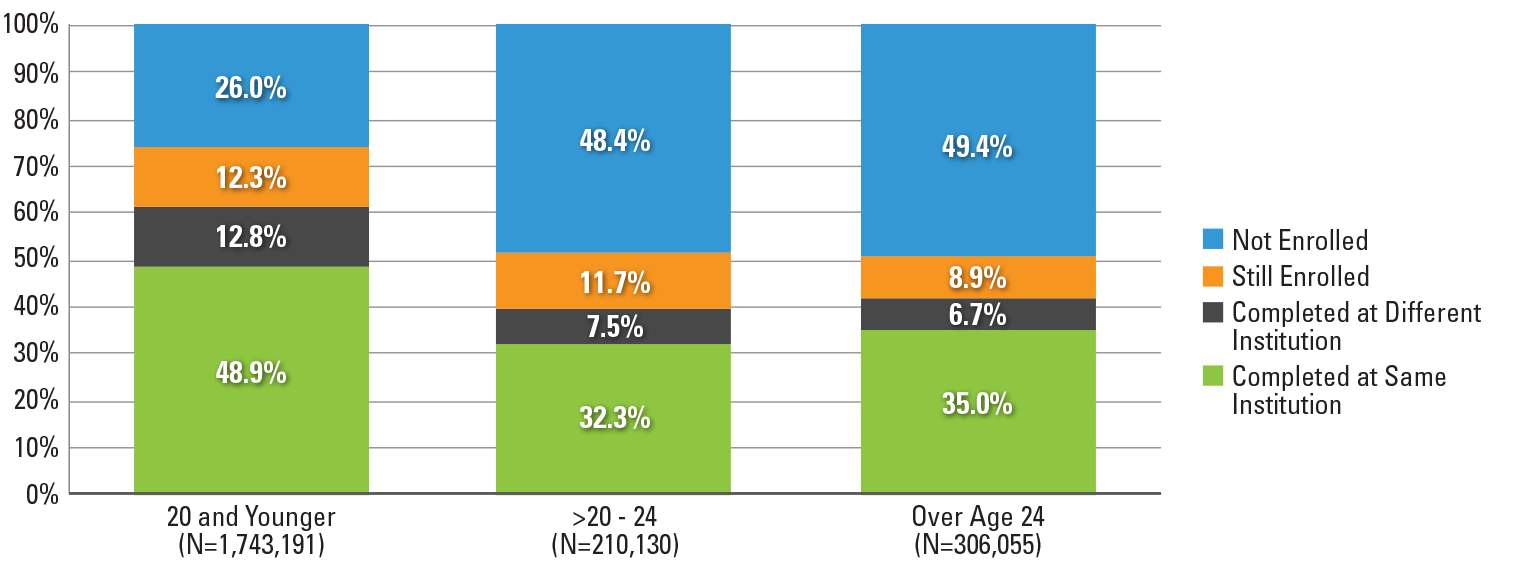
Note: Students with date of birth date data missing were excluded from the above figure.
*This figure is based on data shown in Appendix C, Table 19.
Figure 15. Completion at Starting vs. Different Institution by Age at First Entry (N=1,287,297)*
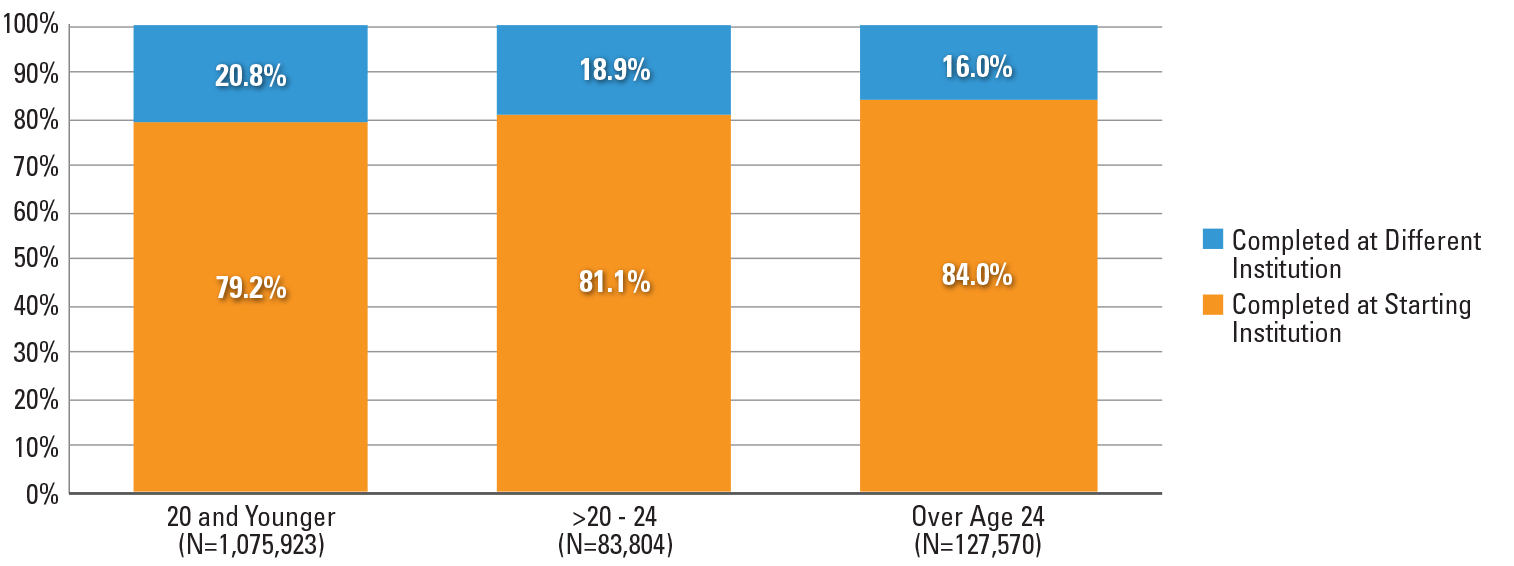
Note: Students with date of birth data missing were excluded from the above figure.
*This figure is based on data shown in Appendix C, Table 19.
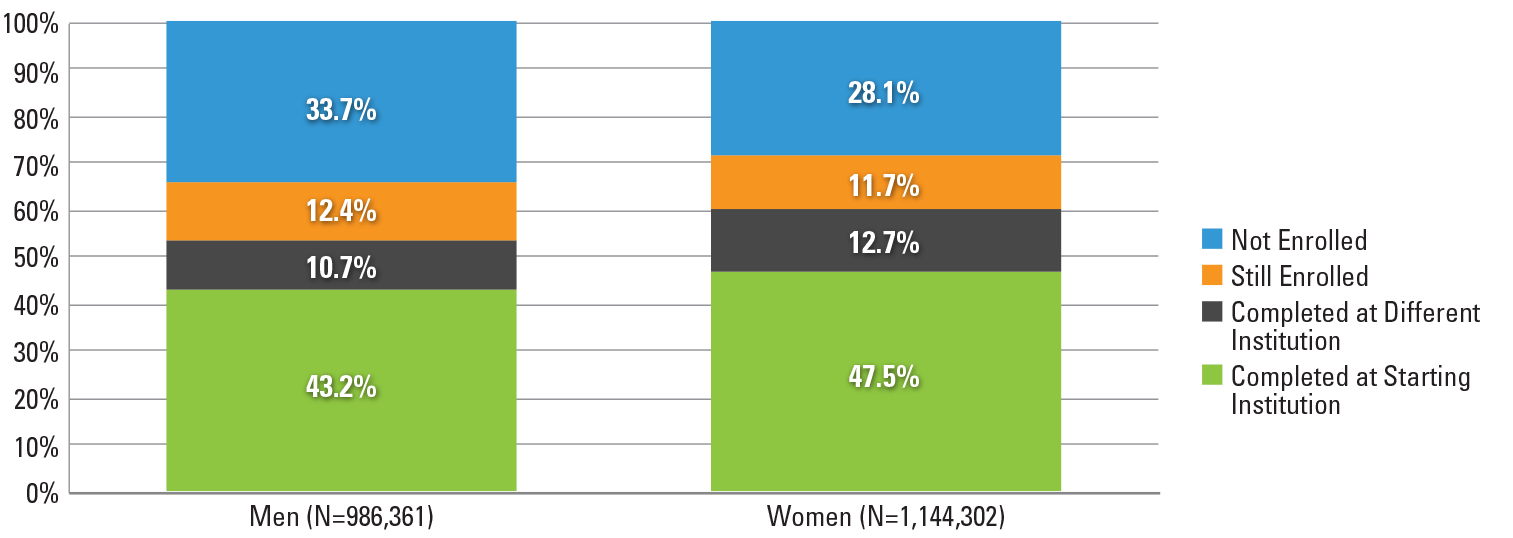
Figure 16. Six-Year Outcomes by Race and Ethnicity and Gender (N=1,551,897)*
Note: Students with missing gender data were excluded from the above figure.
*This figure is based on data shown in Appendix C, Table 20.
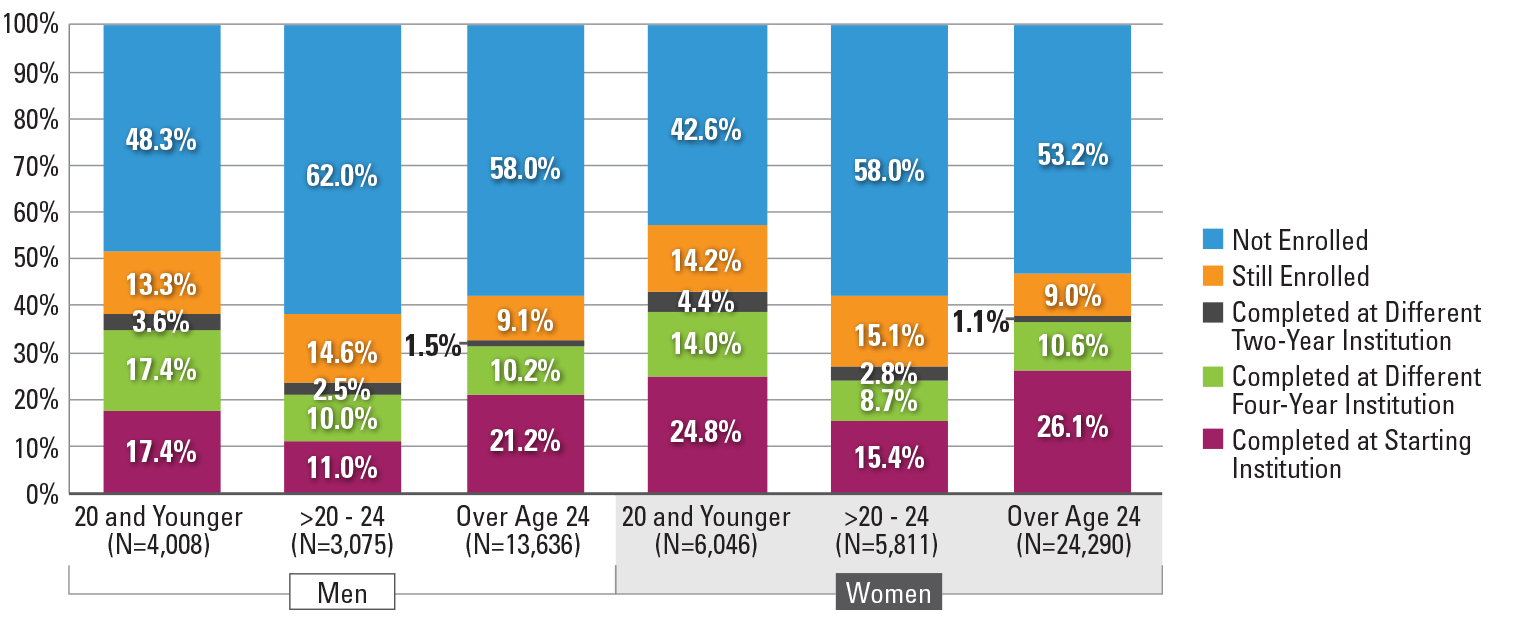
Figure 17. Six-Year Outcomes by Age at First Entry and Gender (N=2,129,484)*
Note: Students with missing birth date or gender data were excluded from the above figure.
*This figure is based on data shown in Appendix C, Table 21.
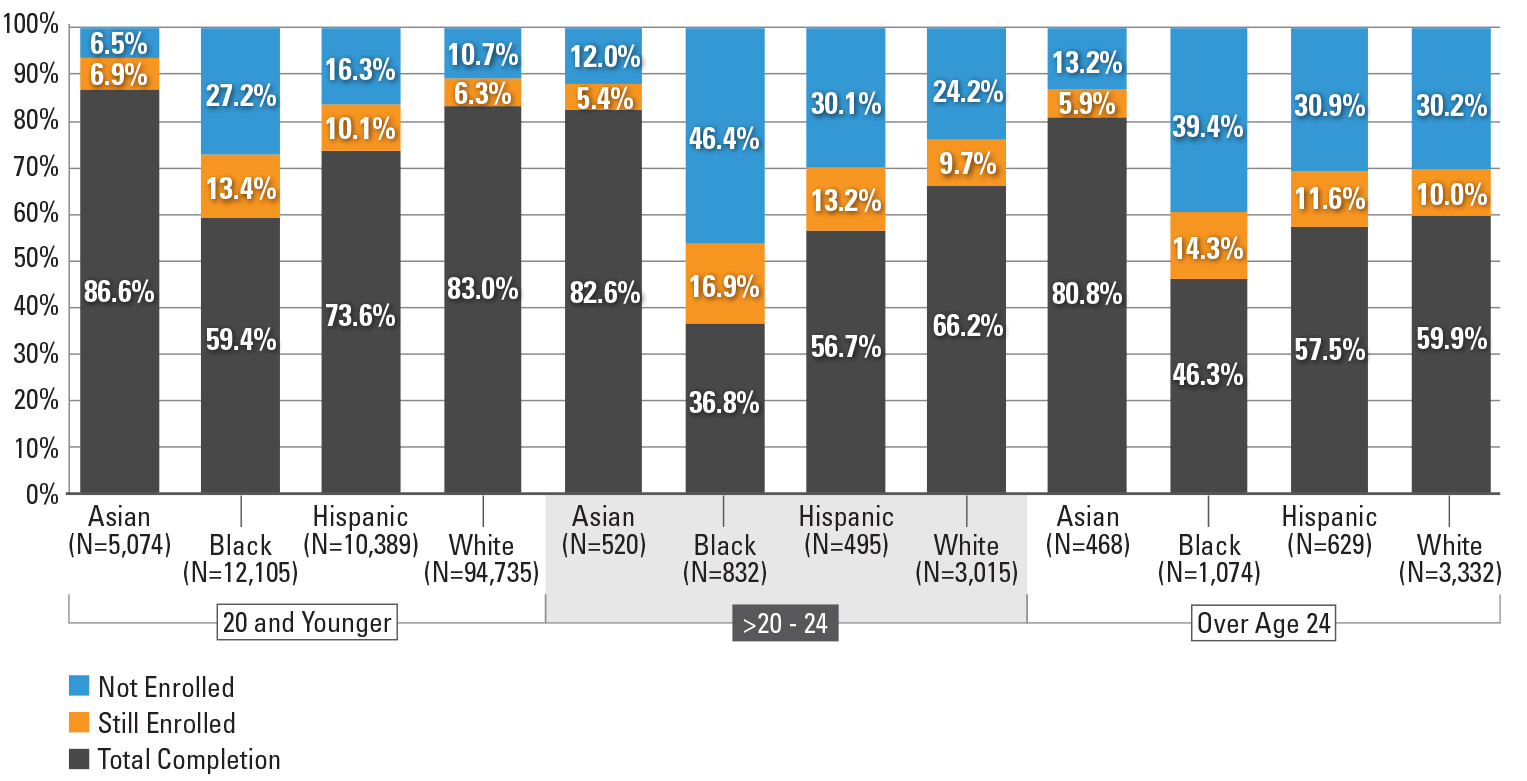
Figure 18. Six-Year Outcomes by Race and Ethnicity and Age at First Entry (N=1,613,734)*
Note: Students with missing birth date data were excluded from the above figure.
*This figure is based on data shown in Appendix C, Table 22.
Figures 19 through 26 present the six-year outcomes of students who started at four-year public institutions.
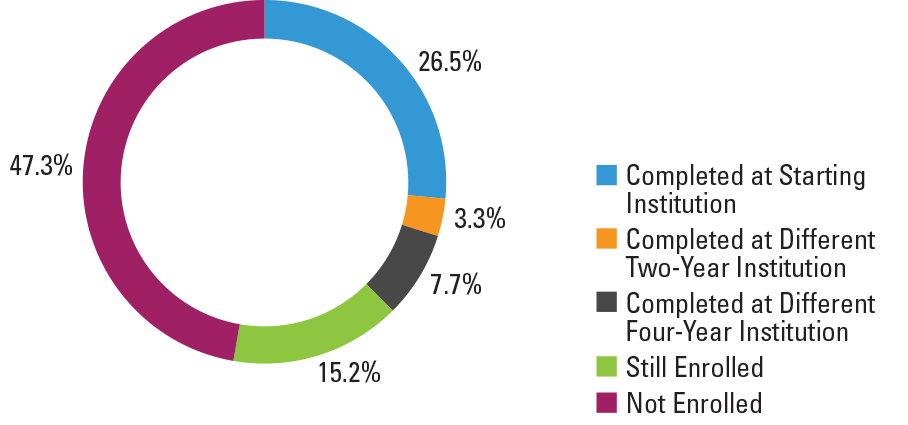
The total completion rate for all students who started at a four-year public institution, regardless of whether at the starting institution or elsewhere, was 64.7 percent, with 53.5 percent completing at their starting institution and an additional 11.2 percent at a different institution (Figure 19).
Figure 19. Six-Year Outcomes for Students Who Started at Four-Year Public Institutions (N=1,011,318)*
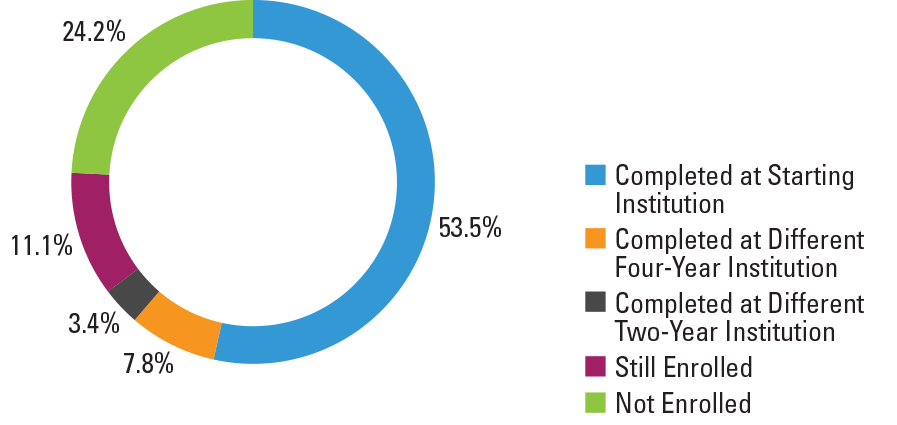
*This figure is based on data shown in Appendix C, Table 27.
*The total completion rate for students who started at four-year public institutions is 64.7%.
The highest proportion of students who stopped out appeared among exclusively part-time students: three-fourths of this group of students were no longer enrolled in college at the end of the study period. Exclusively full-time students had the highest completion rates, and mixed enrollment students had the highest still enrolled rates at the end of the study period (Figure 20).
When disaggregated by race and ethnicity, Asian students had the highest completion rate (75.8 percent), followed by white students (71.1 percent), Hispanic students (55.7 percent), and black students (46 percent). Black students had the highest stop-out rate (36.5 percent). However, they also had the highest proportion still enrolled at the end of the study period (17.5 percent) (Figure 21). This pattern is consistent when race and ethnicity is disaggregated further by gender and age groups (Figures 24 and 26). Black men have the lowest completion rate at 39.6 percent, as well as the highest stop-out rate at 42.8 percent in comparison to other racial/gender groups.
The outcomes for delayed entry and adult learners were similar, with completion rates of 49.6 percent and 48.9 percent, respectively, much lower than traditional-age students’ completion rate of 67.7. (Figure 23). This pattern remained consistent regardless of gender (Figure 25), but distinct patterns emerge when the age groups are further disaggregated by race and ethnicity (Figure 26). First, regardless of ethnicity, traditional-age students had higher completion rates than the other age groups. However, among Asian students the gap in the completion rate between traditional-age and adult learners was very small (75.8 percent and 69.1 percent, respectively). The gap was largest among white students: traditional-age students’ completion rate was 32 percentage points higher than that of the adult learners (73.4 percent and 41.7 percent, respectively).
Figure 20. Six-Year Outcomes for Students Who Started at Four-Year Public Institutions by Enrollment Intensity (N=1,011,317)*
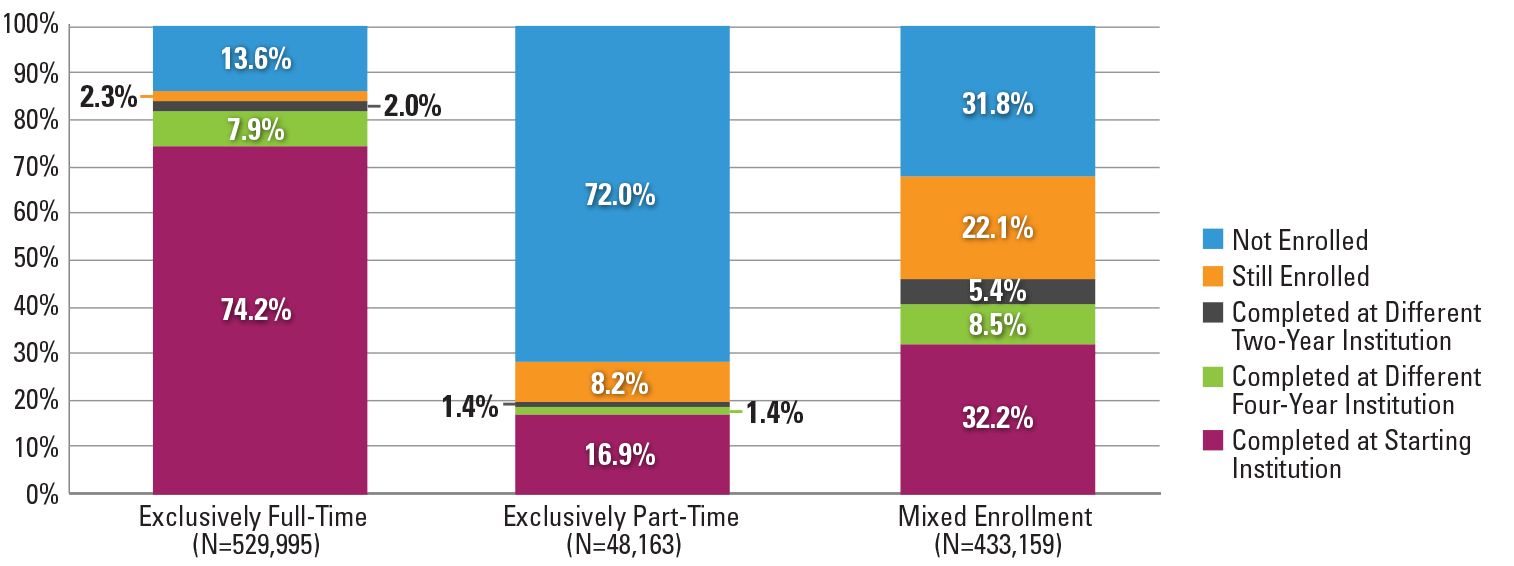
*This figure is based on data shown in Appendix C, Table 28.
Figure 21. Six-Year Outcomes for Students Who Started at Four-Year Public Institutions by Race and Ethnicity (N=762,783)*
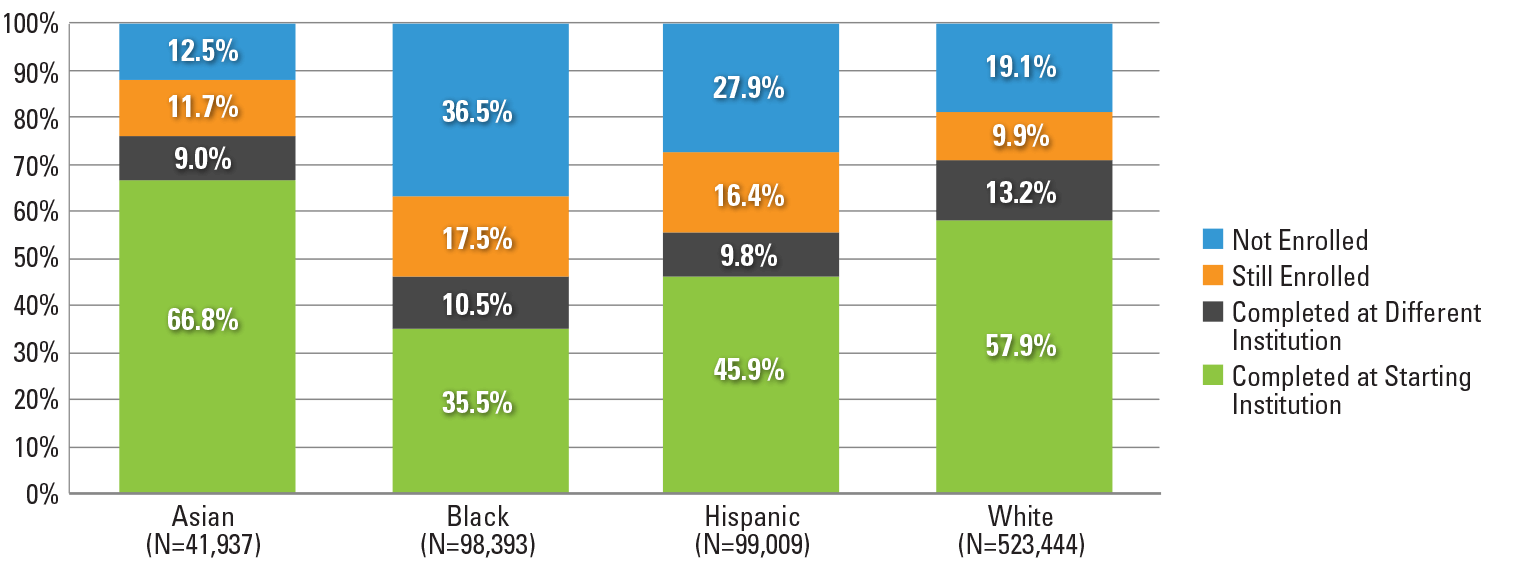
*This figure is based on data shown in Appendix C, Table 29.
Figure 22. Six-Year Outcomes for Students Who Started at Four-Year Public Institutions by Gender (N=947,921)*
Note: Students with missing gender data were excluded from the above figure.
*This figure is based on data shown in Appendix C, Table 30.
Figure 23. Six-Year Outcomes for Students Who Started at Four-Year Public Institutions by Age at First Entry (N=1,008,722)*
Note: Students with missing birth date data were excluded from the above figure.
*This figure is based on data shown in Appendix C, Table 31.
Figure 24. Six-Year Outcomes for Students Who Started at Four-Year Public Institutions by Race and Ethnicity and Gender (N=731,465)*
Note: Students with missing gender data were excluded from the above figure.
*This figure is based on data shown in Appendix C, Table 32.
Figure 25. Six-Year Outcomes for Students Who Started at Four-Year Public Institutions by Gender and Age at First Entry (N=947,747)*
Note: Students with missing birth date or gender data were excluded from the above figure.
*This figure is based on data shown in Appendix C, Table 33.
Figure 26. Six-Year Outcomes for Students Who Started at Four-Year Public Institutions by Race and Ethnicity and Age at First Entry (N=762,719)*
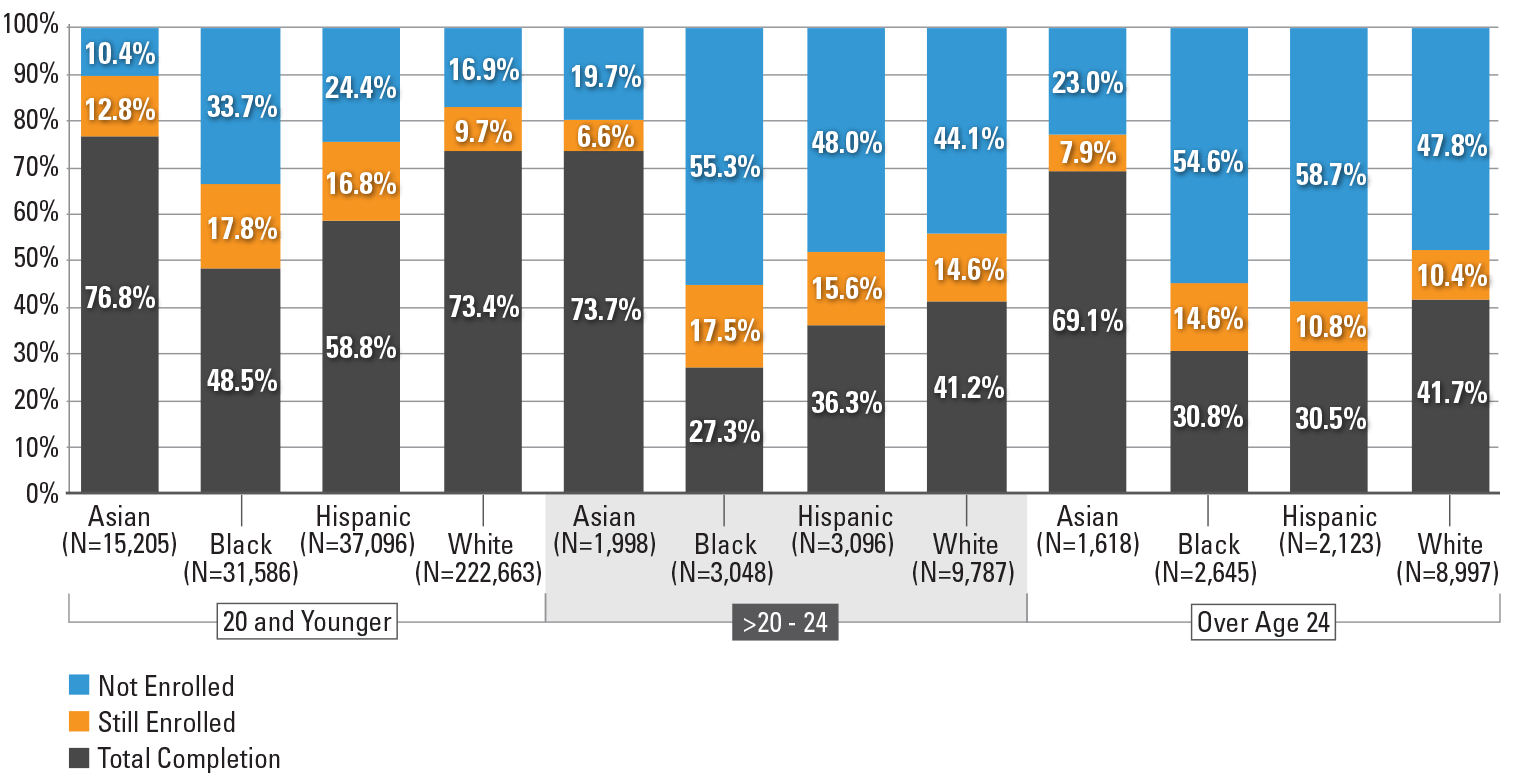
Note: Students with missing birth date data were excluded from the above figure.
*This figure is based on data shown in Appendix C, Table 34.
Students Who Started at Two Year Public Institutions
Figures 27 through 37 show the six-year outcomes for students who started at two year public institutions.
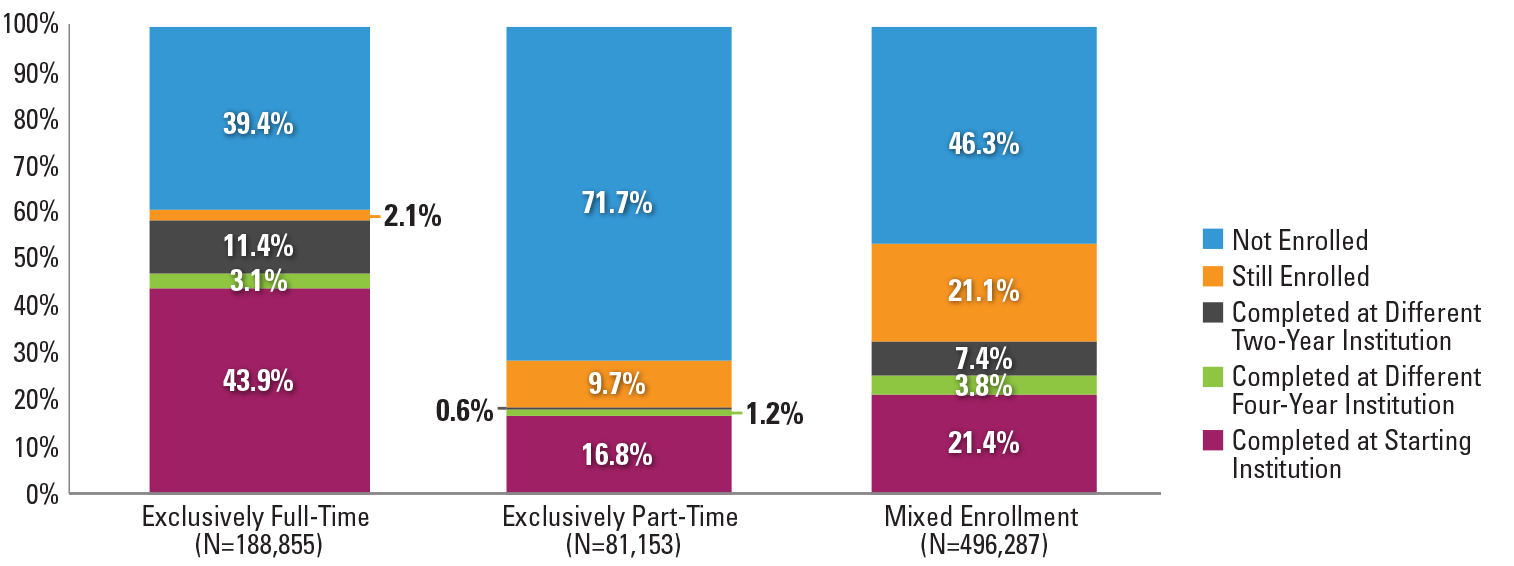
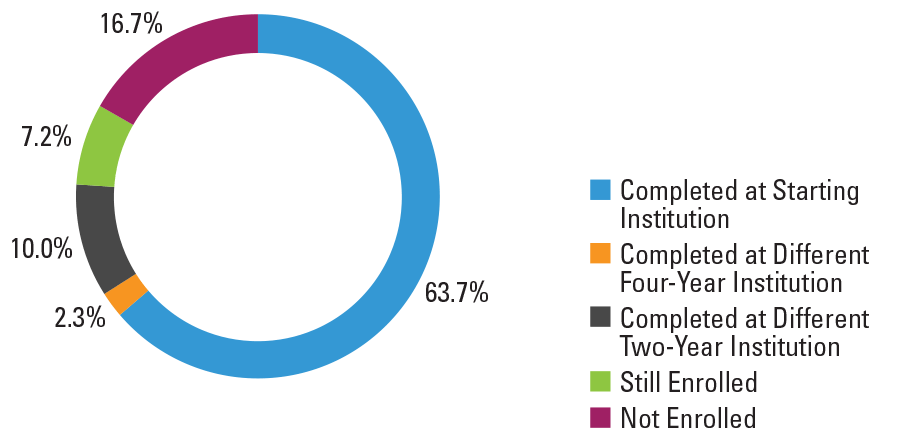
Figure 27. Six-Year Outcomes and First Completion for Students Who Started at Two-Year Public Institutions (N=766,297)*
*This figure is based on data shown in Appendix C, Table 39.
**The total completion rate for students who started at two-year public institutions is 37.5%.
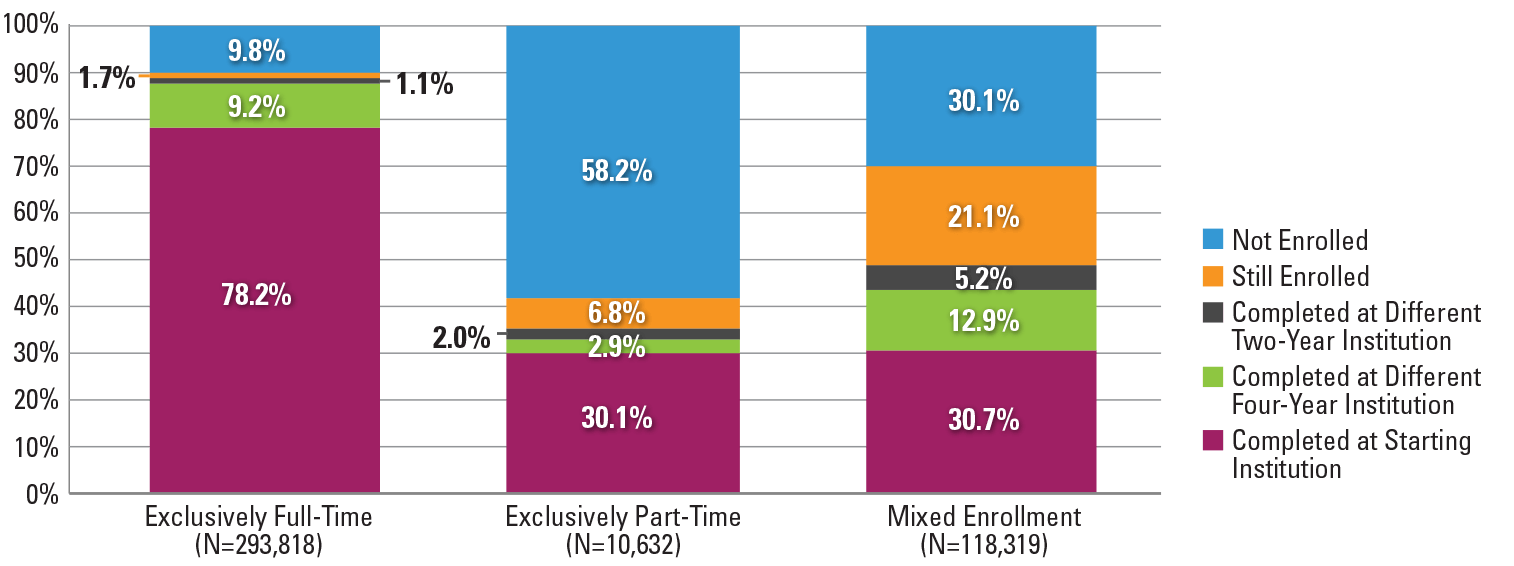
Two-year public institutions were the starting point for 33.8 percent of the students in the fall 2011 cohort (Figure 1). Overall, 37.5 percent of the students who began at a two-year public institution completed a degree within six years. Of those who completed, seven in ten students (70.6 percent) completed at their starting institution, while three in 10 students (29.4 percent) completed at a different institution. Almost half of the students who began at a two-year public institution were no longer enrolled after six years (47.3 percent) (Figure 27). Exclusively full-time students had the highest proportion of completions and lowest proportion of stop-outs. The rate at which students were still enrolled after six years was higher among those with mixed enrollments than their full-time or part-time counterparts (Figure 28).
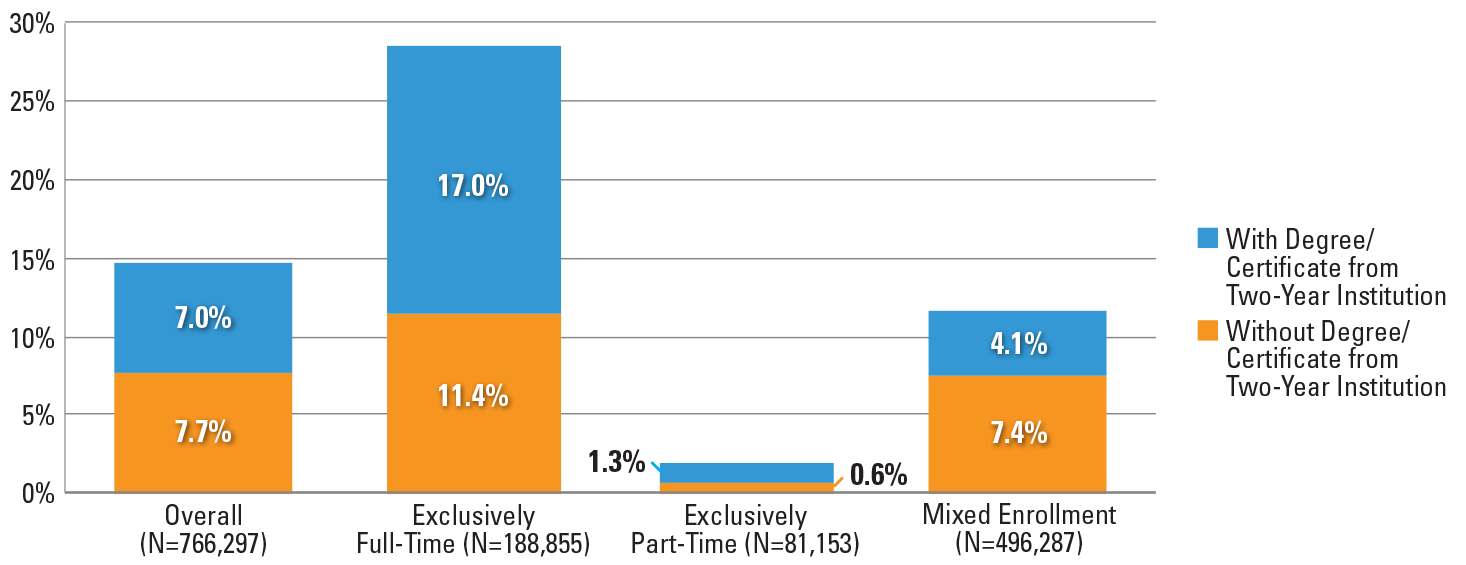
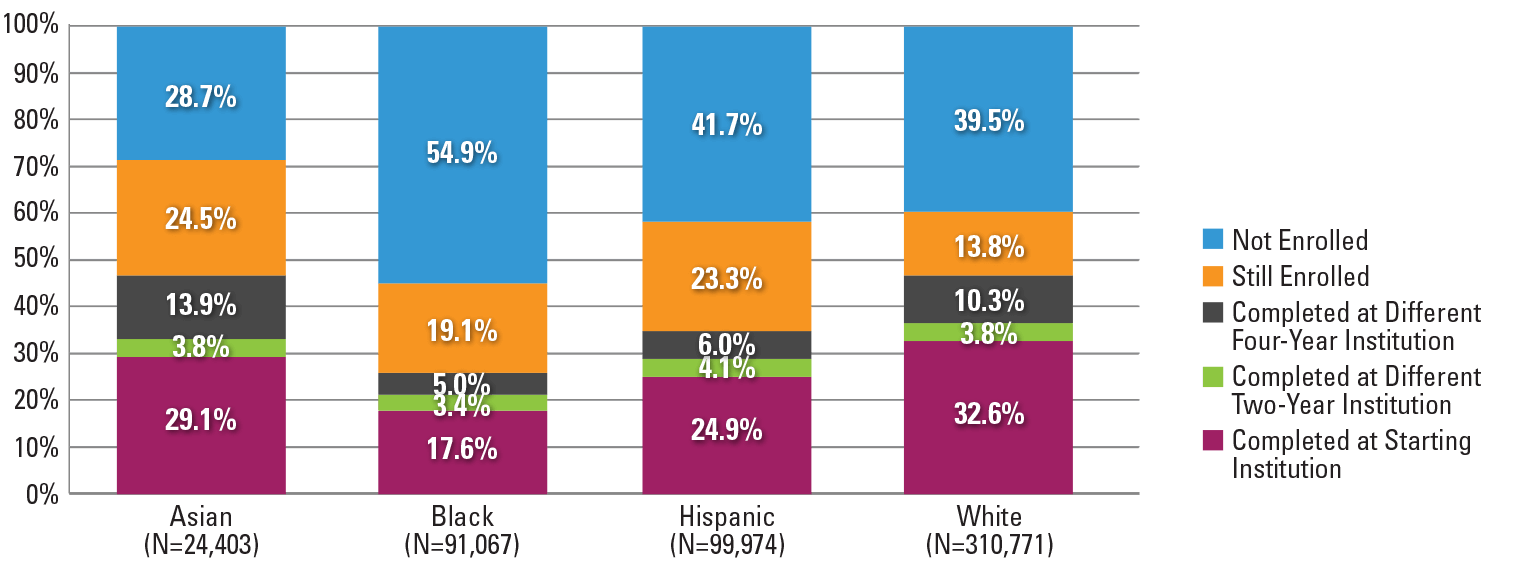
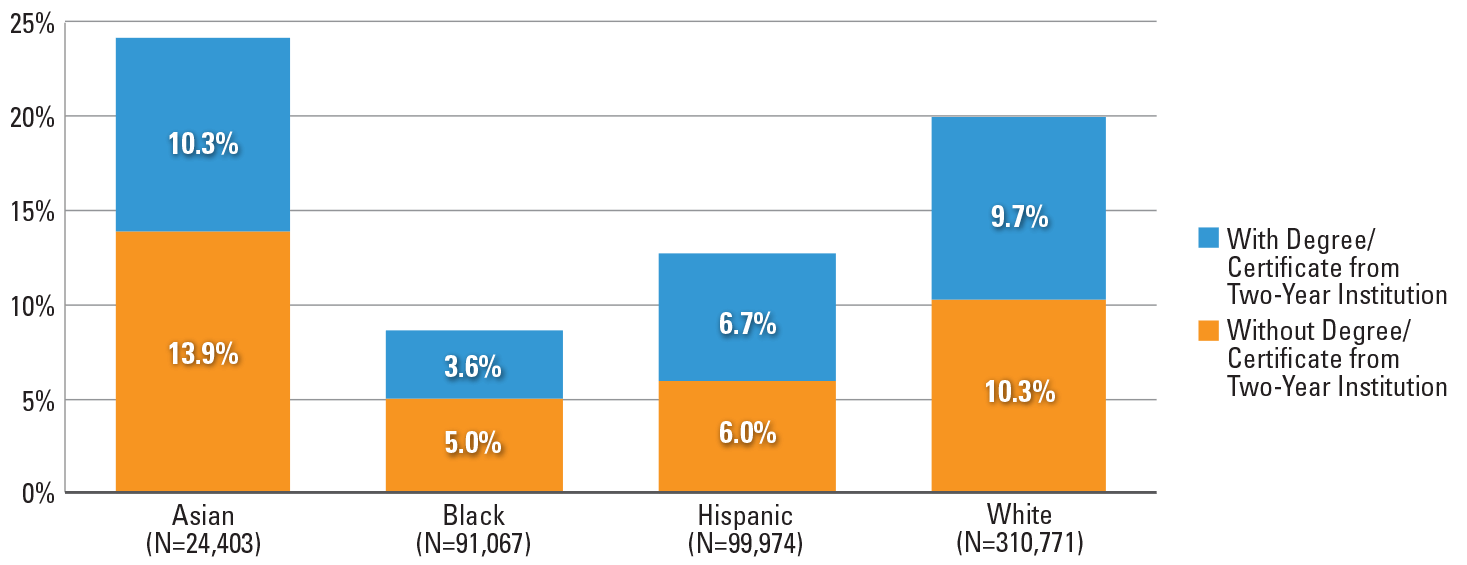
Of all students who started in two-year public institutions, 14.7 percent completed at a four-year institution, including those who did so with and without receiving a two-year credential first. In terms of race and ethnicity, just about a quarter of Asian students who started in two-year public institutions (24.2 percent), and one in five white students completed at a four-year institution. These percentages were much lower for black and Hispanic students: fewer than one in 10 black students, and one in eight Hispanic students completed at a four-year institution (8.6 percent and 12.7 percent, respectively) (Figure 31).
When disaggregated by gender, the results showed that women had a higher total completion rate than men (40.5 versus 35.7 percent) (Figure 32). The gap in completion rates between traditional-age students and adult learners was smaller among men than women. Among men, 38.5 percent of traditional-age students and 31.9 percent of adult learners finished a degree or certificate within six years, a gap of 6.6 percentage points. For women, the gap was 9.8 points (44.6 percent and 34.8 percent, respectively) (Figure 36).
In terms of race, ethnicity and gender differences, Asian women (52.0 percent) showed the highest completion rate, while black men (24.1 percent) had the lowest completion rates. (Figure 35). When disaggregated by race, ethnicity and age, a unique pattern appears for black students: adult learners have higher total completion rates than traditional-age students (by 3.7 percentage points). The reverse is true for all other racial and ethnic groups, with the advantage for traditional age students ranging from 4.0 points for Hispanics to 10.7 points for Asian students (Figure 37).
Figure 28. Six-Year Outcomes and First Completion for Students Who Started at Two-Year Public Institutions by Enrollment Intensity (N=766,295)*
*This figure is based on data shown in Appendix C, Table 40.
Figure 29. Completion at Four-Year Institutions for Students Who Started at Two-Year Public Institutions by Enrollment Intensity (N=766,297)*
*This figure is based on data shown in Appendix C, Table 40.
Figure 30. Six-Year Outcomes and First Completion for Students Who Started at Two-Year Public Institutions by Race and Ethnicity (N=526,215)*
*This figure is based on data shown in Appendix C, Table 41.
Figure 31. Completion at Four-Year Institutions for Students Who Started at Two-Year Public Institutions by Race and Ethnicity (N=526,215)*
*This figure is based on data shown in Appendix C, Table 41.
Figure 32. Six-Year Outcomes and First Completion for Students Who Started at Two-Year Public Institutions by Gender (N=719,841)*
Note: Students with missing gender data were excluded from the above figure.
*This figure is based on data shown in Appendix C, Table 42.
Figure 33. Six-Year Outcomes and First Completion for Students Who Started at Two-Year Public Institutions by Age at First Entry (N=765,147)*

Note: Students with missing birth date data were excluded from the above figure.
*This figure is based on data shown in Appendix C, Table 43.
Figure 34. Completion at Four-Year Institutions for Students Who Started at Two-Year Public Institutions by Age at First Entry (N=765,147)*
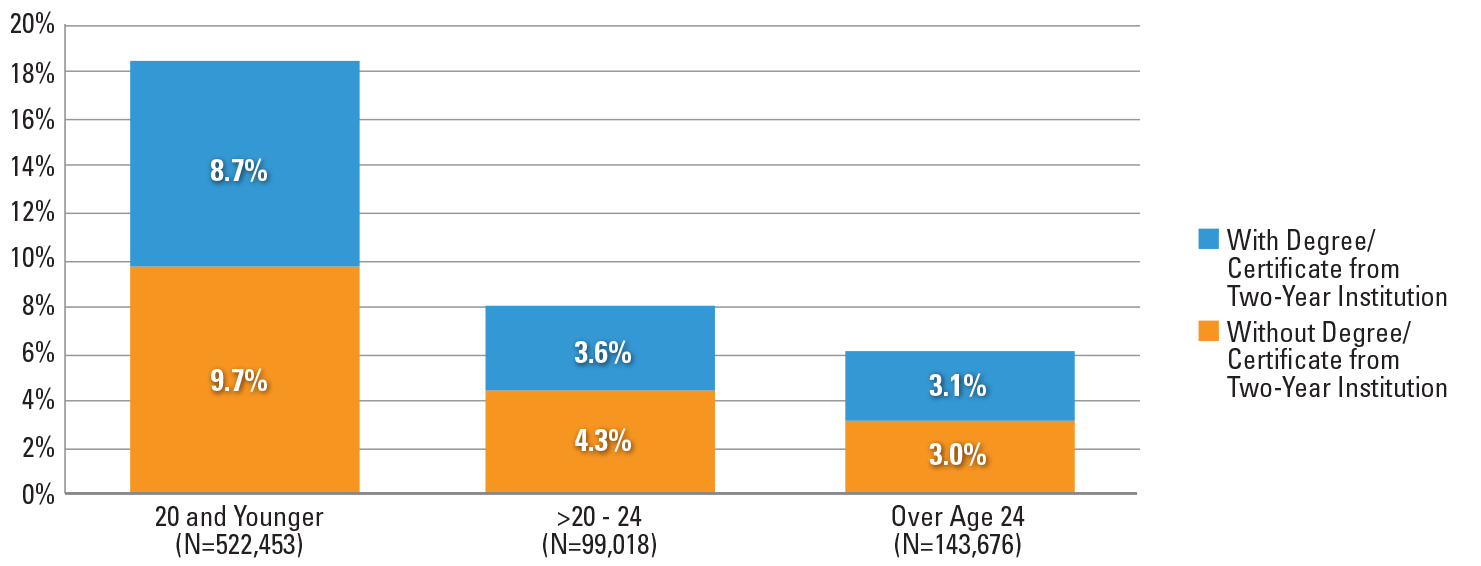
Note: Students with missing birth date data were excluded from the above figure.
*This figure is based on data shown on Appendix C, Table 43.
Figure 35. Six-Year Outcomes and First Completion for Students Who Started at Two-Year Public Institutions by Race and Ethnicity and Gender (N=505,330)*
Note: Students with missing gender data were excluded from the above figure.
*This figure is based on data shown in Appendix C, Table 44.
Figure 36. Six-Year Outcomes and First Completion for Students Who Started at Two-Year Public Institutions by Gender and Age at First Entry (N=719,357)*
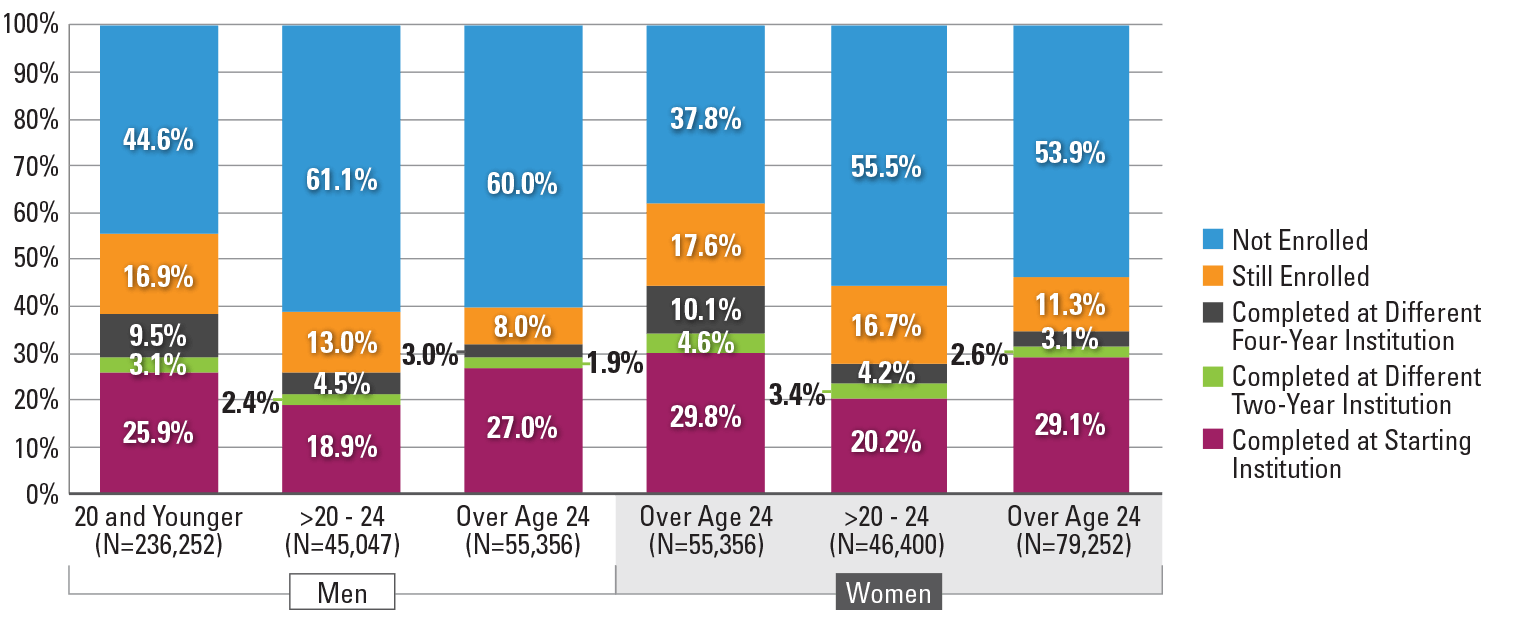
Note: Students with missing birth date data were excluded from the above figure.
*This figure is based on data shown on Appendix C, Table 45.
Figure 37. Six-Year Outcomes and First Completion for Students Who Started at Two-Year Public Institutions by Race and Ethnicity and Age at First Entry (N=525,968)*

Note: Students with missing birth date data were excluded from the above figure.
*This figure is based on data shown in Appendix C, Table 46.
Students Who Started at Four-Year Private Non-profit Institutions
Figures 38 through 45 show the six-year outcomes for students who started at four-year private nonprofit institutions.
Figure 38. Six-Year Outcomes for Students Who Started at Four-Year Private Nonprofit Institutions (N=423,091)*
*This figure is based on data shown in Appendix C, Table 51.
*The total completion rate for students who started at four-year private nonprofit institutions is 76%.
Students who started at four-year private nonprofit institutions represented 18.6 percent of the fall 2011 cohort (Figure 1). Overall, 76 percent of the students who started at these institutions completed a postsecondary credential within six years. Of the students who did so, over four in five (83.8 percent) completed at their starting institution (Figure 38).
In terms of the outcomes disaggregated by enrollment intensity, gender, and age, the patterns were consistent with past reports.
Exclusively full-time students were more likely to complete a credential within six years (88.5 percent) than exclusively part-time (35.1 percent) or mixed enrollment students (48.8 percent), and over one-half (58.2 percent) of part-time students had stopped out by the end of the study period (Figure 39). Female students had a higher completion rate (79.5 percent) than male students (72.6 percent) (Figure 41) and traditional-age students were more likely to complete a credential within six years (78.7 percent) than delayed entry (67.4 percent) or adult learners (61.6 percent) (Figure 42). In terms of race and ethnicity, Asian students had the highest completion rate at 85.9 percent, in comparison to white (81.9 percent), Hispanic (72.3 percent), and black students (57.3 percent) (Figure 40).
In terms of outcomes disaggregated by race, ethnicity and gender, the patterns were similar to results from other institution types, where Asian women had the highest completion rate (88.5 percent) and black men had the lowest completion rate (50.7 percent) (Figure 43).
Figure 39. Six-Year Outcomes for Students Who Started at Four-Year Private Nonprofit Institutions by Enrollment Intensity (N=422,769)*
*This figure is based on data shown in Appendix C, Table 52.
Figure 40. Six-Year Outcomes for Students Who Started at Four-Year Private Nonprofit Institutions by Race and Ethnicity (N=307,440)*
*This figure is based on data shown in Appendix C, Table 53.
Figure 41. Six-Year Outcomes for Students Who Started at Four-Year Private Nonprofit Institutions by Gender (N=400,979)*
Note: Students with missing gender data were excluded from the above figure.
*This figure is based on data shown in Appendix C, Table 54.
Figure 42. Six-Year Outcomes for Students Who Started at Four-Year Private Nonprofit Institutions by Age at First Entry (N=421,306)*
Note: Students with missing birth date data were excluded from the above figure.
*This figure is based on data shown in Appendix C, Table 53.
Figure 43. Six-Year Outcomes for Students Who Started at Four-Year Private Nonprofit Institutions by Gender and Race and Ethnicity (N=297,843)*
Note: Students with missing gender data were excluded from the above figure.
*This figure is based on data shown in Appendix C, Table 56.
Figure 44. Six-Year Outcomes for Students Who Started at Four-Year Private Nonprofit Institutions by Gender and Age at First Entry (N=400,472)*

Note: Students with missing birth date data were excluded from the above figure.
*This figure is based on data shown in Appendix C, Table 57.
Figure 45. Six-Year Outcomes for Students Who Started at Four-Year Private Nonprofit Institutions by Race and Ethnicity and Age of First Entry (N=307,379)*
Note: Students with missing birth date data were excluded from the above figure.
*This figure is based on data shown in Appendix C, Table 58.
Students Who Started at Four-Year Private For-Profit Institutions
Figures 46 through 50 present the six‐year outcomes for students who started at four‐year private for-profit institutions.
Figure 46. Six‐Year Outcomes for Students Who Started at Four‐Year Private For‐Profit Institutions (N=58,885)*
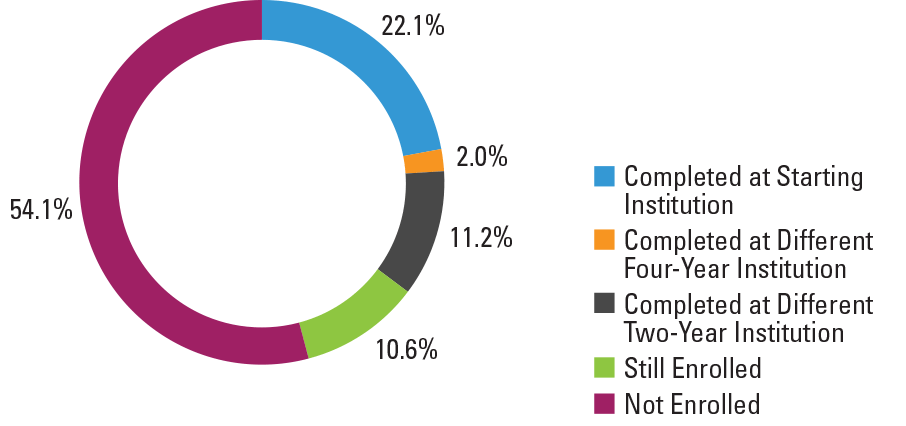
*This figure is based on data shown in Appendix C, Table 51.
*The total completion rate for students who started at four-year private nonprofit institutions is 76%.
Four-year private for-profit institutions represent the starting point for roughly 2.8 percent of the students in the fall 2011 cohort (Figure 1). Among all institution types, students who started at four-year private for-profits had the lowest total completion rate (35.3 percent), with 22.1 percent completing at their starting institution and 13.2 percent completing at a different institution (Figure 46).
High still enrolled rates among mixed enrollment students (16.3 percent), as discussed in previous sections, remained consistent here. Stop-out rates were highest for exclusively part-time students (68.3 percent) compared to the full-time or mixed enrollment students (Figure 47). When examined by gender, a higher proportion of men than women stopped out (56.7 percent versus 52.2 percent no longer enrolled) (Figure 48). Among the three age groups, delayed entry students (25.6 percent) had lower completion rates than their traditional-age and adult learner counterparts (Figure 49). In addition, this group of students showed the highest stop-out rates, regardless of gender (Figure 50).
Figure 47. Six‐Year Outcomes for Students Who Started at Four‐Year Private For‐Profit Institutions by Enrollment Intensity (N=58,751)*
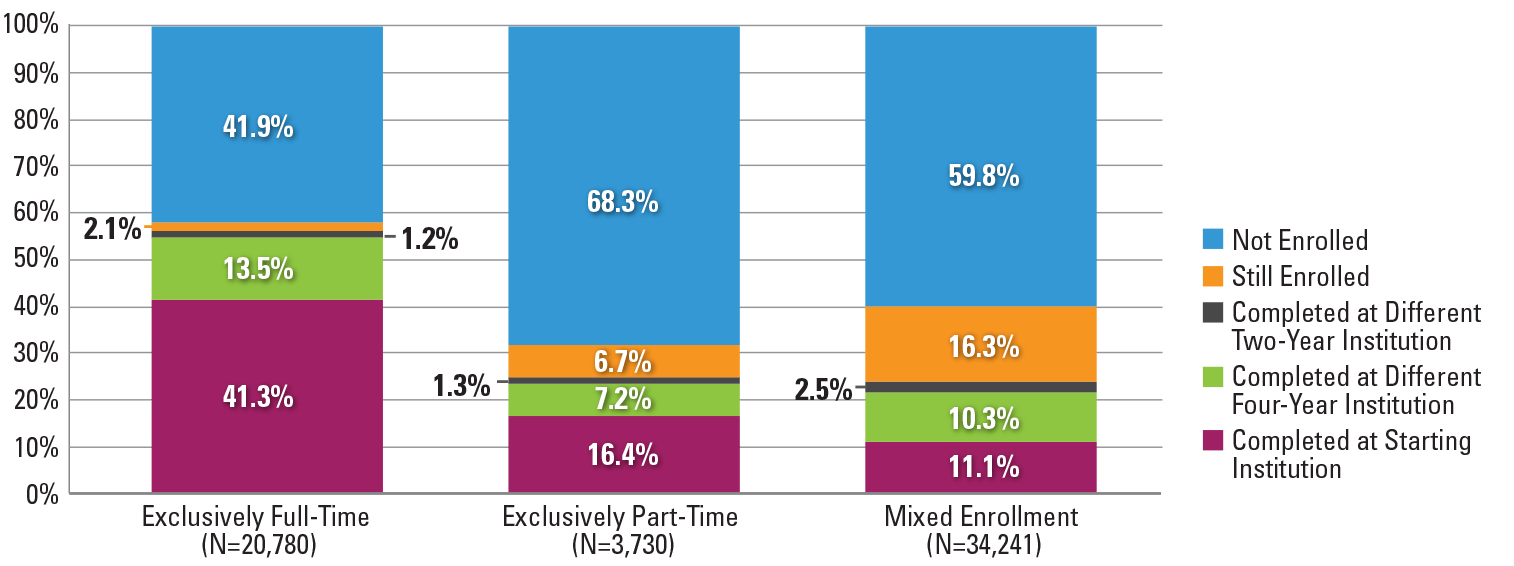
*This figure is based on data shown in Appendix C, Table 64.
Figure 48. Six‐Year Outcomes for Students Who Started at Four‐Year Private For‐Profit Institutions by Gender (N=56,874)*
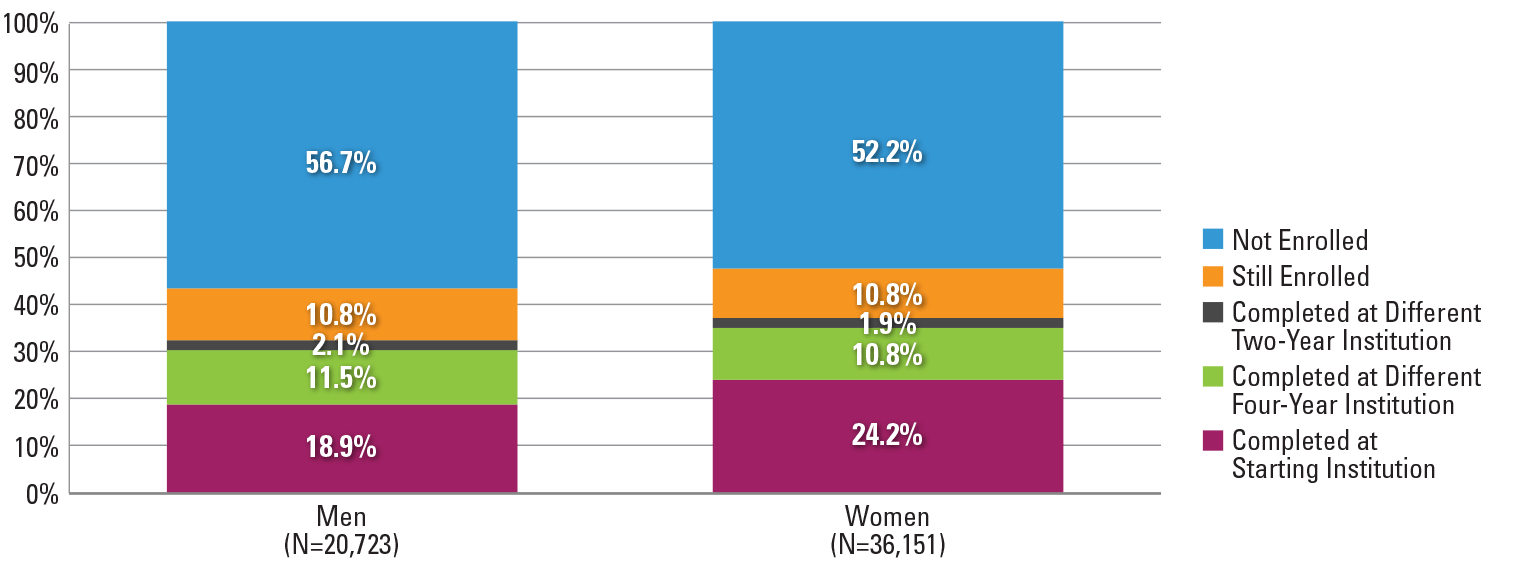
Note: Students with gender data missing were excluded from the above figure.
*This figure is based on data shown in Appendix C, Table 65.
Figure 49. Six‐Year Outcomes for Students Who Started at Four‐Year Private For‐Profit Institutions by Age at First Entry (N=58,855)*
Note: Students with birth date data missing were excluded from the above figure.
*This figure is based on data shown in Appendix C, Table 66.
Figure 50. Six-Year Outcomes for Students Who Started at Four-Year Private For-Profit Institutions by Gender and Age at First Entry (N=56,866)*
Note: Students with missing birth date data were excluded from the above figure.
*This figure is based on data shown in Appendix C, Table 67.
Completion across State Lines
Figures 51 through 54 present six‐year outcomes for students who completed at institutions across state lines.
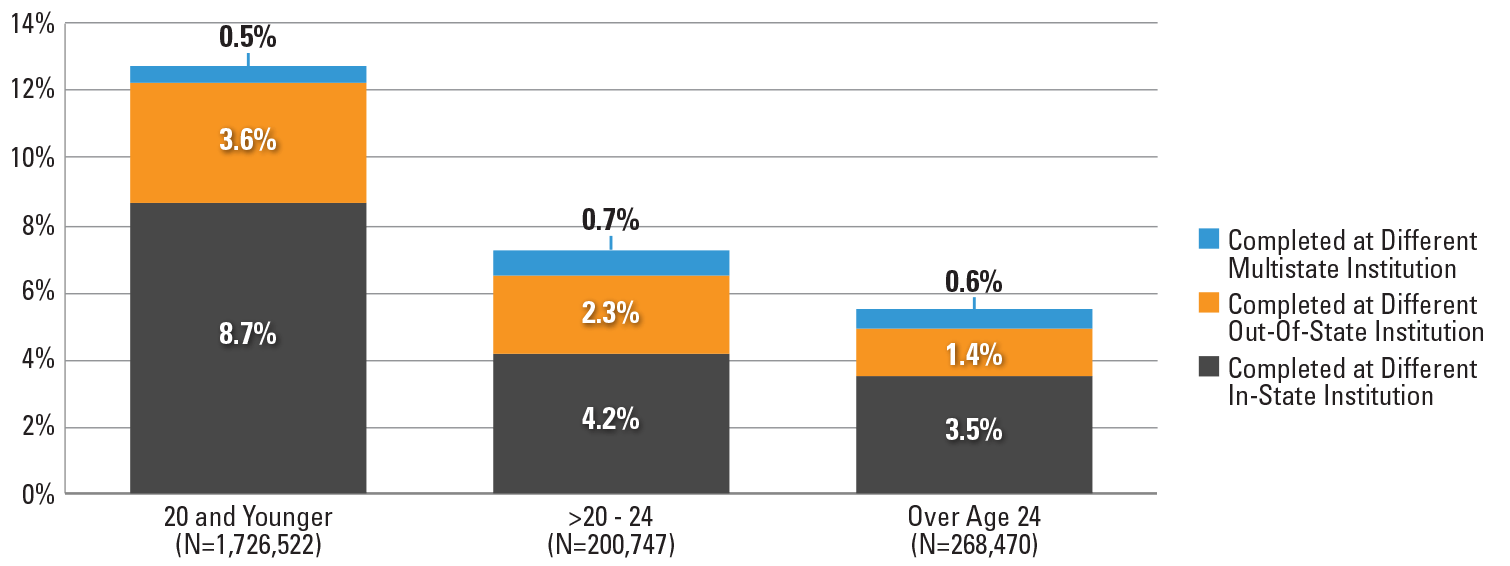
Overall, 11.4 percent of all students in the 2011 cohort completed their first credential at an institution other than their starting institution, including 7.6 percent at an institution in the same state where they started college, 3.2 percent in a different state, and 0.6 percent at a multistate institution. In other words, among those who completed at a different institution, more than one in four had transferred across state lines and completed at an institution out-of-state (28.1 percent, where multi-state institutions are not counted as out of state). This rate was highest among students who enrolled full-time, with one-third of those who completed elsewhere (3.5 out of 10.9 percent) having done so in a different state (Figure 51). A higher proportion of women than men completed at a different institution (12.6 percent versus 10.6 percent) (Figure 52). However, among students who completed at a different institution, men were more likely to earn a credential from an out-of-state institution than women (30.2 percent versus 27 percent). When the outcomes are broken down by age, traditional-age students were more likely to complete at a different in-state (8.7 percent) and out-of-state institution (3.6 percent) than delayed entry or adult learners. Among the students who completed at a different institution, however, the rate of completing at an institution in a different state was highest for delayed entry students (31.9 percent), followed by traditional-age students (28.1 percent), and adult learners (25.5 percent) (Figure 53).
Figure 51. Completion Rates at Different Institutions Across State Lines by Enrollment Intensity (N=2,201,270)*
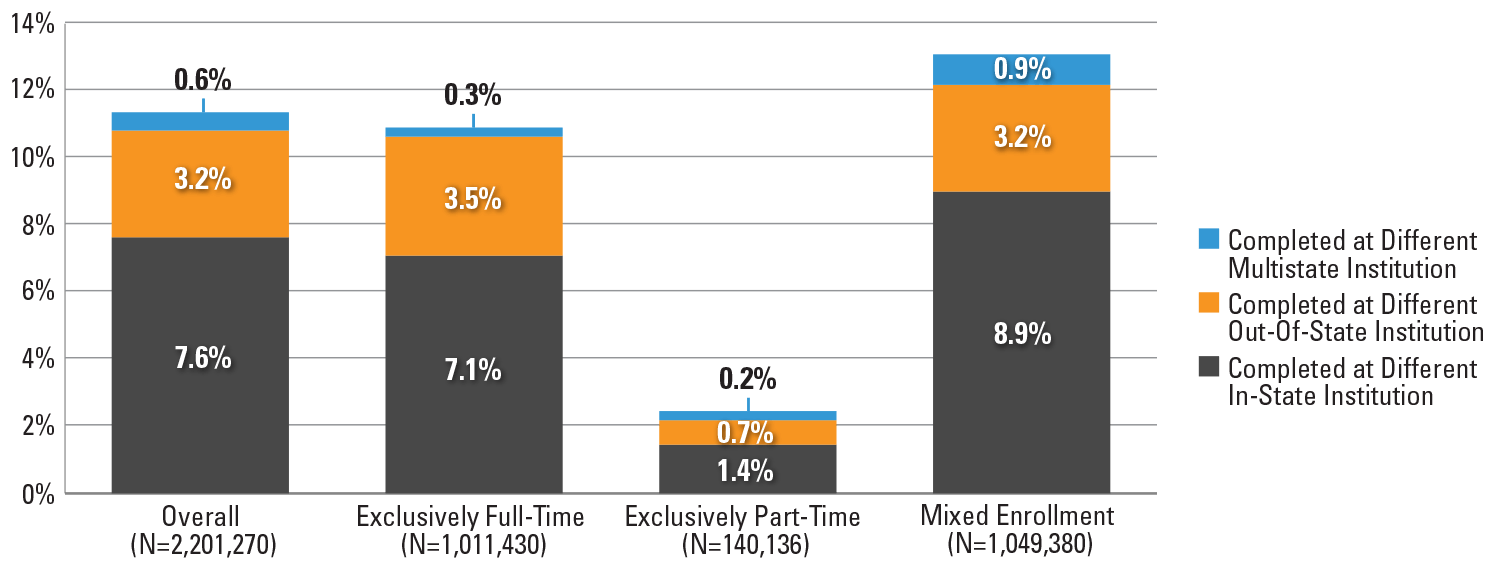
Note: Students with missing gender data and those who started at a multistate institution were excluded from the above figure.
*This figure is based on data shown in Appendix C, Table 69.
Figure 52. Completion Rates at Different Institutions Across State Lines by Gender (N=2,069,177)*
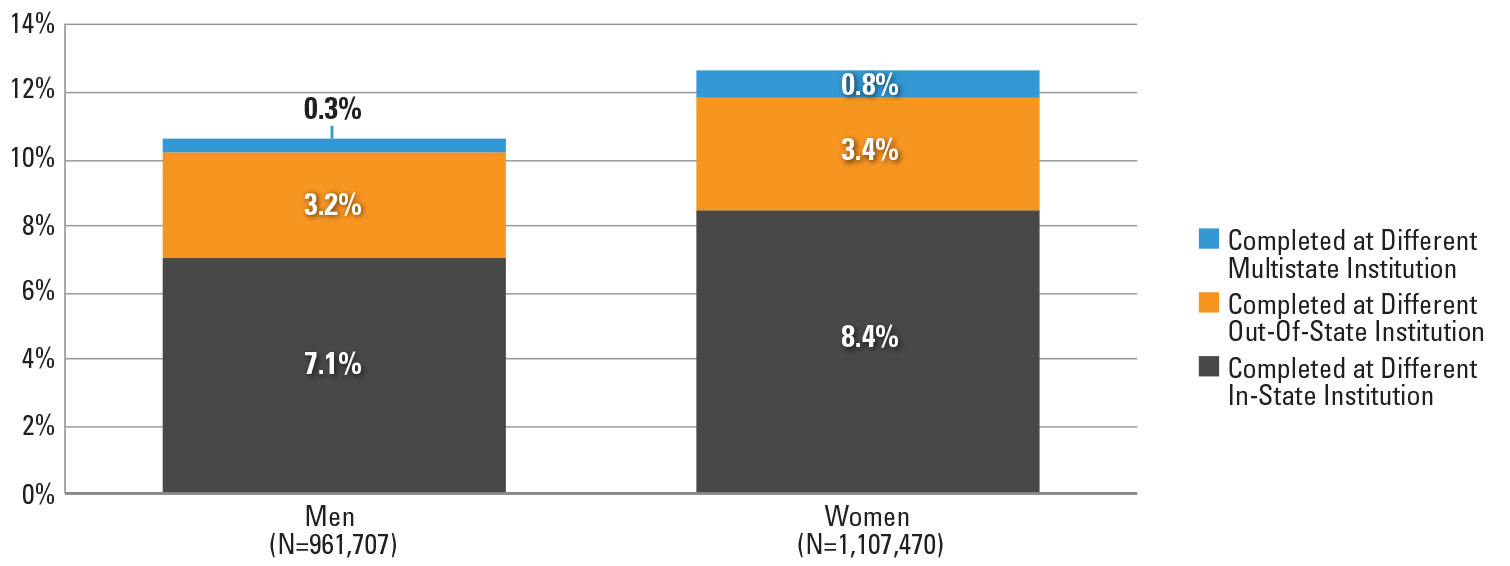
Note: Students with missing gender data and those who started at a multistate institution were excluded from
the above figure.
*This figure is based on data shown in Appendix C, Table 71.
Figure 53. Completion Rates at Different Institutions Across State Lines by Age at First Entry (N=2,195,739)*
Note: Students with missing birth date data and those who started at a multistate institution were excluded from the above figure.
*This figure is based on data shown in Appendix C, Table 72.
Figure 54. Completion Rates at Different Institutions Across State Lines by Gender and Age at First Entry (N=2,068,003)*
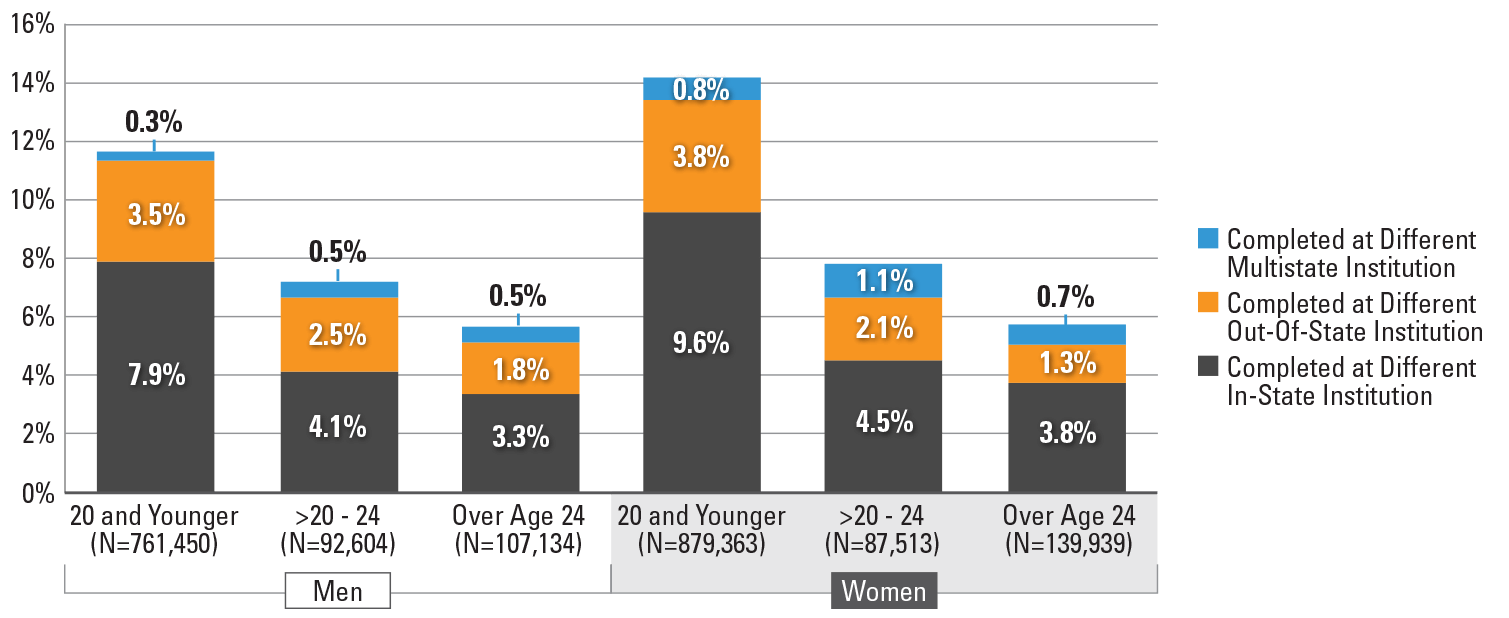
Note: Students with missing birth date or gender data and those who started at a multistate institution were excluded from the above figure.
*This figure is based on data shown in Appendix C, Table 73.
Supplemental Feature: Eight‐Year Outcomes for Fall 2009 Cohort
The supplemental feature investigates the eight-year outcomes of first-time students who started their postsecondary education in fall 2009, the cohort examined in Signature Report 10, published in November 2015. This part of the report examines eight-year postsecondary outcomes for this cohort, relative to those in the sixth year.
Outcomes by Enrollment Intensity
Figure S-1. Eight-Year Outcomes for Fall 2009 Cohort by Enrollment Intensity (N=2,900,362)*
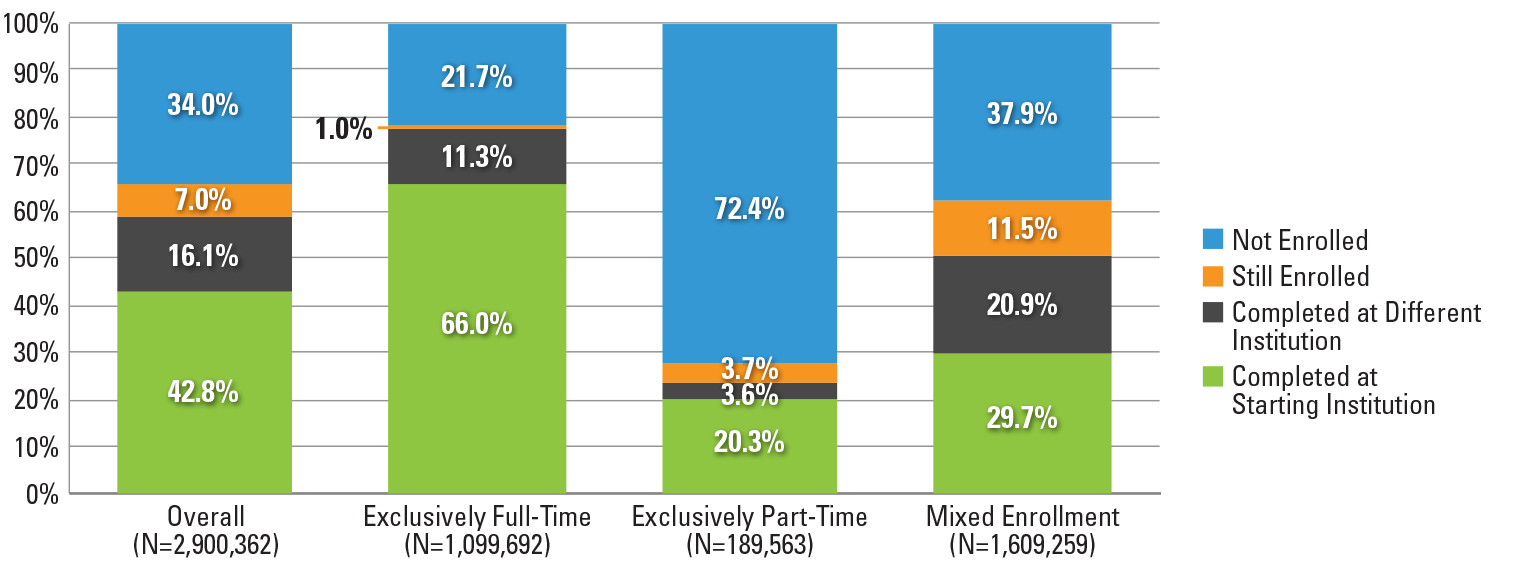
*This figure is based on data shown in Appendix C, Table S‐2.1.
Figure S‐1 displays eight-year outcomes for the fall 2009 cohort, including first degree or certificate completion at starting or different institution, continuing enrollment during the last year of the study period, and stop-out from college. Overall, the eighth-year completion rate was 58.9 percent, including 42.8 percent who completed at their starting institution, and an additional 16.1 percent at a different institution. This represents a 6 percentage point increase in the total completion rate over the six-year rate.
Mixed enrollment students showed the largest increase (8.1 percentage points) in their eight-year completion rate over their six-year completion rate compared to full-time or part-time students. With an 11.1 percentage point decline in the still enrolled rate, however, the proportion of students who stopped out increased to 37.9 percent from the six year stop-out rate of 35.2 percent.
Exclusively part-time students’ completion rate increased by 4.2 percentage points, bringing the total eight-year completion rate to 23.9 percent. The stop-out rate for part-time students remained virtually the same (72.4 percent at eight years and 72.1 percent at six years), demonstrating only limited gains from a longer tracking period.
Completion at Starting vs. Different Institution
Figure S-2 depicts the proportion of completers who completed at starting versus different institution broken out by enrollment intensity. Over one in four students (27 percent) completed at institutions different from their starting institution, which was an increase from the share of students completing elsewhere during the six- year tracking period (23 percent). An even larger share of completions for mixed enrollment students (41.3 percent) occurred at a different institution.
Figure S-2. Eight-Year Completion at Starting vs. Different Institution by Enrollment Intensity for Fall 2009 Cohort (N=1,710,002)*
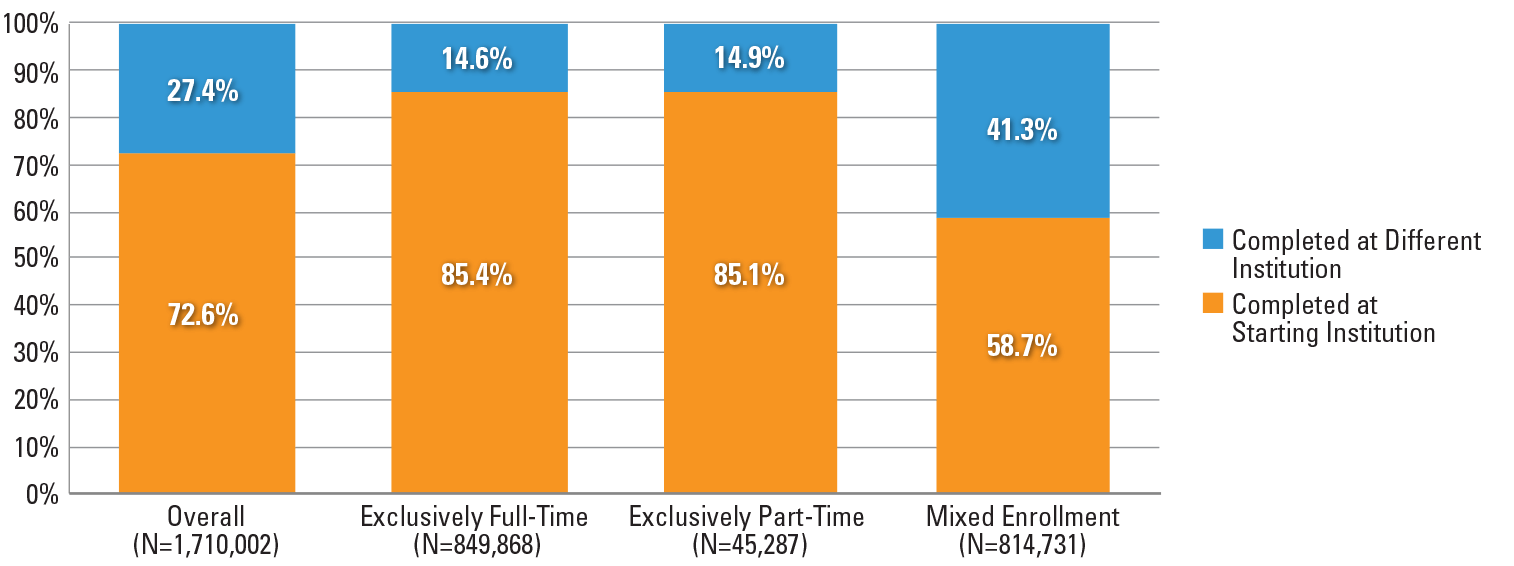
*This figure is based on data shown in Appendix C, Table S‐2.1.
Outcomes by Age at First Entry
Figure S-3 displays eight-year outcomes by age at first entry. The total completion rate of traditional-age students increased by 6.7 percentage points resulting in a total eight-year completion rate of 65.3 percent. Delayed entry students gained 5 percentage points in their eight-year completion rate, and adult learners gained 4.1 percentage points over the six-year rate bringing their eight-year completion rates to 38.6 percent and 43.3 percent, respectively.
Figure S-3. Eight-Year Outcomes for Fall 2009 Cohort by Age at First Entry (N=2,895,299)*
Note: Students with date of birth data missing were excluded from the above figure.
*This figure is based on data shown in Appendix C, Table S‐3.1.
Outcomes by Starting Institution Type
Figure S-4 presents the eight-year outcomes by institution type where students first started in fall 2009. The largest gains in the eight-year completion rate were for students in four-year public and two-year public institutions: an additional 6.7 percent of the students who started in four-year public institutions resulting in a total of 67.9 percent eight-year completion rate and an additional 6.1 percent of community college starters finished a certificate or degree bringing the total eight-year completion rate up to 44.2 percent.
The eight-year completion rate increased to 76.0 (from the six-year completion rate of 71.5 percent) for those who started at four-year private nonprofit institutions. A similar increase of 4.6 percentage points was observed for students who started at four-year private for-profit institutions (37.3 percent eight-year completion rate).
Figure S-4. Eight-Year Outcomes for Fall 2009 Cohort by Starting Institution Type (N=2,900,362)*
*This figure is based on data shown in Appendix C, Table S-4.1.
Discussion
The overall national six-year completion rate for the fall 2011 cohort was 56.9 percent, an increase of 2.1 percentage points from the fall 2010 cohort. This higher completion rate represents about 48,000 more graduates than the fall 2010 cohort, even with a slightly smaller cohort size. It is important to note that some of the enrollment and outcome differences between the 2010 and 2011 cohort are due to cohort definition changes (see Appendix A for details). However, all of the longitudinal changes discussed in this section of the report represent an actual change in the same direction regardless of cohort definitions unless otherwise noted.
Continued Increase in Overall Completion Rates
One of the major findings from the previous completions report, on the fall 2010 entering cohort, was that the overall completion rate had increased for the first time since the Great Recession, rising 1.9 percentage points to 54.8 percent. Although promising, that was still more than one point lower than the pre-recession high of 56.1 percent reached by the cohort that entered college in 2007. For the current 2011 cohort, the six year completion rate grew by an additional 2.1 points, surpassing the pre-recession rate.
Further, a decrease of 1.5 percent was observed in the share of students who were still enrolled in their sixth year without having earned a degree. With more students graduating and fewer still enrolled, the share of students stopping out, with no degree and no enrollment in the sixth year, decreased only slightly, from 31.9 to 31.4 percent.
These rates represent all first-time students, including part-time, full-time and mixed enrollment status, who completed a postsecondary credential within six years after their first enrollment, regardless of the starting institutional sector or level, and including those who graduated after transferring. The trend represents a strong recovery in student success rates, across all of higher education, from the declines caused by the recession. Nonetheless, troubling gaps persist among students from different age, gender, race, and ethnicity groups.
Increases in Traditional-Age Students and Full-Time Enrollments
The report divides students into three age groups: those who began postsecondary education immediately after high school (20 or younger), those who delayed college for a few years (over 20 through 24), and adult learners (over 24). We further characterize students by their enrollment behaviors: exclusively full-time, exclusively part-time, and a mixed enrollment category for students who have some terms at each status. These groupings highlight several differences between the 2010 and 2011 cohorts that contributed to the increased completion rate. First, a three percentage point increase in the proportion of traditional-age students, from 73.8 percent to 76.8 percent, and a decrease in the proportion of adult enrollments, from 18.8 to 13.7 percent of the cohort. Prior reports have shown that traditional-age students are more likely than delayed-entry and adult learners to complete a credential within six years. In the 2011 cohort, 61.7 percent of traditional-age students completed a credential, compared to 41.7 percent for adult learners. The shift to a younger cohort alone accounts for some of the rise in the overall completion rate, yet there was also a nearly two percentage point increase in the completion rate for traditional-age students, from 59.9 percent to 61.7 percent, and a nearly one point increase among adult learners, from 40.8 to 41.7 percent.
Along with more traditional-age students, the share of full-time students also increased, from 39.5 percent in 2010 to 45.7 for the 2011 cohort. This contributed directly to the overall increase in the completion rate as well. Specifically, 80.1 percent of students who enrolled exclusively full-time completed a degree, compared to 20.5 percent for exclusively part-time students and 39.5 percent for mixed enrollment students.
Increase in Completion Rates for Students Who Started at Four-Year Public and Four-Year Private Nonprofit Institutions
Shifts in the institutional mix of the cohort also contributed to the rise in completion rates. The share of students enrolling in four-year public institutions increased by 2.7 percent of the cohort, and 1.9 percent more enrolled at four-year private nonprofits, compared to the 2010 cohort. These institutional sectors have higher completion rates to begin with, yet each also showed markedly improved rates this year. The total completion rate for students who started at a four-year public institution increased from 62.4 to 64.7 percent, while the four-year private nonprofit rate grew from 73.9 to 76.0 percent, an increase of over 2 percentage points from the 2010 cohort for both sectors.
Men experienced a slightly stronger increase than women in these sectors. The completion rate for men at four-year public institutions grew 2.7 percentage points, whereas for women it grew by 2.3 percentage points (58.3 to 61.1 percent for males, and 66.3 to 68.5 percent for females). Despite a slightly higher increase for men, women still hold an advantage of 7.4 percentage points in total completion rates at four-year public institutions, slightly higher than the 6.9 point gap by gender at four-year private nonprofit institutions (79.5 vs. 72.6 percent).
Decrease in Two-Year Public Enrollments
While both the share of students in the cohort and the overall completion rates increased at four-year public institutions and private nonprofit institutions, the reverse was true at two-year public institutions. There was a substantial decrease in the proportion of students enrolling in two-year public institutions, from 37.3 percent of the 2010 cohort to 33.8 percent of the 2011 cohort. There was also a decline in the total completion rate for two-year starters, from 39.3 percent for the 2010 cohort to 37.5 percent for 2011, regardless of whether the completions occurred at a two-year or a four-year institution. About half of the decline in the share of the cohort, and all of the decline in the completion rate, however, are due to a definitional change: dual enrollment high school students were excluded from the 2011 cohort. Without this exclusion, the completion rate would have increased slightly, to 40.1 percent (see Appendix A).
In addition to examining the overall completion rates of students who started at two-year public institutions, we also looked at their completions at four-year institutions. This rate, including those who completed with and without first earning a degree at a two-year institution, was 14.7 percent, a decline from 16.0 percent for the 2010 cohort.
Enrollment and Completion Disparities by Race and Ethnicity
When examined by race and ethnicity, Asian and white students had much higher completion rates (68.9 percent and 66.1 percent, respectively) than Hispanic and black students (48.6 percent and 39.5 percent, respectively). Black students represent the only group that is more likely to stop out or discontinue enrollment than to complete a credential within six years (total completion rate of 39.5 percent, compared to the no longer enrolled rate of 42.8 percent).
Among students who started in four-year public institutions, black students had the lowest six-year completion rate (46.0 percent). The completion rate of Hispanic students was almost 10 percentage points higher (55.7 percent). Over two-thirds of white students (71.7 percent) and three-quarters of Asian students (75.8 percent) completed a degree within the same period.
The overall completion rates for students who started in two-year public institutions were identical for white and Asian students (46.7 and 46.8 percent, respectively) and much lower for Hispanic and black students (35.0 and 26.0 percent, respectively).
Black students had a much higher completion rate when starting at four-year private non-profit institutions (57.3 percent) than at other institution types. The completion rates for Asian, Hispanic, and white students were also higher in four-year private non-profit institutions than other institution types (85.9 percent, 72.3 percent, and 81.9 percent, respectively).
Eight-Year Outcomes for the Fall 2009 National Cohort
*Note, the cohort definitions used to calculate the eight-year outcomes for the fall 2009 cohort were no different from the cohort definitions used to calculate the six-year outcomes for the fall 2009 cohort.
We examined the eight-year outcomes for the fall 2009 cohort, tracking both their six-year enrollment and completion patterns as of spring 2015, and their eight-year outcomes as of spring 2017. Given these two extra years, an additional 6.1 percent of the cohort completed degrees. This brought the total completion rate to 59.0 percent, including 42.8 percent who completed at their starting institution and an additional 16.1 percent who completed at a transfer institution. At the same time, the percentage of students who were still enrolled at the end of the eight-year period was 7.1 percentage points lower than at the six-year period (7.0 percent and 14.1 percent, respectively).
Results show that students who required the two extra years to complete their first degree were more likely to graduate from a different institution than from the one where they started: only 38 percent of them completed at the same institution (2.3 percent of the starting cohort) compared to 62 percent who completed at a transfer institution (3.8 percent of the starting cohort).
Among students with mixed enrollment intensities, the eight-year completion rate showed a marked increase over the six-year completion rate (50.6 percent and 42.2 percent, respectively). For exclusively part-time students the eight-year completion rate was 4.2 percentage points higher than the six-year completion rate (23.9 percent and 19.7 percent, respectively).
Examining the increases in the completion rate from six years to eight years by age revealed large increases for all age groups. The eight-year completion rate was about 7 percentage points higher than the six-year rate for traditional-age students, 5 percentage points higher for delayed entry students, and 4 percentage points higher for adult learners.
For students who started in four-year public institutions, the two extra years raised the completion rate by 6.7 points, from 61.2 percent to 67.9 percent. The increase was slightly smaller for students who started at two-year public institutions (38.1 percent and 44.2 percent, respectively). Students starting at four-year private institutions gained the least, about 4.5 percentage points, from the extra two years (71.5 and 76.0 at nonprofits; 32.8 and 37.3 at for-profits).
Implications for Policy
In our previous reports, the effects of the Great Recession on higher education were clear. There were large increases in enrollments among adult and part-time students and declines in the proportion of students completing a credential. In last year’s report, on outcomes for the 2010 entering cohort, signs of the post-recession recovery were beginning to show. Enrollments began to return to normal and the completion rates rebounded as well. For the 2011 cohort, the signs of post-recession recovery were even clearer: adult students shrank as a share of the cohort, enrollments in four-year public and four-year private nonprofit institutions increased their share of the cohort, and the total completion rate surpassed the pre-recession high.
In the coming years, demographic changes will overtake economic shifts in their impact on college completion rates, as the number of high school graduates declines and their diversity continues to increase. The challenges for institutions now serving the potential graduates of the cohorts that entered college in 2012 and later include continuing to adapt their programs to better meet the size, demographic composition, and academic needs of these cohorts.
The gaps in completion rates identified in this report, based on student enrollment behaviors such as enrollment intensities, age at entry, and transfer and mobility among multiple institutions, can help point the way, showing where more work is needed to tailor programs and policies for specific student populations.
Using comprehensive student-level data to investigate enrollment and completion outcomes on the national level enables a broad understanding of the changes that occur each year in postsecondary education in the U.S. We hope this report serves as a useful benchmarking tool for practitioners and policymakers as they create, track and evaluate the efficacy of current policies and programs for serving the needs of today’s students.
References
Bailey, T. (2012). Can community colleges achieve ambitious graduation goals? In Kelly, A. P., & Schneider, M. (Eds), Getting to graduation: the completion agenda in higher education (pp. 73-101) Baltimore, MD: Johns Hopkins University Press, 2012
Bailey, T. & Cho, S. (2010). Issue brief: Developmental education in community colleges prepared for: The White House Summit on Community College. Community College Research Center. Teachers College Columbia University .Retrieved from http://www2.ed.gov/PDFDocs/college-completion/07-developmental-education-in-community-colleges.pdf.
Bill & Melinda Gates Foundation. (2015). New initiative to double the number of low-income students in the U.S. who earn a postsecondary degree. Retrieved http://www.gatesfoundation.org/Media-Center/Press-Releases/2008/12/New-Initiative-to-Double-the-Number-of-LowIncome-Students-in-the-US-Who-Earn-a-Postsecondary-Degree
College Board Advocacy and Policy Center. (2008). Coming to our senses: Education and the American future. New York, NY: National Conference for State Legislatures. Retrieved from https://secure-media.collegeboard.org/digitalServices/pdf/advocacy/admissions21century/coming-to-our-senses-college-board-2008.pdf
College Board Advocacy and Policy Center. (2010). The college completion agenda: State policy guide. New York, NY: National Conference for State Legislatures. Retrieved from http://www.ncsl.org/documents/educ/policyguide_062810sm.pdf
Doyle, W. R. (2009). Impact of increased academic intensity on transfer rates: An application of matching estimators to student-unit record data. Research in Higher Education, 50, 52-72.
Fink, J., Jenkins, D., Yanagiura, T. (2017). What happens to students who take community college “dual enrollment” courses in high school? Community College Research Center. Teachers College Columbia University. Retrieved from https://ccrc.tc.columbia.edu/publications/what-happens-community-college-dual-enrollment-students.html
Henry, L., & Stahl, N. (2017). Dismantling the developmental education pipeline: Potent pedagogies and promising practices that address the college readiness gap. Journal of Adolescent & Adult Literacy, 60(6), 611–616. doi: 10.1002/jaal.640
Ishitani, T. T. (2006). Studying attrition and degree completion behavior among first-generation college students in the United States. The Journal of Higher Education 77(5), 861-885. The Ohio State University Press. Retrieved April 13, 2016, from Project MUSE database.
Kopko, E., & Crosta, P. (2016). Should community college students earn an associate degree before transferring to a 4-Year institution? Research in Higher Education, 57(2), 190-222. doi: 10.1007/s11162-015-9383-x
Lee, J. M., Jr., Edwards, K., Menson, R., & Rawls, A. (2011). The college completion agenda: 2011 progress report. Washington, DC: College Board Advocacy and Policy Center
Lumina Foundation for Education. (2009). Goal 2025: Lumina Foundation’s strategic plan. Indianapolis, IN.
Ma, J., & Baum, S. (2016). Trends in community colleges: Enrollment, prices, student debt, and completion. New York, NY: College Board Research. Retrieved from http://www.highereducation.org/reports/pa_at/PolicyAlert_06-2011.pdf
National Center for Public Policy and Higher Education. (2011). Affordability and transfer: Critical to increasing baccalaureate degree completion. San Jose, CA: National Center for Public Policy and Higher Education. Retrieved from http://www.highereducation.org/reports/pa_at/PolicyAlert_06-2011.pdf
Phillips, B. C., & Horowitz, J. E. (2013). Maximizing data use: A focus on the completion agenda. New Directions for Community Colleges, 17–25. doi:10.1002/cc.20077
Senie, K. C. (2014). Implementing transfer and articulation: A case study of community colleges and state universities. Johnson and Wales University, Rhode Island Retrieved from http://pqdtopen.proquest.com/doc/1548006529.html?FMT=AI
Shapiro, D., Dundar, A., Huie, F., Wakhungu, P.K., Yuan, X., Nathan, A., & Hwang, Y. (2017). A National view of student attainment rates by Race and Ethnicity – Fall 2010 Cohort (Signature Report No. 12b). Herndon, VA: National Student Clearinghouse Research Center.
Shapiro, D., Dundar, A., Wakhungu, P.K., Yuan, X., Nathan, A, & Hwang, Y. (2016a, September). Time to Degree: A National View of the Time Enrolled and Elapsed for Associate and Bachelor’s Degree Earners (Signature Report No. 11). Herndon, VA: National Student Clearinghouse Research Center.
Shapiro, D., Dundar, A., Wakhungu, P.K., Yuan, X., Nathan, A., & Hwang, Y. (2016b, November). Completing college: A National view of student attainment rates – Fall 2010 Cohort (Signature Report No. 12). Herndon, VA: National Student Clearinghouse Research Center.
Shapiro, D., Dundar, A., Wakhungu, P.K., Yuan, X., Nathan, A., & Hwang, Y. (2015). Completing college: A national view of student attainment rates – Fall 2009 Cohort (Signature Report No. 10). Herndon, VA: National Student Clearinghouse Research Center.
Shapiro, D., Dundar, A., Ziskin, M., Chiang, Y. Chen, J., Torres, V., & Harrell, A. (2013, August). Baccalaureate attainment: A national view of the postsecondary outcomes of students who transfer from two-year to four-year institutions (Signature Report No. 5). Herndon, VA: National Student Clearinghouse Research Center. Retrived from https://nscresearchcenter.org/pubproof/signaturereport5/
Townsend, B. K., & Wilson, K. B. (2009). The academic and social integration of persisting community college transfer students. Journal of College Student Retention: Research, Theory & Practice, 10(4), 405-423.
U.S. Department of Education. (2016) America’s college promise playbook: Expanding the promise of a college education and economic opportunity for all students. Washington, DC: U.S. Department of Education. Retrieved from https://www2.ed.gov/documents/press-releases/college-promise-playbook.pdf
U.S. Department of Education. (2017). Status and Trends in the Education of Racial and Ethnic Groups 2017. Washington, DC: National Center for Education Statistics, Institute of Education Sciences. From https://nces.ed.gov/pubs2017/2017051.pdf
Witham, K., Chase, M., Bensimon E. M., Hanson, D., & Longanecker, D. (2015) Moving the attainment agenda from policy to action, Change: The Magazine of Higher Learning, 47:4, 6-15, DOI:10.1080/00091383.2015.1053779
Appendix A: Methodological Notes
This report describes six-year college student success outcomes, focusing primarily on degree and certificate completion of a cohort of first-time-in-college degree-seeking students who started their postsecondary education at U.S. colleges and universities in the fall of 2011. The study follows this cohort for six years, through June 30, 2017. The results presented in the report center on student outcomes over the six-year span, including completion (i.e., receipt of any postsecondary credential by the end of the study period), persistence (i.e., having enrollment records at any postsecondary institution during the last year of the study period), and stop-out without completion (i.e., having no enrollment records at any postsecondary institution during the last year of the study period). The report mainly focuses on students’ first completion, with further distinctions drawn between completions awarded at the institution where a student first enrolled (his or her starting institution) and those awarded at an institution other than the starting institution. For students who started at a two-year public institution, this report also presents an overview of their completions at a four-year institution, either as a first completion (i.e., those who completed a four-year degree without having first earned a credential at a two-year institution) or as a subsequent degree after a first completion awarded in the two-year sector. In addition to results on degree and certificate completion rates by enrollment intensity, starting institution type, age, gender and, race and ethnicity, this report also includes results on completion across state lines and for students who started at multistate institutions.
National Coverage of the Data
The National Student Clearinghouse® (the Clearinghouse) is a unique and trusted source for higher education enrollment and degree verification. Since its creation in 1993, the participation of institutions nationwide in Clearinghouse data-collection programs has steadily increased. Currently, Clearinghouse data include more than 3,600 colleges and 96.8 percent of U.S. college enrollments. The Clearinghouse has a 24-year track record of providing automated student enrollment and degree verifications. Due to the Clearinghouse’s unique student-level record approach to data collection the Clearinghouse data provide opportunities for robust analysis not afforded by the more commonly used institution-level national databases.
The enrollment data used in this report provide an unduplicated headcount for the fall 2011 first-time-in-college student cohort. Clearinghouse data track enrollments nationally and are not limited by institutional and state boundaries. Moreover, because this database is comprised of student-level data, researchers can use it to link concurrent as well as consecutive enrollments of individual students at multiple institutions — a capability that distinguishes the Clearinghouse database from national databases built with institution-level data. For instance, in the National Center for Education Statistics (NCES) and the Integrated Postsecondary Education Data System (IPEDS) — one of the most widely used national data sets in postsecondary education research — concurrent enrollments remain unlinked and, therefore, are counted as representing separate individuals. There are nationally representative samples (e.g., National Education Longitudinal Study, NELS:88/2000; Beginning Postsecondary Students Longitudinal Study, Educational Longitudinal Study, ELS:02; etc.) that are based on student-level data. However, by definition samples have their limitations in terms of the currency of the data as well as its uses. For example, a nationally representative sample cannot be used to produce regional or state-level results. The Clearinghouse data do not have those limitations because of the frequency of the data collection and the near-census national coverage.
Cohort Identification, Data Cut, and Definitions
Changes to the Cohort Definition from Previous Reports
There were two major changes from prior Completions reports with regards to how the 2011 cohort of first-time degree-seeking students was defined: All-years look-back for prior enrollments and exclusion of current dual enrolled students.
- All-years look-back for prior enrollments: Data limitations in previous reports limited our ability to search for previous enrollments in order to establish first-time status, to within four years prior to the cohort year. Beginning with this year’s report, students with any prior non-dual enrollment, regardless of how far back in the Clearinghouse data that enrollment occurred, were removed from the cohort as non-first-time students.
- Exclusion of current dual enrolled students: Students who were 17 years old or younger during the fall 2011 semester were excluded from the dataset (i.e., current dual enrollment students). This was done to ensure that those who were simultaneously attending high school and post-secondary classes were not considered first-time college students.
A total of 620,320 students, or 27 percent of the students with a first enrollment in fall 2011, were excluded from the analysis, resulting in the final cohort N = 2,270,059.
Despite these changes in defining the cohort, longitudinal comparisons between the current results and results from past reports can be reliably conducted. Table A-1 below shows the cohort distributions and selected outcomes for the fall 2011 cohort under the new definitions, the fall 2011 cohort under the old definitions, and the fall 2010 cohort. These comparisons show that the new cohort definitions reduced the proportion of students older than 24 by over 2 percentage points, and increased the proportion of exclusively full-time students by 3 percentage points. In both cases, the direction of change due to the new definitions was the same as the direction of change from the 2010 to 2011 cohort using consistent (old) definitions.
The direction of the change in the overall completion rate and the rates at four-year public and private non-profit institutions was consistent with the changes from 2010 to 2011 under the old cohort definitions. However, the completion rates for students who started at two-year public institutions and four-year private for-profit institutions declined when we applied new definitions. Both would have increased from the 2010 results if we had kept the older definitions.
| 2011 Cohort with Current/New Definitions | 2011 Cohort with Old Definitions | 2010 Cohort with Old Definitions | |
| Cohort N | 2,270,059 | 2,890,379 | 2,913,590 |
| Sample Distributions | |||
| Age at First Entry | |||
| 20 and Younger | 76.79 | 76.02 | 73.81 |
| >20 – 24 | 9.31 | 7.29 | 7.34 |
| Older than 244 | 13.65 | 16.47 | 18.78 |
| Age Missing | 0.25 | 0.22 | 0.08 |
| Enrollment Intensity | |||
| Exclusively Full-Time | 45.71 | 42.65 | 39.53 |
| Exclusively Part-Time | 6.37 | 6.87 | 6.95 |
| Mixed Enrollment | 47.90 | 50.45 | 53.47 |
| Gender | |||
| Men | 46.31 | 44.81 | 45.08 |
| Women | 53.69 | 55.19 | 54.92 |
| Institution Type | |||
| Four-Year Public | 44.52 | 43.93 | 41.82 |
| Four-Year Private Nonprofit | 18.64 | 17.40 | 16.79 |
| Four-Year Private For-Profit | 2.79 | 3.01 | 3.91 |
| Two-Year Public | 33.79 | 35.44 | 37.32 |
| Two-Year Private Nonprofit | 0.09 | 0.08 | 0.08 |
| Two-Year Private For-Profit | 0.16 | 0.14 | 0.08 |
| Outcome: Six Year Total Completion Rates | |||
| All Students | 56.87 | 56.29 | 54.77 |
| Starting Institution Type | |||
| All Four-year Institutions | 66.78 | 65.17 | 64.03 |
| All Two-year Institutions | 37.71 | 40.28 | 39.37 |
| Four-Year Public | 64.71 | 63.18 | 62.43 |
| Four-Year Private Nonprofit | 76.05 | 74.68 | 73.86 |
| Four-Year Private For-Profit | 35.59 | 37.45 | 37.14 |
| Two-Year Public | 37.52 | 40.14 | 39.29 |
Most high school dual enrollments take place at a community college. Research also indicates that nearly half of former community college dual enrollment students enroll in the same or another community college immediately after high school, and 46 percent of those complete a college credential within five years (Fink, Jenkins, & Yanagiura, 2017). As a result, excluding current dual enrollment students from the fall 2011 starting cohort caused the completion rate of students who started in community colleges to decline.
4This suggests that previous reports overestimated the number of first-time adult students by including in the cohort adults who returned to college after stopping out more than four years. Such students could have made up about a third of the cohorts.
Change in Race and Ethnicity Data Coverage
The Research Center’s first completions report that included breakdowns by race and ethnicity (Signature Report 12b, April, 2016) was based on data collected from a random, nationally representative sample of institutions. In this report, increased reporting of race and ethnicity data allowed us to include nearly all institutions. However, the percentage of students with missing race and ethnicity data was 18 percent.
Former Dual Enrollment Students
The cohort used in this study includes former dual enrollment students: first-time college students in fall 2011 who had previously taken dual enrollment courses while still in high school. Students were identified as former dual enrollment students if their enrollment or degree record prior to fall 2011 was before the student turned 18 years old. Former dual enrollment students represent 17.2 percent of the overall fall 2011 cohort, 20 percent of the students who started in four-year public institutions, 15 percent of the students who started in two-year public institutions, and 16 percent of those who started in four-year private nonprofit institutions. Only 5 percent of the students who started in four-year private for-profit institutions had prior dual enrollments.
Enrollment Intensity
For this report, enrollment intensity is classified as exclusively full time throughout the study period, exclusively part time throughout the study period, or mixed enrollment (including both full-time and part-time enrollments) across all terms in which the student was enrolled (thereby, including stop‐outs) through the first completion or, for non-completers, through the entire study period. By establishing students’ enrollment intensity in this way, enrollments during summer terms (defined as terms with both the start date and the end date falling between May 1 and August 31 in any given year) and short terms (defined as terms lasting less than 21 days) were excluded from consideration.
For terms in which a student showed concurrent enrollment records (i.e., records that overlapped by 30 days or more), the two highest-intensity enrollments were combined. For example, a student concurrently enrolled half time at two institutions was categorized as enrolled full time for that term. For the purpose of determining intensity, we created one single enrollment record from a set of concurrent enrollment records. The enrollment status for the single enrollment record was defined as full-time if (1) the two highest-status enrollment records included at least one full-time enrollment, or one three quarter-time enrollment and one at least less than half time enrollment; or (2) the two highest-status enrollment records both reflected half-time enrollment. The enrollment status for the single enrollment record is defined as half-time, if the two highest-status enrollment records included some combination of half-time and less than half-time enrollments, but no full-time enrollment, and no more than one half-time enrollment.
Overall, for each term under consideration (i.e., all terms except summer terms and short terms up through the first completion, or, if no completion, throughout the entire study period), the “exclusively full-time” designation was assigned to students whose status was full-time for all terms enrolled. The “exclusively part-time” designation was assigned to students whose status for each term under consideration was three quarter-time, half-time or less than half-time.
The category of mixed enrollment was applied to students who showed a combination of full-time and part-time status among the terms under consideration. Finally, students whose status indicated withdrawal but no full-time or part-time enrollments were randomly assigned to an enrollment intensity category.
Age Group
The study focused on three age groups, namely, 20 years old or younger, between 21 and 24 years old, and older than 24 years old. The first group “20 years old or younger” is defined to approximate enrollment immediately after high school, while the second group (“over age 20 through 24”) is meant to represent students who delay entry into postsecondary education for a few years after finishing high school. The final category included adult learners, defined as those who were older than 24 when they began college. For all categories, we define age as of the end of the 2011 calendar year (December 31, 2011). Students with birthdates of December 31, 1991, or later were placed in the first category. Those with birthdates between December 31, 1987, and December 30, 1991, inclusive, were categorized in the second group (“over age 20 through 24)”). Students with birthdates before December 31, 1987, were placed in the final category (“over 24 years old”).
Concurrent Completion
For this report, we examined completion by first-time students at either two-year or four-year institutions. We defined completion as having obtained a degree or certificate at any institution within the six-year study period (i.e., by June 30, 2017). Clearinghouse data provide a unique headcount of U.S. college enrollments during each term, which allows for the tracking of individuals including those with concurrent completion. In preparing data for this report, a small number of individuals showed more than one completion awarded at multiple institutions on the same day. In these instances, a primary completion record was selected using decision rules specific to the sector of the student’s starting institution.
The first set of decision rules was applied to students with concurrent completions who started at a two-year institution:
- Concurrent Completions at Two Different Two–Year Institutions
- Same over different: Completions at the starting institution were selected over completions at other institutions.
- Random selection: If the first decision rule did not result in a single completion record being selected, then a completion record was selected at random.
- Concurrent Completions at One Two–Year Institution and One Four–Year Institution
- Two-year then four-year: The two-year degree completion was considered the first completion and the four-year degree completion was considered a subsequent completion.
- Concurrent Completions at Two or More Four-Year Institutions
- Random selection: If a student started at a two-year institution but later completed at two or more four-year institutions concurrently, then a completion record was selected at random.
The second set of decision rules was applied to students who started at four-year institutions and later showed concurrent completion records:
- Same over different: Completions at the starting institution were selected over completions at other institutions.
- Four-year over two-year: If the first decision rule did not result in the selection of a single completion record, then completions at four-year institutions were selected over those at two-year institutions.
- Random selection: If neither of the first two decision rules resulted in the selection of a single completion record, then a completion record was selected at random.
Imputation of Values for Gender
The Clearinghouse’s coverage of student gender has increased dramatically for enrollments occurring in recent years. However, imputation of gender for the majority of enrollment records is still necessary in order to use the data for research studies using older cohorts. To meet this need, the Research Center developed an imputation process based on first names. Previously submitted name‐gender pairs throughout the Clearinghouse database are used to determine the probability of any first name being associated with either gender. To increase the accuracy of the imputation process, the Research Center also draws on name‐gender data from the Social Security Administration (SSA) and the U.S. Census Bureau.
Because the Clearinghouse collects transactional data, its data contain many more unique first names than the other sources. International students may also contribute to the large variety of first names submitted to the Clearinghouse. The imputation used only those pairs in which the name occurred in at least two instances and was associated with a single gender in at least 95 percent of the instances. The SSA and Census data sets were used to ensure that name‐gender pairs were consistent across every data set in which they occurred and to enhance the imputation process by contributing name‐gender pairs that did not occur in the Clearinghouse data.
Institutions reported student gender to the Clearinghouse for approximately two-thirds of all students included in this report. The imputation process that yielded additional gender codes produced a total gender coverage rate of 94 percent.
Imputation of Missing Data on Graduation Records
The National Student Clearinghouse collects graduation information from its participating institutions via two data reporting services: Enrollment Reporting and DegreeVerify. Enrollment Reporting has higher data coverage rates, but includes only basic completion information such as a graduation indicator and date. For the fall 2011 cohort, Enrollment Reporting covered 93 percent of all the students in Title IV degree-granting institutions listed in IPEDS (including 99 percent of the students in public institutions, 92 percent in private nonprofit institutions, and 53 percent in private for-profit institutions). DegreeVerify includes enhanced information on completions, including degree title, major, level, and CIP code, but covered only 84 percent of enrollments in 2011. Institutions may participate either in Enrollment Reporting alone or in both services. Completions data for this report included information drawn from either service. An analysis conducted by the Clearinghouse on the 2011 cohort found that graduation data for the institutions that participated in DegreeVerify were more complete, for some of the years covered in this study, than those for institutions that participated only in Enrollment Reporting, biasing completion rates slightly downwards for institutional sectors with lower participation rates in DegreeVerify. In general, the coverage for the degree completion data for public institutions has been near complete in the Clearinghouse data, but slightly lower for private, nonprofit, and private for-profit institutions.
In order to correct for this bias, the Research Center conducted a randomized imputation procedure for missing graduation data among students at non-DegreeVerify institutions who were no longer enrolled, but for whom outcome data were missing (that is, for whom the institution had reported neither a graduation nor a withdrawal status in their Enrollment Reporting). This involved comparing the Enrollment Reporting and DegreeVerify records for institutions that participated in both services and estimating, for each institution type, the average percentage of students with missing outcomes in the enrollment data who had a reported graduation in the DegreeVerify data. We further specified these underreporting rates by taking into account student age and the academic year. We then used random assignment of graduation outcomes to students with missing data at the institutions that did not participate in DegreeVerify in order to match each institution’s underreporting rate for each student age group and for every year of the study to the average rate for similar students at institutions of the same type that did participate in DegreeVerify.
This imputation was performed only for students with missing outcomes data at institutions that did not participate in DegreeVerify. It is based on the typical underreporting of graduation outcomes from similar institutions that participate in both Enrollment Reporting and DegreeVerify. The table below shows, for each institution type, the percentage of the starting cohort for whom graduation data were imputed:
| Institution Type |
Percentage of the Starting Cohort With an Imputed Completion |
| Two-Year Private For-Profit | 0.28% |
| Two-Year Private Nonprofit | 0.89% |
| Two-Year Public | 0.24% |
| Four-Year Private For-Profit | 0.15% |
| Four-Year Private Nonprofit | 0.33% |
| Four-Year Public | 0.16% |
| Total | 0.22% |
Imputation of Missing Data through Weighting by State and Institution Type
The institutions participating in the Clearinghouse Enrollment Reporting service (i.e., providing the data coverage) is not 100 percent of all institutions for any individual year. Therefore, in order to account for the possibility of not capturing a student’s enrollment outcome due to non-coverage of Clearinghouse data, a statistical weighting procedure was applied using the 2016 coverage rate for the sector, control, and state of the institution where a student was last enrolled. The last enrollment record was defined based on the first completion (for completers) or the last enrollment record either before stop-out (for students who had no enrollment records during the last year of the study) or at the end of the study period (for persisters). For students who completed a degree at the starting institution or were still enrolled at the starting institution at the end of the study period, a weight=1 was applied. For all other students, two weights were created and applied:
For students who either completed a degree at, or were still enrolled at, a different institution at the end of the study period, a “transfer” weight was applied. The transfer weight used was an over-weight based on the coverage of the sector, control, and state of the institution in which the student was last enrolled, as calculated by the formula provided below:
For students who stopped out by the end of the study period, a “missing” weight was applied. The missing weight used was an under-weight based on the coverage of the sector, control, and state of the institution in which the student was last enrolled, as calculated by the formula provided below:
Data Limitations
The data limitations in this report center mainly on the data coverage, the methods used for cohort identification, and the definition of key constructs, as outlined above.
The representation of private for-profit institutions in the StudentTracker data is lower than that of other institution types, with 63 percent coverage for four-year private for-profit institutions in fall 2011 compared to 93 percent and 99 percent respectively for four-year private nonprofit institutions and four-year public institutions. In order to correct for these coverage gaps, data were weighted as explained above.
Data limitations resulting from the cohort identification methods used in preparing this report also should be noted. Because the Clearinghouse data on designations for class year are incomplete, the researchers identified first-time undergraduate students via two indirect measures:
- No previous college enrollments recorded in StudentTracker, and
- No previous degree awarded in the Clearinghouse’s historical DegreeVerify database.
Given these selection criteria, the sample for this report may include students who, while first-time students, were not considered “freshmen” by their institutions (for example, they may have transferred in more than 30 Advanced Placement (AP), International Baccalaureate (IB), or dual enrollment credits). Moreover, because of inconsistencies in the historical depth of DegreeVerify database records, it is possible that a small number of graduate students are also included in the study cohort.
Finally, although Clearinghouse data contain some demographic information on students, historical coverage rates for the demographic data elements are uneven. Consequently, results on gender are based partially on imputed values, as described above and more than one in ten students in the cohort had the race/ethnicity value missing. No imputation was attempted for missing race/ethnicity data.