
Stay Informed with the Latest Enrollment Information

National Student Clearinghouse Research Center’s Regular Updates on Higher Education Enrollment
October 23, 2024
*NOTE ON THIS REPORT: The National Student Clearinghouse Research Center has identified a methodological error in its preliminary Stay Informed enrollment report, specifically impacting freshman enrollment data. Consequently, this data has been removed from this report. For further information, please refer to the statement from Doug Shapiro, Executive Director of the Clearinghouse Research Center. Final freshman enrollment data will be available in the Current Term Enrollment Estimates report scheduled for release on January 23, 2025.
Amid various challenges that are shaping the higher education landscape, such as a shrinking enrollment pipeline of traditional-age students and the continued rapid pace of technological change, colleges and universities are pressed to re-evaluate their long- and short-term strategies, particularly those related to enrollment management and recruiting and supporting students from a broad spectrum of backgrounds and life experiences.
The Stay Informed with the Latest Enrollment Information series was first created in the summer of 2020 to help educational leaders and policymakers understand the impact of the COVID-19 pandemic on postsecondary enrollments. The report’s dashboards continue to be updated within the first two months of every fall term to provide preliminary but timely enrollment updates to the education community using the latest enrollment data available through the Clearinghouse. The estimates provided in this report are preliminary and subject to revision. The Current Term Enrollment Estimates report, released every January, provides final enrollment estimates for the fall term.
The report’s dashboards feature national and state-level data on annual enrollment changes across the three most recent years, with additional levels of disaggregation by student demographics (including a measure of pre-college neighborhood income), field of major, and institutional characteristics. The fall 2024 edition includes a new indicator that enables dashboard users to look at enrollment trends across institutions by the share of the undergraduate population that receives Pell Grants.
First Look at Fall 2024 Highlights
(as of September 26, 2024)
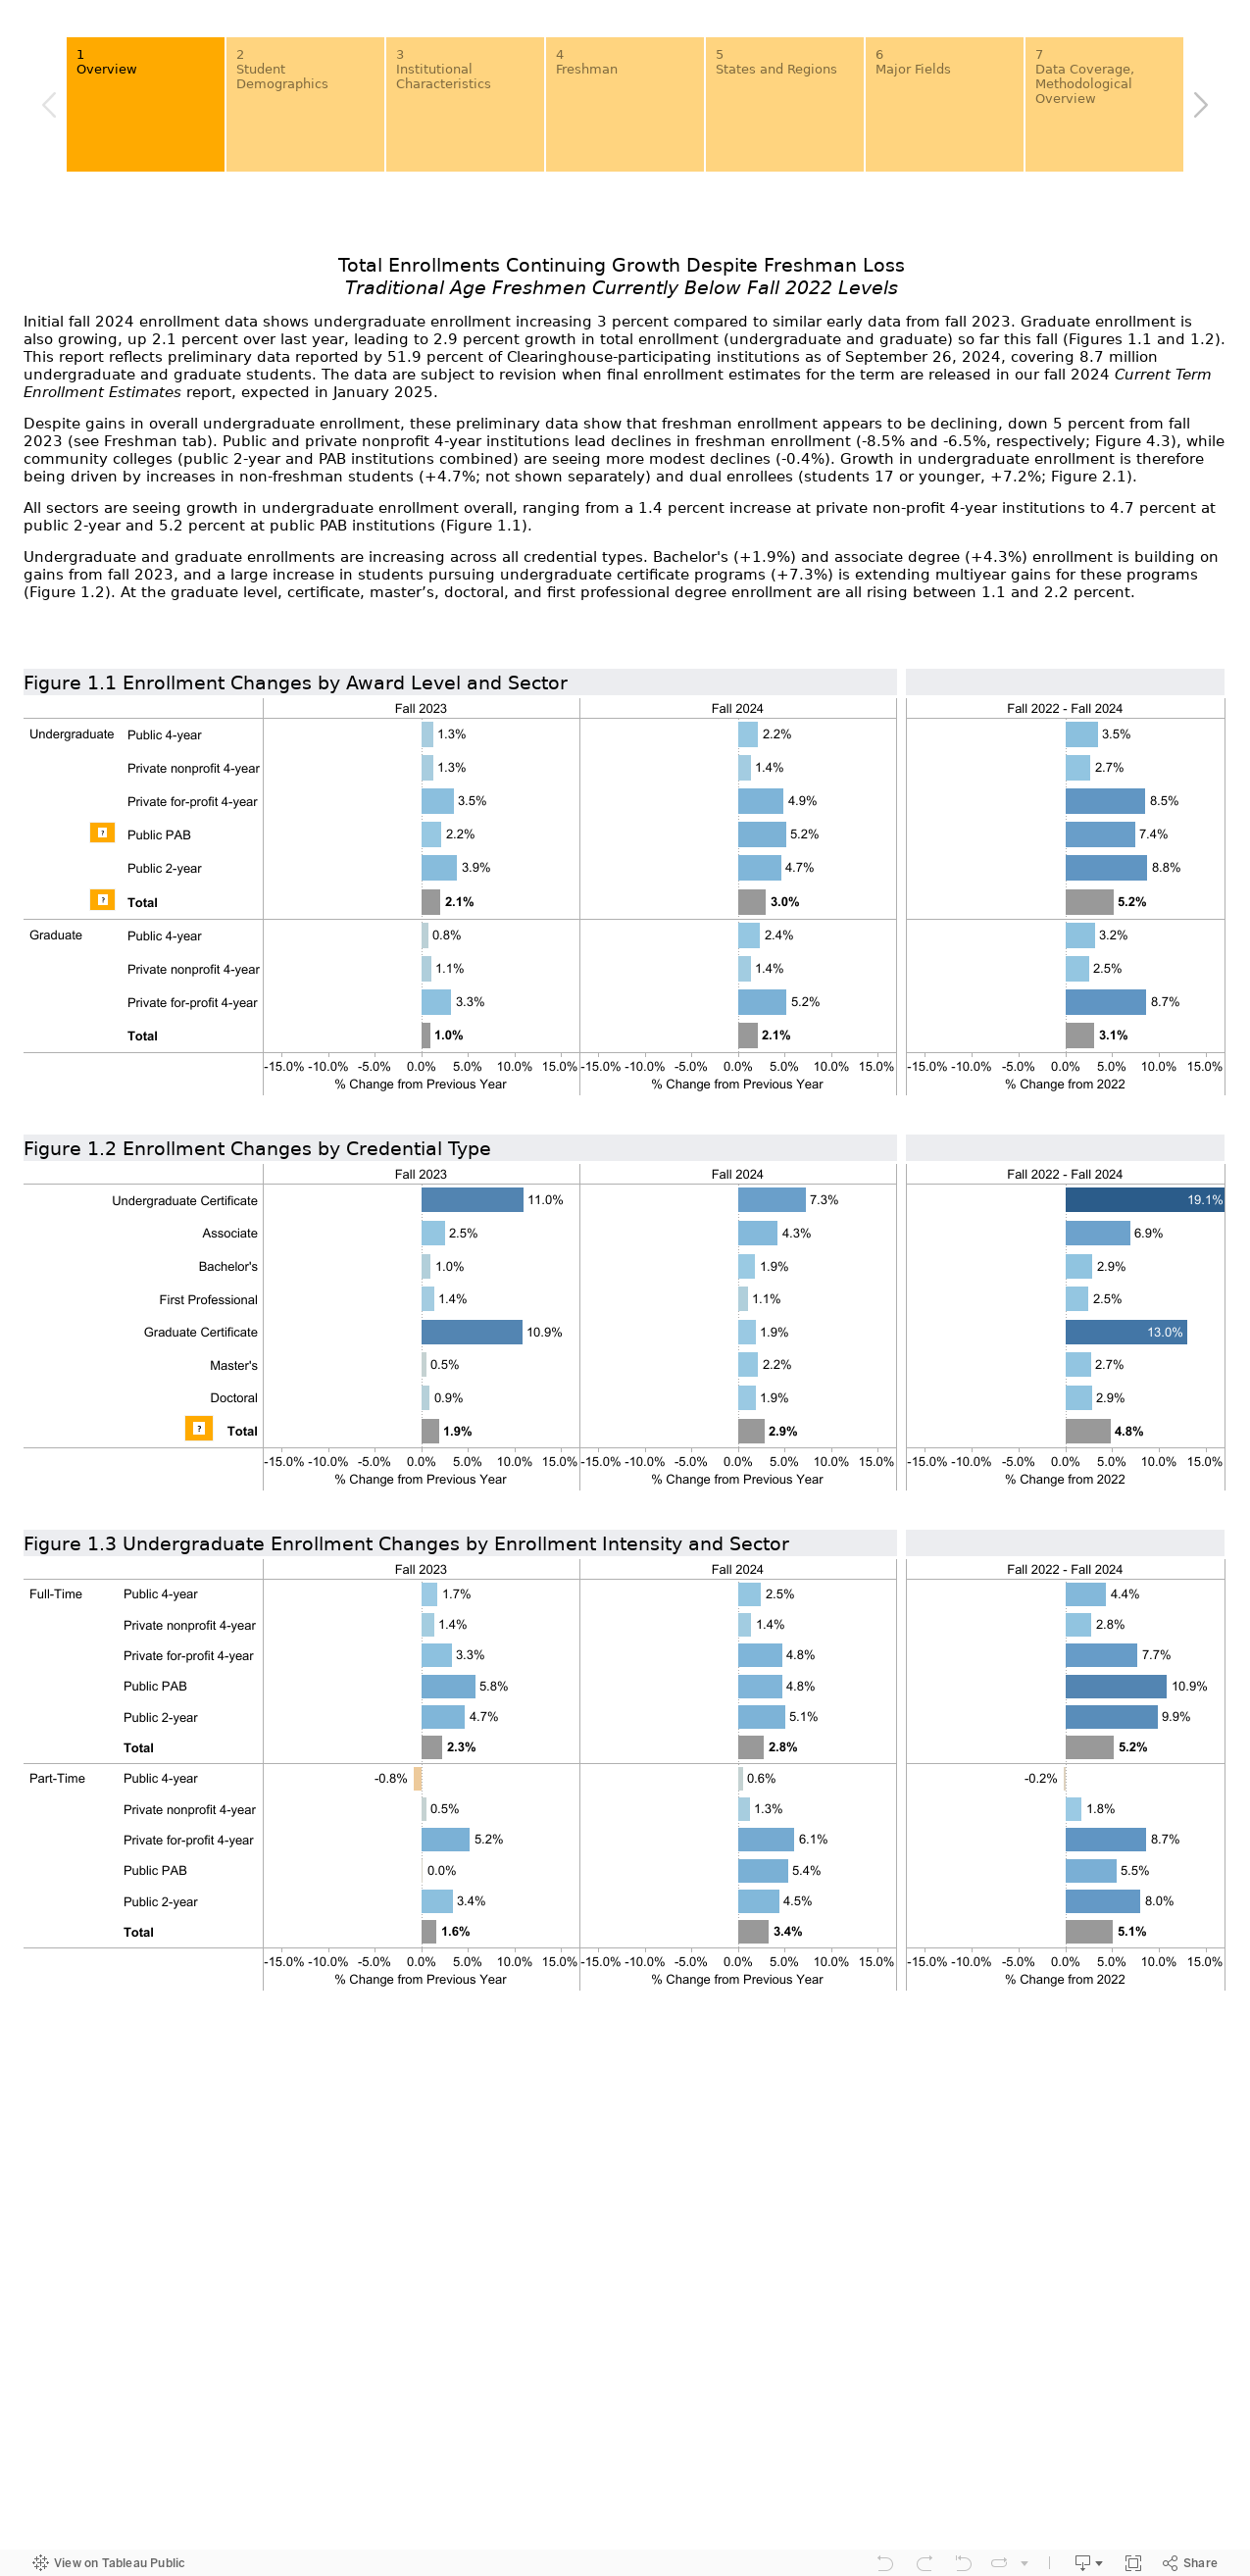
- Preliminary data for fall 2024 shows undergraduate enrollment increasing 3 percent. All sectors are seeing growth in the number of undergraduates this fall.
- Bachelor’s (+1.9%) and associate degree (+4.3%) programs are seeing enrollment gains this fall. The number of students pursuing shorter-term credentials is continuing to grow rapidly, with enrollment in undergraduate certificate programs increasing 7.3 percent.
- Undergraduate and graduate enrollments for Hispanic, Black, Asian, and Multiracial students are seeing strong growth this fall. Undergraduate White students, on the other hand, are continuing to see enrollment declines (-0.6%).
- Traditional-aged undergraduate students from neighborhoods of all income levels are seeing enrollment increases. Students from the lowest neighborhood income quintiles are seeing the highest gains (+4.0%) and those from the highest quintile neighborhoods are seeing the smallest the smallest (+1.8%).
Navigate details for different institutions and student groups using the tabs at the top of the dashboard.
Past Reports
SUMMER 2020:
FALL 2020:
First Look Fall 2020 (As of Sept 10)
Current Term Enrollment Estimates (CTEE) Fall 2020 Final Report with Enrollment Numbers
SPRING 2021:
CTEE Spring 2021 Final Report with Enrollment Numbers
FALL 2021:
First Look Fall 2021 (As of Sept 23)
CTEE Fall 2021 Final Report with Enrollment Numbers
SPRING 2022:
CTEE Spring 2022 Final with Enrollment Numbers
FALL 2022:
First Look Fall 2022 (As of Sept 29)
CTEE Fall 2022 with Enrollment Numbers
SPRING 2023:
First Look Spring 2023 (As of Feb 23)
CTEE Spring 2023 with Enrollment Numbers
FALL 2023:
First Look Fall 2023 (As of Sept 29)
CTEE Fall 2023 with Enrollment Numbers
SPRING 2024:
CTEE Spring 2024 with Enrollment Numbers
FALL 2024: