

Completing College – National by Race and Ethnicity – 2017
This supplement to our Signature Report 12 provides six-year completion rates disaggregated by race and ethnicity for students who began postsecondary education in fall 2010.
Suggested Citation: Shapiro, D., Dundar, A., Huie, F., Wakhungu, P., Yuan, X., Nathan, A & Hwang, Y., A. (2017, April). Completing College: A National View of Student Attainment Rates by Race and Ethnicity – Fall 2010 Cohort (Signature Report No. 12b). Herndon, VA: National Student Clearinghouse Research Center.
About This Report
AUTHORS
National Student Clearinghouse Research Center
- Doug Shapiro
- Afet Dundar
- Faye Huie
Project on Academic Success, Indiana University
- Phoebe Khasiala Wakhungu
- Xin Yuan
- Angel Nathan
- Youngsik Hwang
SPONSOR
This report was supported by a grant from the Lumina Foundation. Lumina Foundation, an Indianapolis-based private foundation, is committed to enrolling and graduating more students from college — especially 21st century students: low-income students, students of color, first-generation students and adult learners. Lumina’s goal is to increase the percentage of Americans who hold high-quality degrees and credentials to 60 percent by 2025. Lumina pursues this goal in three ways: by identifying and supporting effective practice, through public policy advocacy, and by using our communications and convening power to build public will for change. For more information, log on to www.luminafoundation.org.
Among the study’s findings:
- Among students who started in four-year public institutions, black students had the lowest six-year completion rate (45.9 percent). The completion rate of Hispanic students was almost 10 percentage points higher than that of black students (55.0 percent). Over two-thirds of white and Asian students completed a degree within the same period (67.2 percent and 71.7 percent, respectively). Nationally, 62.4 percent of students finished a degree or certificate within six years.
- Nationally, 54.8 percent of students who started in any type of college or university in Fall 2010 completed a degree or certificate within six years. When examined by race and ethnicity, Asian and white students had a much higher completion rate (63.2 percent and 62.0 percent, respectively) than Hispanic and black students (45.8 percent and 38.0 percent, respectively). These rates include students who graduated after a transfer. They also count both full time and part time students.
- Among students who started in four-year public institutions, black men had the lowest completion rate (40.0 percent) and the highest stop-out rate (41.1 percent). Asian women had the highest completion rate (75.7 percent) and the lowest stop-out rate (11.2 percent).
- The overall completion rate for students who started in two-year public institutions was higher for white and Asian students (45.1 percent and 43.8 percent, respectively) than Hispanic and black students (33 percent and 25.8 percent, respectively). Nationally, the rate was 39.2 percent, as the Research Center reported in December 2016.
- The completion rate at four-year institutions for students who started at a community college (with or without receiving an associate’s degree first) was dramatically different for students of different racial and ethnic groups. While almost one in four Asian students and one in five white students had completed this transfer pathway by the end of the six-year study period, just one in 10 Hispanic students and about one in 12 black students did.
- The completion gaps between racial groups tend to shrink as students grow older. Among traditional-age students, there was a 24-percentage point gap in the completion rates of black and white students (42.7 percent and 66.8 percent, respectively) and 17.5-percentage points gap between Hispanic and white students (49.3 percent and 66.8 percent, respectively). Among adult learners (those who started college at 25 or older), however, the gap was 12.3 percentage points (29.7 percent and 42.0 percent, respectively) between black and white students and just 9.1 percentage points between Hispanic and white students (32.9 percent and 42.0 percent, respectively).
Introduction
This supplement to our Signature Report 12 (Shapiro et al., 2016) provides six-year completion rates, including degree and certificate completion, disaggregated by race and ethnicity for students who began postsecondary education in fall 2010. The fall 2010 cohort was also the focus of the Signature Report 12, the national report on college completions, released in December 2016, and the state-level report, released in March 2017. Unlike those reports, which relied on full populations from the National Student Clearinghouse data, the data used in this supplement was limited to a sample of schools selected specifically for race and ethnicity analyses.
The National Student Clearinghouse Research Center worked with the National Opinion Research Center (NORC) at the University of Chicago to design a representative sample of schools from which to conduct college success studies using student race and ethnicity data. To create the sample, a stratified survey design was used to enable results to be reported for three groups of students, those starting at:
- Four-year public institutions
- Two-year public institutions
- All other postsecondary institutions
In the national report, we found that just over half of all students (54.8 percent) starting in any type of postsecondary institution complete a degree or certificate within six years (Shapiro et al., 2016). There is a consensus in the literature that attainment barriers exist for members of traditionally underrepresented minority groups (Engle & Theokas, 2010; Jackson & Reynolds 2013; Oseguera, 2005; Sólorzano, Villalpando & Oseguera 2005). In fact, two recent national studies extensively discuss these achievement gaps (U.S. Department of Education, 2016; Nichols & Evans-Bell, 2016). While these racial and ethnic achievement gaps have been well-documented in previous research, there are a number of unique contributions of this report:
- The completion rate in this report includes students who completed a degree or certificate at a different institution from where they started, answering the unaddressed hypothesis that perhaps some racial and ethnic groups of students, with otherwise lower same-institution graduation rates, might have higher transfer-completion rates, thereby partially closing the gap in total completion rates.
-
The report includes students who started part-time, covering important enrollment pathways that may be disproportionately pursued by some racial and ethnic groups, and which standard metrics of first-time full-time students only may miss.
-
We use a more recent student cohort, potentially capturing the latest available post-recession changes in student enrollment behaviors, as well as recent institution-based improvements in academic student support and retention, and, perhaps, broader changes in the level of racial equity in society.
- We use detailed student-level data, not institution-level surveys, to allow more granular reporting on the interactions of race and ethnicity with age, gender, enrollment intensity (exclusively full-time, exclusively part-time, or mixed enrollment), and starting institution type (two- or four-year institution).
In order to provide to the education community the full benefit of the latest student data available, the Clearinghouse Research Center will update these national statistics annually going forward.
Carnevale and Stohl (2013) found that since mid-90s “…82 percent of new white enrollments have gone to the 468 most selective colleges, while 72 percent of new Hispanic enrollment and 68 percent of new African-American enrollment have gone to the two-year and four-year open-access schools” (p. 9). Furthermore, Bowen, Chingos and McPhenson (2009) identified an “undermatching” phenomenon, where well-qualified minority students from less affluent households would attend less selective four-and two-year institutions. Prior research also established that different student attributes, such as high school GPA, college entry exam (SAT or ACT) composite scores, parental education, and socioeconomic status (SES), contribute to the bachelor’s degree completion disparities among racial and ethnic groups (Choy, 2001). Institutional characteristics can also play a large role in racial completion disparities. Factors such as selectivity, campus climate, and availability of financial aid can serve as either completion barriers or pathways. Overall, research results highlight the complex connection between socio-economic status, college enrollment and degree attainment, particularly among minority populations (Frehill, 2000; Jackson & Reynolds, 2013; Lundy, 2010).
Given previous findings that public colleges and universities enroll the largest percentage (almost 80 percent) of college students (Shapiro et al, 2016), and that a high proportion of minority students attend public institutions, there is a greater pressure on this sector to improve in order to make an impact on minority student completions (Santos & Haycock, 2016). For this purpose, the report presents the results not only for all first-time-in college students in fall 2010, but also separately for those who started in four- and two-year public institutions.
College completion has important benefits to individuals and the society, including job satisfaction, civic engagement, individual labor market access, and, ultimately, the nation’s economic growth and global competitiveness (DeAngelo et al., 2011). Currently, the inequalities in postsecondary college completion rates highlight the need for higher education stakeholders to design initiatives aimed at increasing participation and ameliorating racial disparities.
Annual updates using the latest cohorts of student-level data that will follow this introductory report will enable institutions, public policymakers, and the general public interested in these important outcomes to follow the progress and changes in the completion gaps.
Results
Cohort Description
Figure 1 shows the sample fall 2010 cohort (Weighted N= 2,823,678) disaggregated by race and ethnicity. The largest proportion (57.8 percent) were white students, followed by black (11.9 percent), Hispanic (11.4), and Asian (4.8 percent) students. These four groups of students represented about 86% of the total fall 2010 cohort (Figure 1). Regardless of racial or ethnic background, women accounted for more than half of the sample (Figure 2). In terms of age, most students were traditional age students (i.e., 20 years old or younger) when they first started their postsecondary studies (Figure 3). However, approximately one in five black (21.7 percent) students were adult learners (i.e., older than 24 years old), nearly double the proportion of adult learners among Asian (11.2 percent), Hispanic (12.3 percent), and white (13.4 percent) students. When disaggregated by institutional type, Asian (45.1 percent) and white (45.9 percent) students were more likely to start at a four-year public institution than black (36.6 percent) or Hispanic (36.3 percent) students, whereas black (48.5 percent) and Hispanic (50.8 percent) students were more likely to start at a two-year pubic institution than white (35.6 percent) and Asian (37.8 percent) students (Figure 4). In terms of enrollment intensity, the most common enrollment intensity was mixed enrollment (a combination of full- and part-time enrollment over six years) across all races (Asian 57.1 percent; black 60.2 percent; Hispanic 62.6 percent; and white 50.9 percent), followed by exclusively full-time enrollment and exclusively part-time enrollment (Figure 5).
Figure 1. Fall 2010 Cohort by Race and Ethnicity*
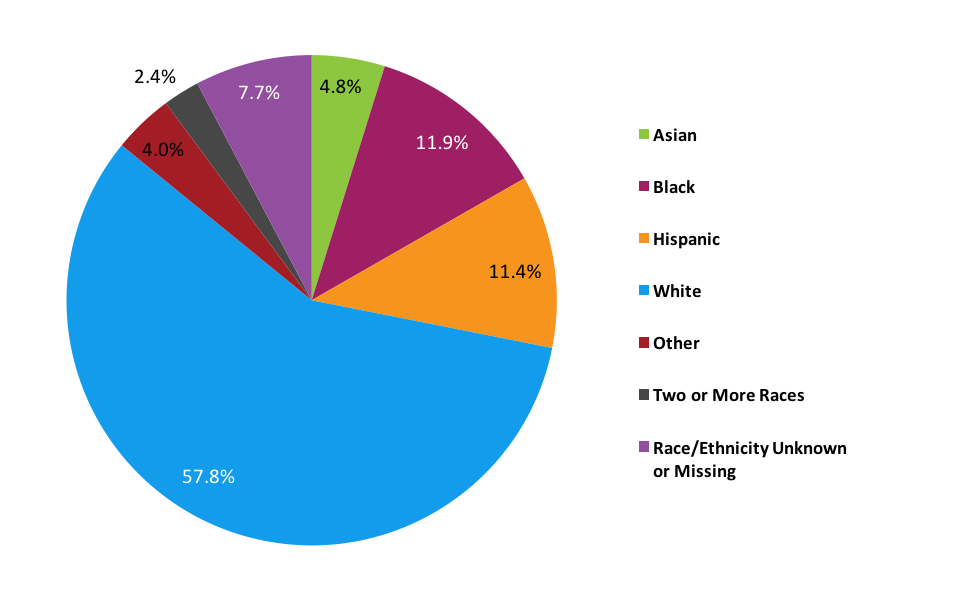
*This figure is based on data shown in Appendix B, Table 1.
Figure 2. Fall 2010 Cohort by Race and Ethnicity and Gender*
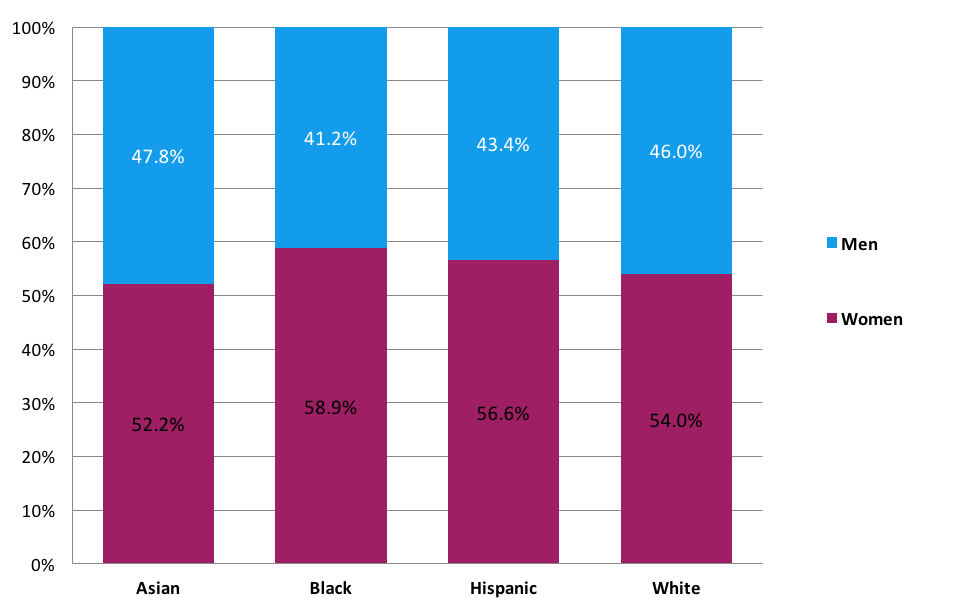
*This figure is based on data shown in Appendix B, Table 2.
Figure 3. Fall 2010 Cohort by Race and Ethnicity and Age at First Entry*
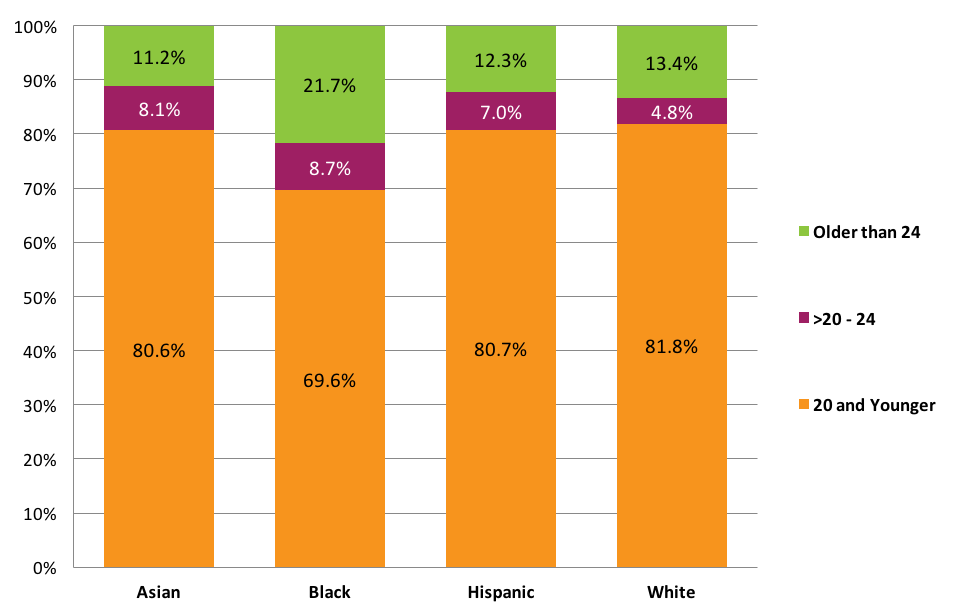
*This figure is based on data shown in Appendix B, Table 3.
Figure 4. Fall 2010 Cohort by Race and Ethnicity and Starting Institution Type*
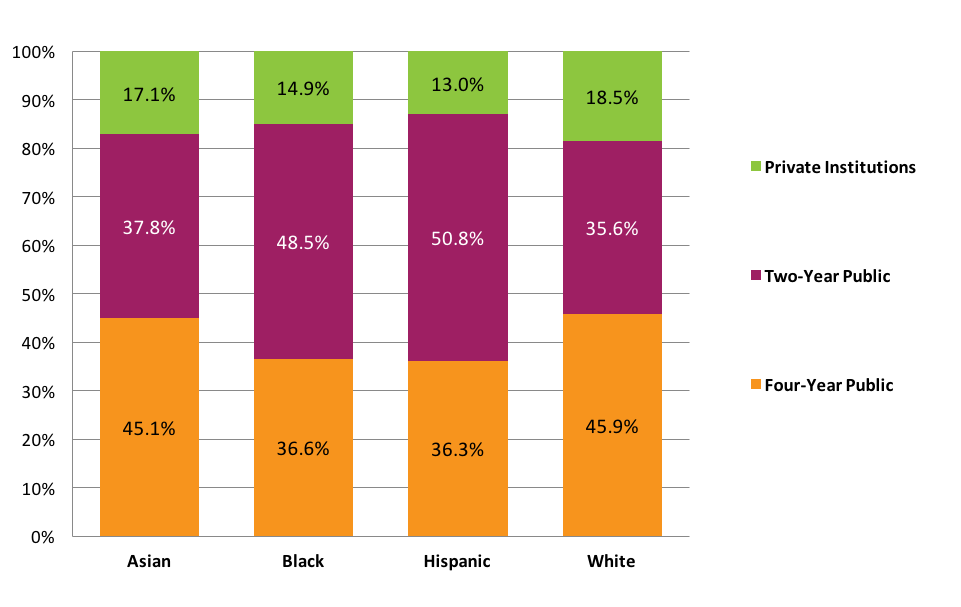
*This figure is based on data shown in Appendix B, Table 5.
Figure 5. Fall 2010 Cohort by Race and Ethnicity and Enrollment Intensity*
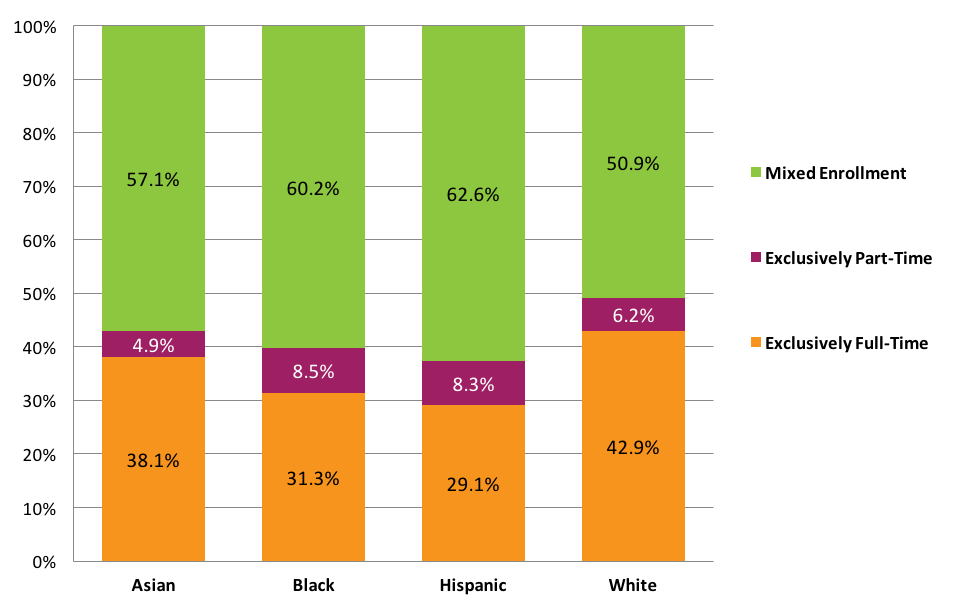
*This figure is based on data shown in Appendix B, Table 6.
Overall Completion Rates by Race and Ethnicity
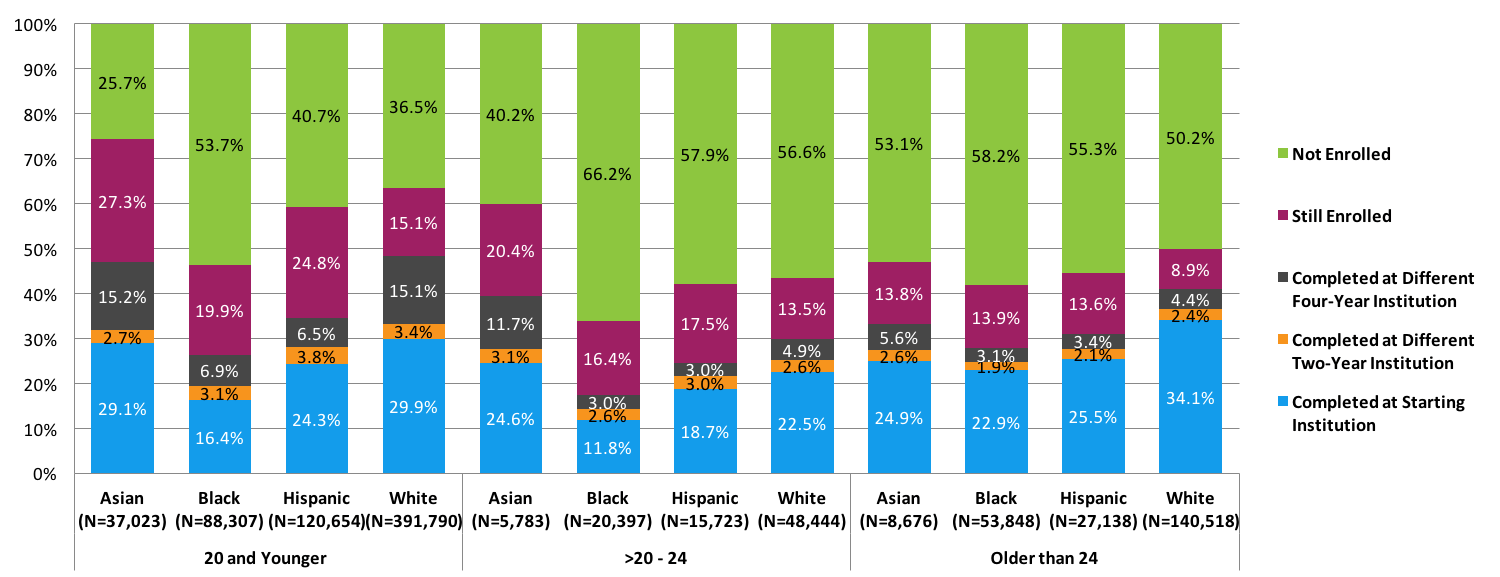
Figures 6 through 9 depict the six-year certificate and degree completion rates of students broken out by race and ethnicity and other demographic variables. Overall, Asian and white students had the highest completion rates (63.2 percent and 62.0 percent, respectively) followed by Hispanic (45.8 percent) and black (38.0 percent) students (Figure 6). A larger proportion of black students (44.6 percent) were not enrolled at the end of the study period (had no degree or certificate and no enrollment record in the sixth year), compared to Hispanic (35.0 percent), white (26.9 percent), and Asian (20.0 percent) students. In terms of gender differences, female students graduated at a higher rate than male students and male students were more likely to stop out than female students, regardless of race and ethnicity (Figure 7). Black men, overall, had the lowest completion rate (33.5 percent). In terms of age differences (Figure 8), traditional-age students had higher completion rates than delayed entry students and adult learners, regardless of race and ethnicity. The race and ethnicity completion rate patterns were consistent within each age group.
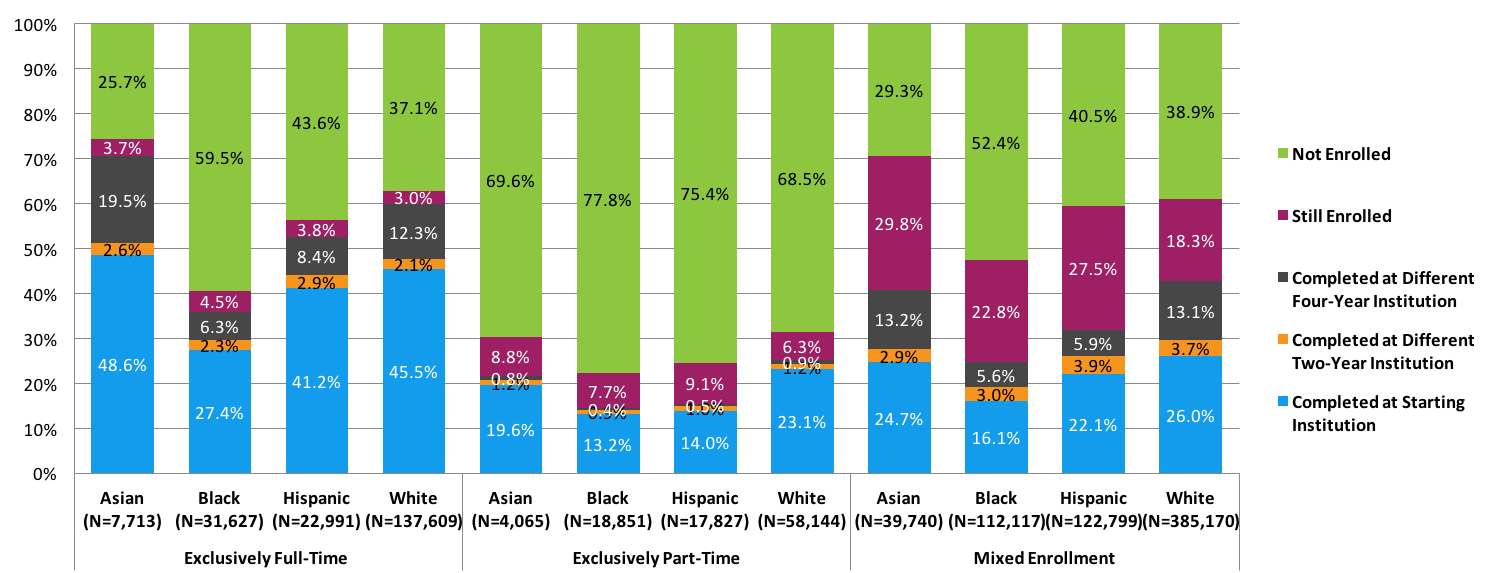
This pattern is reversed when looking at the not enrolled categories, where within each age group, black students were most likely not to be enrolled, followed by Hispanic, white, and Asian students. Among black, Hispanic, and white students, adult learners showed higher completion rates than delayed entry students. The completion rates by enrollment intensity show that exclusively full-time students displayed the highest completion rates and exclusively part-time students showed the highest proportion of students who dropped out, regardless of race and ethnicity (Figure 9).
Figure 6. Six-Year Outcomes by Race and Ethnicity (N=2,824,569)*
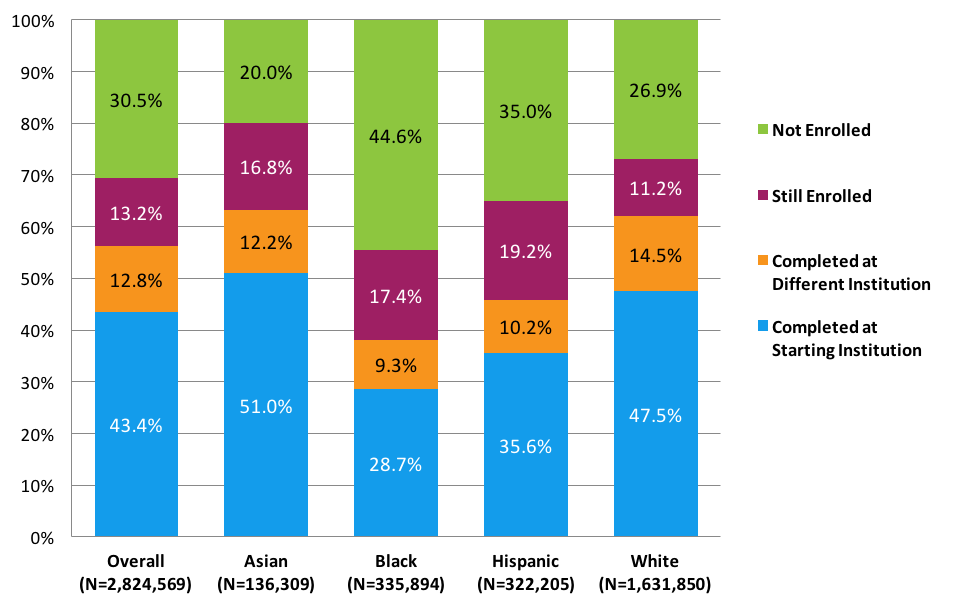
*This figure is based on data shown in Appendix B, Table 8.
Figure 7. Six-Year Outcomes by Race and Ethnicity and Gender (N=2,315,562)*
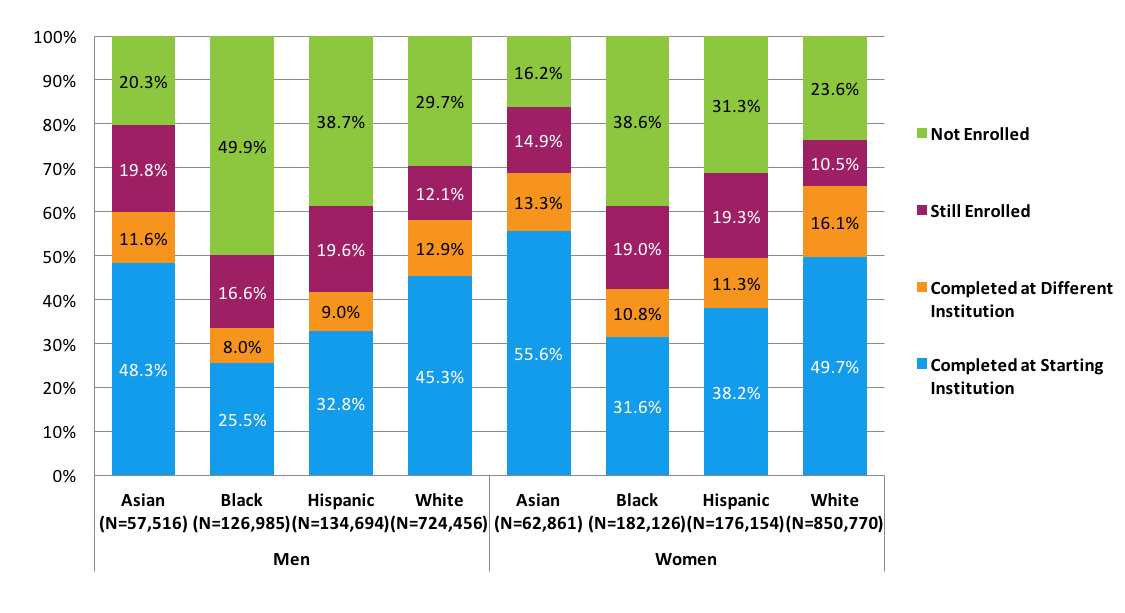
Note: Students with missing gender data were excluded from the above figure.
*This figure is based on data shown in Appendix B, Table 9.
Figure 8. Six-Year Outcomes by Race and Ethnicity and Age at First Entry (N=2,425,594)*
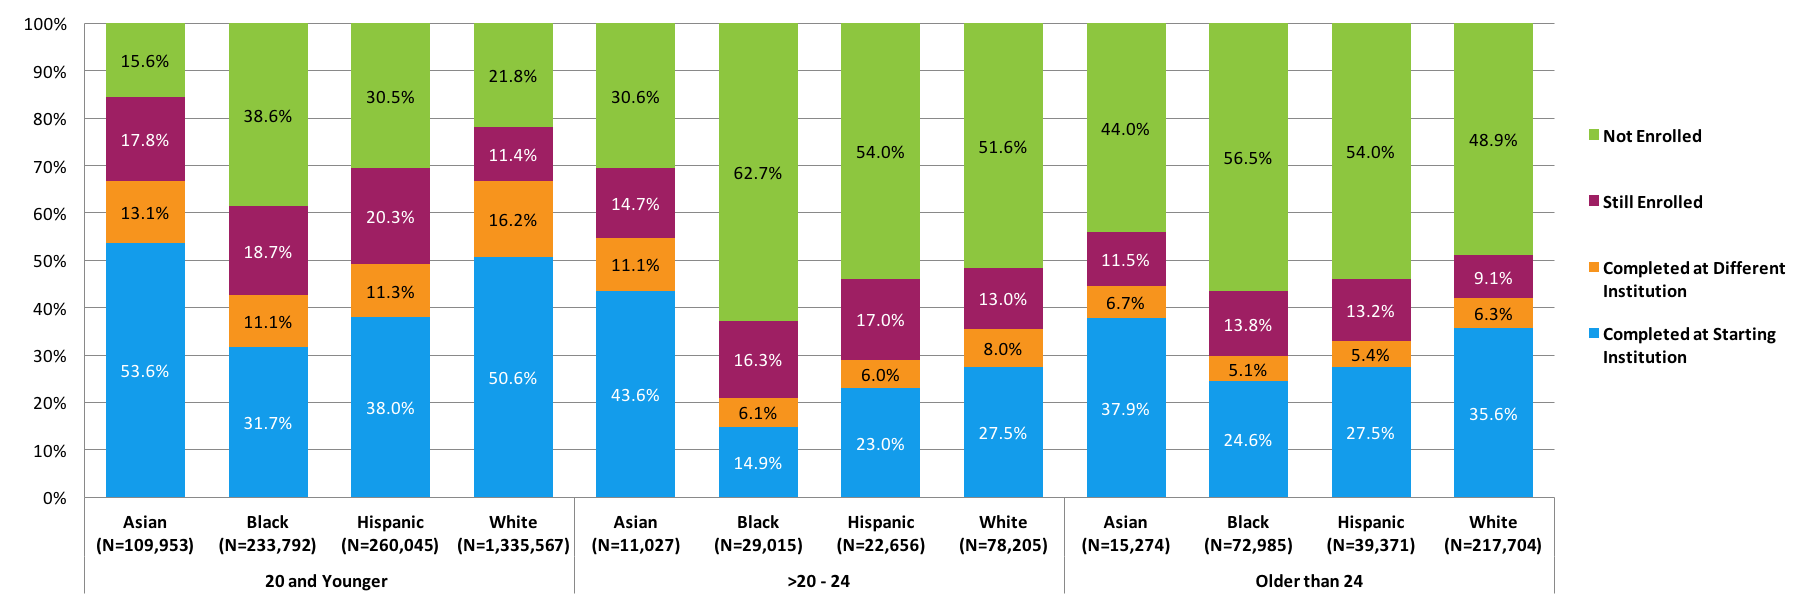
Note: Students with missing age data were excluded from the above figure.
*This figure is based on data shown in Appendix B, Table 10.
Figure 9. Six-Year Outcomes by Race and Ethnicity and Enrollment Intensity (N=2,426,077)*
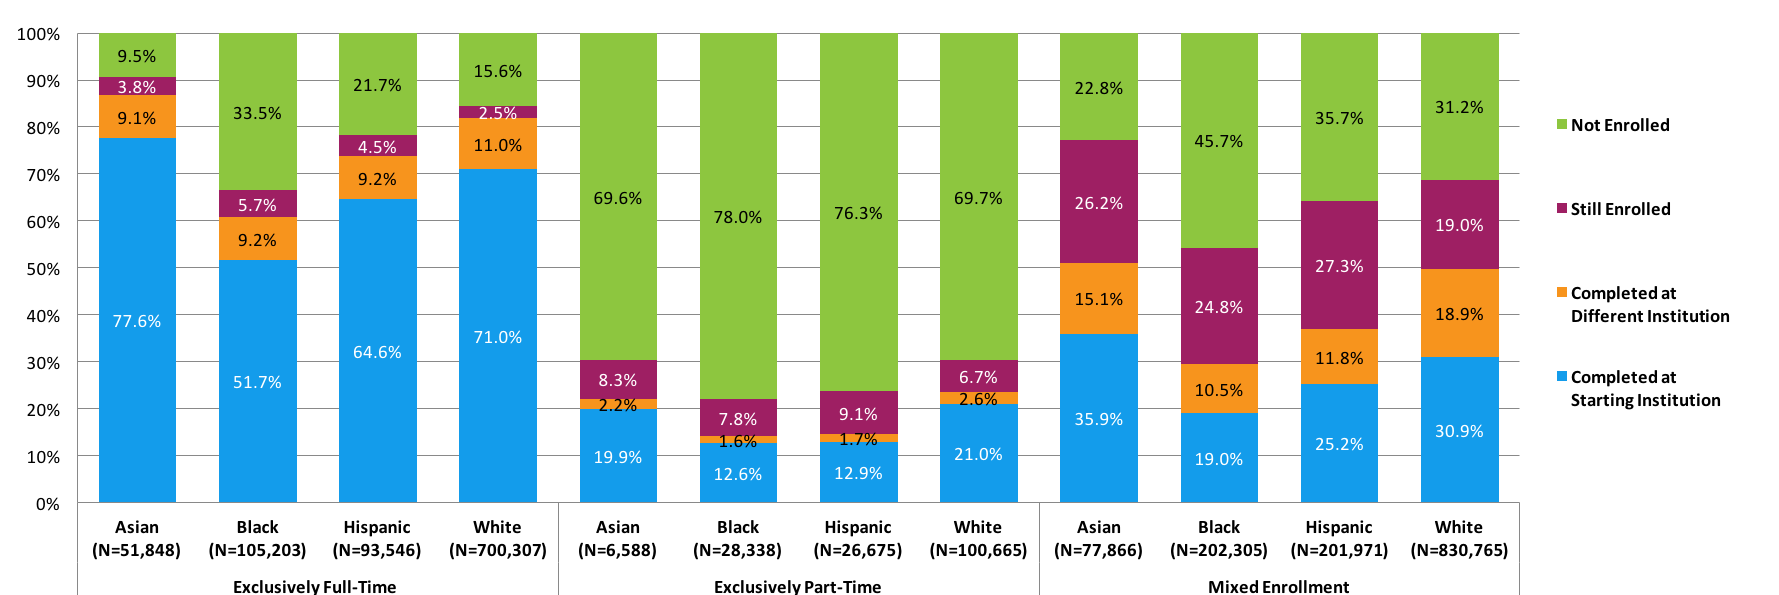
*This figure is based on data shown in Appendix B, Table 11.
Completion Patterns by Race and Ethnicity for Students Who Started at Four-Year Public Institutions
Figures 10 through 13 present the six‐year outcomes of students who started at four‐year public institutions. Asian students had the highest completion rate (71.7 percent), followed by white (67.2 percent), Hispanic (54.9 percent), and black (45.9 percent) students. Large differences in completion rates across race and ethnicity categories are driven by the differences in completion rates at the starting institution. For example, there is a 26 percentage point gap between completion rates at the starting institution of Asian and black students (61.4 percent and 35.3 percent, respectively) while their completion rates elsewhere are nearly identical (10.3 percent and 10.6 percent, respectively).
The stop-out rates were highest among black students (35.3 percent), compared to Asian (14.2 percent), Hispanic (27.1 percent), and white (21.4 percent) students. When examined by gender, the pattern stayed consistent for male and female students separately. Black men had the highest stop-out rate (41.1 percent) and Asian women had the lowest (11.2 percent). Traditional-age students had the highest completion rates, followed by delayed entry students, and adult learners within each race and ethnicity category. (Figure 12). Among traditional-age students, however, black students had the lowest completion rate (49.4 percent), followed by Hispanic students (58.2 percent), white students (70.7 percent), and Asian students (73.7 percent). Race and ethnicity by enrollment intensity patterns revealed that regardless of race and ethnicity category, exclusively full-time students were more likely to complete within six years than mixed enrollment or exclusively part-time students (Figure 13). Further, mixed enrollment students were most likely to be still enrolled after six years than exclusively full- or part-time students.
Figure 10. Six-Year Outcomes for Students Who Started at Four-Year Public Institutions by Race and Ethnicity (N=1,236,815)*
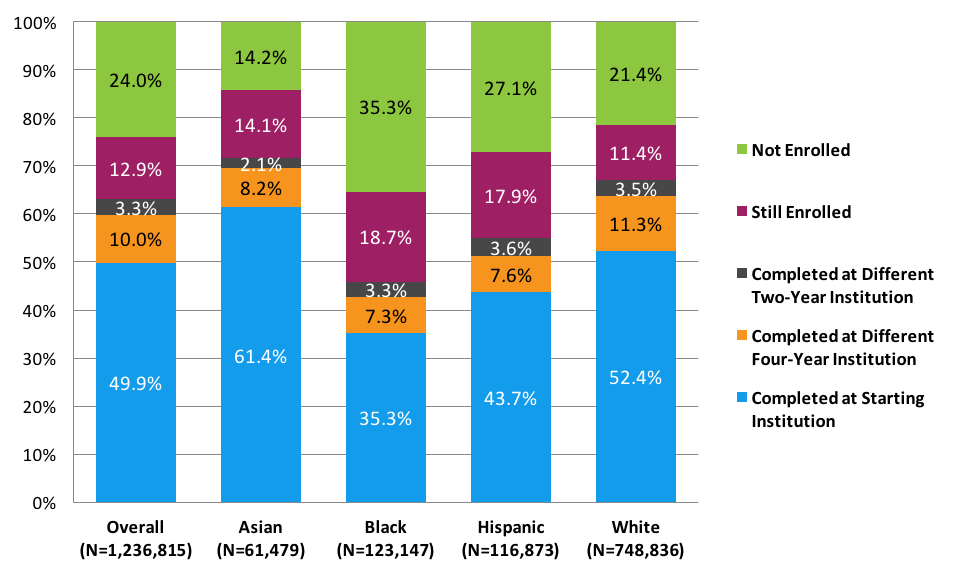
*This figure is based on data shown in Appendix B, Table 14.
Figure 11. Six-Year Outcomes for Students Who Started at Four-Year Public Institutions by Race and Ethnicity and Gender (N=1,004,591)*
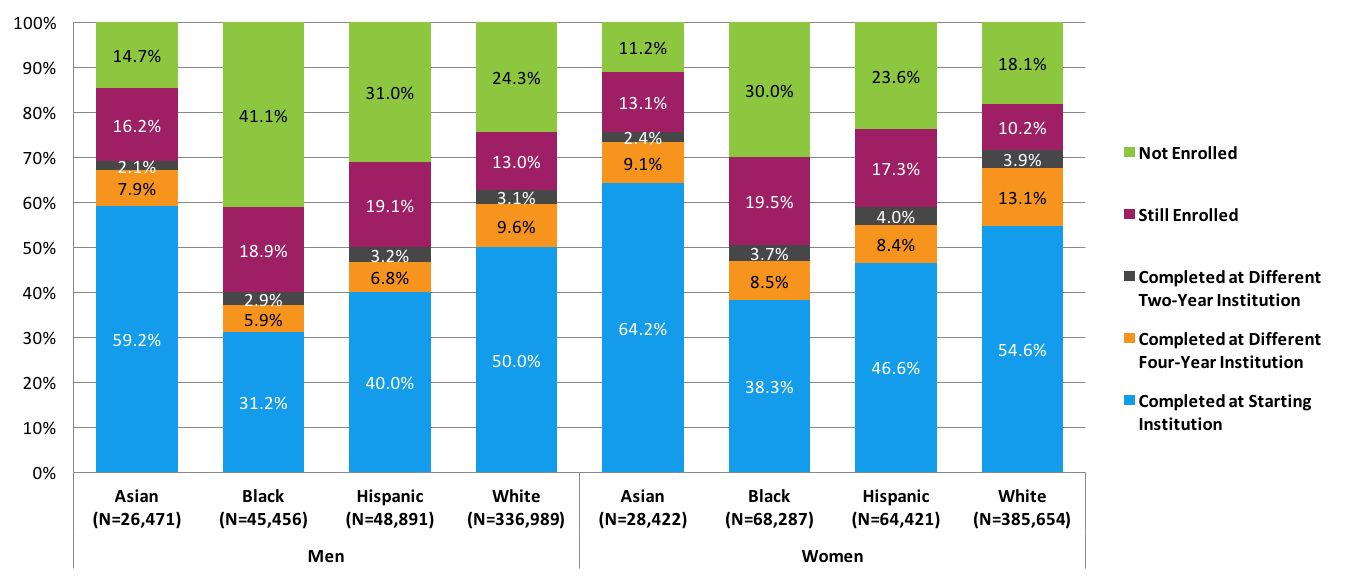
Note: Students with missing gender data were excluded from the above figure.
*This figure is based on data shown in Appendix B, Table 15.
Figure 12. Six-Year Outcomes for Students Who Started at Four-Year Public Institutions by Race and Ethnicity and Age at First Entry (N=1,050,243)*
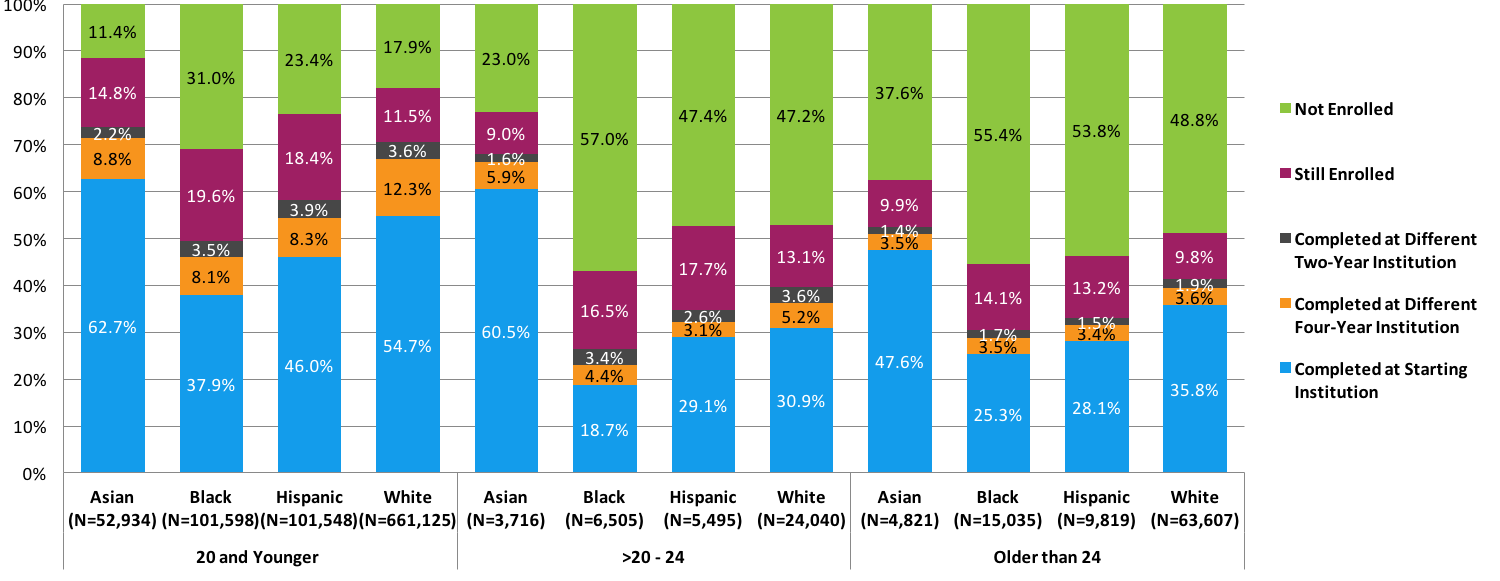
Note: Students with missing age data were excluded from the above figure.
*This figure is based on data shown in Appendix B, Table 16.
Figure 13. Six-Year Outcomes for Students Who Started at Four-Year Public Institutions by Race and Ethnicity and Enrollment Intensity (N=1,050,235)*
*This figure is based on data shown in Appendix B, Table 17.
Completion Patterns by Race and Ethnicity for Students Who Started at Two-Year Public Institutions
Figures 14 through 18 display the six‐year outcomes for students who started at two‐year public institutions. Among students who started at two-year public institutions, white and Asian students were more likely to graduate with a degree or certificate (45.1 and 43.8 percent completion rate, respectively) after six years than black or Hispanic students (25.8 and 33.0 percent, respectively). Asian students had the lowest stop-out rate (32.0 percent), followed by white (41.5 percent), Hispanic (44.8 percent), and black (56.7 percent) students. The total completion rate at four-year institutions (with or without first receiving an associate degree or certificate from a two-year institution) for Asian and white students (23.0 percent 19.2 percent, respectively) almost doubled the completion rate of black (8.6 percent) and Hispanic (10.8 percent) students (Figure 15). Overall, most students who eventually transfer to and earn a degree from a four-year institution has done so without a degree or certificate from a two-year institution. This pattern was true for Asian, white, and black students. However, practically half of Hispanic students who eventually earn a four-year degree had also completed a two-year credential. When examined by gender, black men had the lowest completion rate at the starting institution, 16.9 percent, as well as the lowest completion rate elsewhere, 6.7 percent, adding up to the lowest overall completion rate, 23.7 percent. Further, black men who began their postsecondary studies at a two-year institution were also the most likely to have discontinued enrollment at the end of six years in comparison to any other gender, race, or ethnic group (60.9 percent).
Race and ethnicity by age completion patterns in Figure 17 show that, overall, traditional-age students tend to have higher completion rates than delayed-entry students and adult learners. Traditional-age white students were the most likely to complete a degree or certificate (48.4 percent), whereas traditional-age Asian students were least likely to stop out after six years (25.7 percent). Regardless of the age category, however, over half of black students who started at two-year public institutions dropped out of college by the end of the study period.
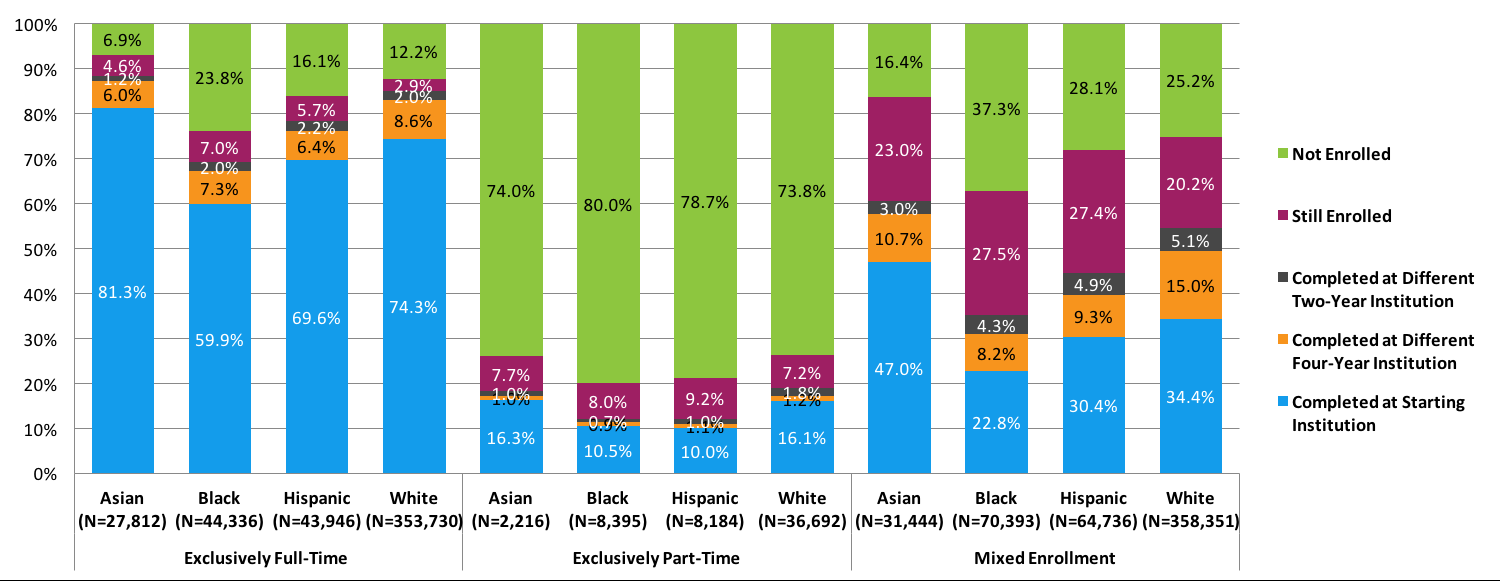
In terms of the completion rates by race and ethnicity, and enrollment intensity, the results revealed that, overall, students who were enrolled exclusively full time had higher completion rates than students who had mixed enrollment or enrolled exclusively part time (Figure 18). However, even among exclusively full-time students, black students had much lower completion rate (36.0 percent) than Hispanic, white, and Asian students (52.6 percent, 59.9 percent, and 70.6 percent, respectively).
Figure 14. Six-Year Outcomes and First Completion for Students Who Started at Two-Year Public Institutions by Race and Ethnicity (N=1,089,776)*
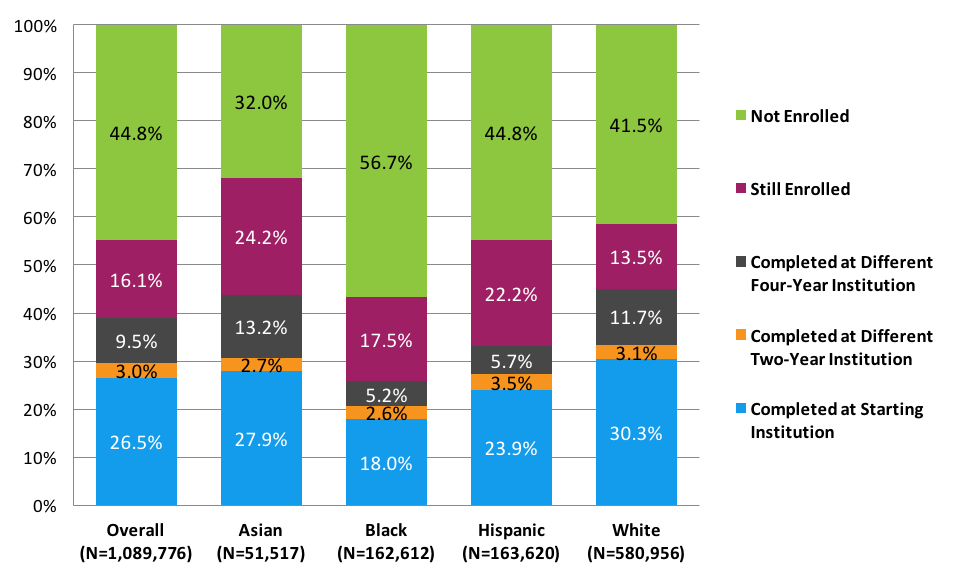
*This figure is based on data shown in Appendix B, Table 20.
Figure 15. Completions at Four-Year Institutions for Students Who Started at Two-Year Public Institutions by Race and Ethnicity (N=1,089,776)*
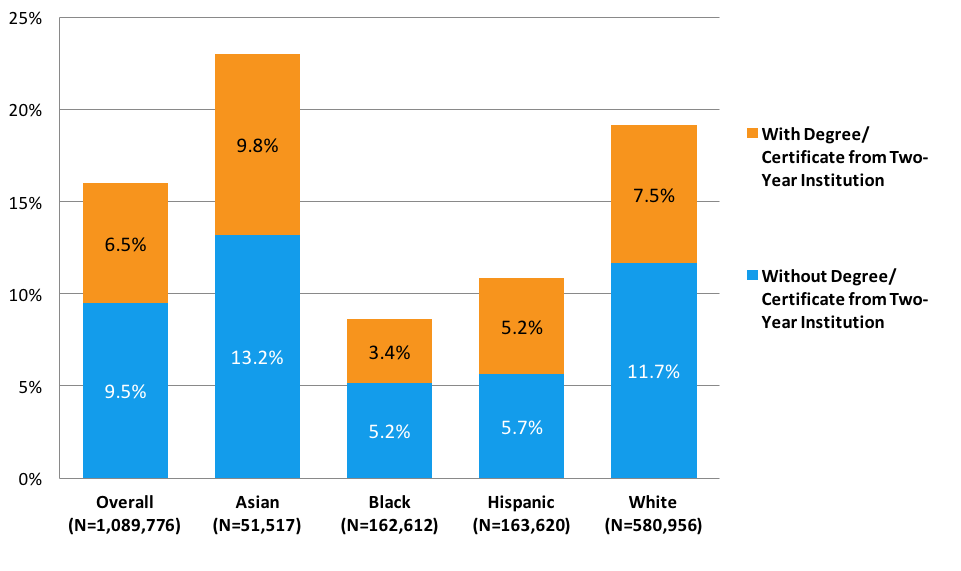
*This figure is based on data shown in Appendix B, Table 20.
Figure 16. Six-Year Outcomes and First Completion for Students Who Started at Two-Year Public Institutions by Race and Ethnicity and Gender (N=908,861)*
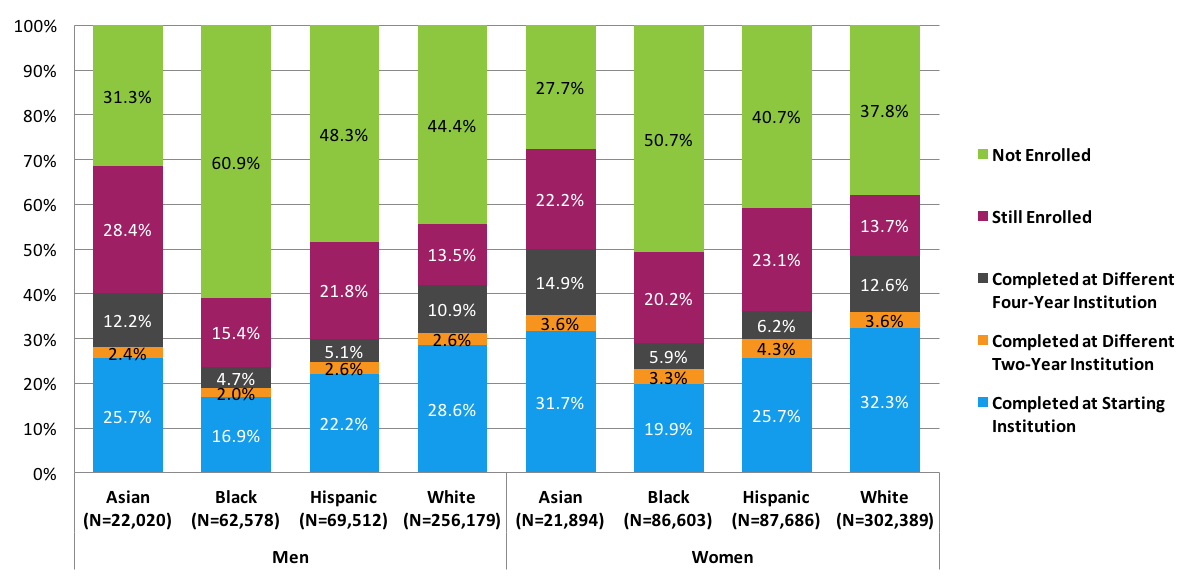
Note: Students with missing gender data were excluded from the above figure.
*This figure is based on data shown in Appendix B, Table 21.
Figure 17. Six-Year Outcomes and First Completion for Students Who Started at Two-Year Public Institutions by Race and Ethnicity and Age at First Entry (N=958,301)*
Note: Students with missing age data were excluded from the above figure.
*This figure is based on data shown in Appendix B, Table 22.
Figure 18. Six-Year Outcomes and First Completion for Students Who Started at Two-Year Public Institutions by Race and Ethnicity and Enrollment Intensity (N=958,653)*
*This figure is based on data shown in Appendix B, Table 23.
Discussion
This is the first-ever report by the National Student Clearinghouse Research Center with breakdowns by race and ethnicity. Previously, in our High School Benchmarks report (NSCRC, 2016a), we reported on postsecondary access and completion outcomes of graduates from different types of high schools: low income versus higher income, low minority versus high minority. The findings from that report showed both access and completion gaps: the first fall enrollment in college immediately after high school graduation was 57 percent for students from high minority schools and 68 percent for those from low minority schools. However, we observed a much larger gap in the completion rates: six years after high school, only 28 percent of the graduates of high minority high schools had completed a college degree, compared to 48 percent for those from low minority schools.
The findings from this report show that the completion gaps do not disappear or become narrower when first-time-in-college students are the focus as opposed to high school graduates. Using the latest available student-level data in this report allowed a more nuanced analysis enabling us to identify areas where the gaps are the largest and there is more room for improvement.
About the Cohort
The differences among the racial and ethnic groups appeared long before the end of the six-year completion tracking window. Black students tended to be older when they entered college, and blacks and Hispanics were more likely to have started in community colleges. Among white, Hispanic, and Asian students at least four in five students were traditional-age at first entry. Just about 70 percent of black students were traditional-age and more than one in five were adult learners. Among white and Asian students, 45.9 percent and 45.1 percent, respectively, started in a four-year public institution. Just slightly over one-third of black and Hispanic students (36.6 percent and 36.3 percent, respectively) started in a four-year public institution. The pattern reversed when we looked at two-year public institutions. Half of Hispanic students and just about half of black students (50.8 percent and 48.5 percent, respectively) started in a two-year public institution while slightly over one-third of Asian and white students did so (37.8 percent and 35.6 percent, respectively).
Overall Completion Rates
The overall completion rates regardless of what type of institutions students started were the highest for Asian and white students (63.2 percent and 62.0 percent, respectively) followed by Hispanic students (45.8 percent) and black students (38 percent).
As the results above show, there is a 24 percentage point gap in the completion rates of black and white students. The gap is narrower at 16 percent, but still sizable between Hispanic and white students (45.8 percent and 62.0 percent, respectively). The pattern stays unchanged when examined for women and men separately.
When examined by age, the gaps between racial groups tend to shrink as the students grow older. Among traditional-age students, there was a 24 percentage point gap in the completion rates of black and white students (42.7 percent and 66.8 percent, respectively) and 17.5 percentage points gap in the completion rate of Hispanic and white students (49.3 percent and 66.8 percent, respectively). The completion rate gap between black and white students in the delayed entry group was only 14.4 percentage points (35.4 percent and 21.0 percent, respectively) and much smaller still between Hispanic and white students (6.4 percentage points). Finally, among adult learners the gap was 12.3 percentage points (42.0 percent and 29.7 percent, respectively) between black and white students and 9.1 percentage points between Hispanic and white students (42.0 percent and 32.9 percent, respectively).
Completion Rates at Four–Year Public Institutions
Among students who started in four-year public institutions, black students had the lowest six-year completion rate (45.9 percent). Hispanic students had an almost 10 percentage point higher completion rate than black students (55.0 percent). Over two-thirds of white and Asian students completed a degree within the same six-year period (67.2 percent and 71.7 percent, respectively). White students had the highest completion rate elsewhere: 14.8 percent of white students who started in four-year public institutions completed at an institution other than the starting institution. The completion rate elsewhere for Asian students was very similar to that of Hispanic and black students (10.3 percent, 11.3 percent, and 10.6 percent, respectively). As these results demonstrate, the differences in the completion rates of white and black students, and white and Hispanic students were equally driven by the differences in completions both at the starting institution and elsewhere. This was not the case for the completion gaps between Asian and Hispanic as well as Asian and black students: the completion rate was much higher for Asian students than for black and Hispanic students at the starting institution, but was very similar in terms of completions elsewhere.
When disaggregated by gender, black men had the lowest completion rate (40.0 percent) and the highest stop-out rate (41.1 percent) and Asian women had the highest completion rate (75.7 percent) and the lowest stop-out rate (11.2 percent). Within each race and ethnicity category, women outperformed men. The largest gap was among black students, with women having a 10 percentage point higher completion rate than men (50.5 percent and 40.0 percent, respectively) and the smallest gap was among Asian students: female Asian students’ completion rate was 6.6 percentage points higher than male Asian students.
When disaggregated by age, within each race category, there was a 19 or more percentage point gap in the completion rates of traditional-age students and adult learners. The largest gap was among white students: with a high overall completion rate of 70.7 percent, traditional-age students’ rate was 29.3 percentage points higher than that for the adult learners. The smallest gap was among black students: slightly less than half of the traditional-age students had a degree or certificate within six years, which was 18.9 percentage points higher than that for the adult learners.
A higher proportion of Asian and white students enrolled exclusively full time (45.2 percent and 47.2 percent) while a higher proportion of black and Hispanic students had mixed enrollment patterns that included both full- and part-time terms. Having mixed enrollments is a decision the student makes as a result of the changing circumstances, switching from full- to part-time or vice-versa. The changes might be related to academic reasons or financial aid, or non-academic reasons, such as the student’s work or family circumstances. Mixed enrollment seems to be a good strategy to stay on track to completion for all students, regardless of their race and ethnicity. While students in this category have lower completion rates than exclusively full-time students, many of them were still enrolled at the end of the study period. For example, among black students, the completion rate was 69.2 percent for exclusively full-time students. Only 7 percent were still enrolled in the last year of the study, with 23.8 percent stopping out. Black students with mixed enrollment had a much lower completion rate at 35.3 percent. However, 27.5 percent of them were still enrolled at the end of the study period, making the stop-out rate 37.3 percent. A similar pattern was observed among Hispanic students with exclusively full-time (73.8 percent completion rate with only 4.5 still enrolled) and mixed enrollments (37.0 percent completion rate with 27.3 percent still enrolled). While the stop-out rate is still higher for mixed enrollment students than for exclusively full-time students, it is much lower than that for exclusively part-time students. At least three in four students in the latter group stopped out without any degree by the end of the study period within each of the four race and ethnicity categories.
Completion Rates at Two-Year Public Institutions
The overall completion rate for students who started in two-year public institutions was much higher for white and Asian students (45.1 percent and 43.8 percent, respectively) than Hispanic and black students (33 percent and 25.8 percent, respectively). The total completion rate at a four-year institution (with or without receiving an associate’s degree first) was dramatically different for students of different racial and ethnic groups. While almost one in four Asian students and one in five white students completed at a four-year institution by the end of the study period, just one in 10 Hispanic students and about one in 12 black students were able to do so.
When disaggregated by gender within each race and ethnicity category, we observed differences in completion rates between men and women within each race and ethnicity category, as well as differences by race and ethnicity within each gender category. In every race and ethnicity category women outperformed men. The gap in completion rates between men and women ranged from 5.4 percentage points among black students to 9.9 percentage points among Asian students.
Black men and women both have lower rates than men and women in other race and ethnicity categories. The outcomes of black men are particularly alarming: less than one out of four black men who begin their postsecondary studies at a community college eventually complete a degree or certificate and just about 61 percent end up stopping out or dropping out at the end of six years. Among black women, 29.0 percent completed a degree or certificate at the end of the study period and half of them stopped out or dropped out. Hispanic men had a 29.9 percent completion rate within six years and almost half of them (48.3 percent) stopped out. More than one-third of Hispanic women completed a degree or certificate and 40.7 percent stopped out.
When examined by age, among Asian and white students there was a large gap in the completion rates of traditional-age students and adult learners. With a 47.0 percent completion rate traditional-age Asian students had a 13.9 percentage point higher rate than adult learners. Among white students, traditional-age students and adult learners had 7.5 percentage points gap in the completion rates (48.4 percent and 40.9 percent, respectively). This gap was only 3.5 percentage points among Hispanic students (34.6 percent and 31.1 percent, respectively). Among black students, the pattern was reversed with adult learners having a slightly higher completion rate than traditional-age students (27.9 percent and 26.4 percent, respectively).
Implications for Policymaking
Important patterns emerged from the findings with implications for institutional and public policymaking, a few of which are mentioned here. Counting students who graduate at transfer institutions does not close the overall racial completion gaps as the pattern of transfer-completion rates is similar to the pattern of starting institution completion rates. This means that there is much work for institutions to do to improve minority students’ postsecondary outcomes regardless of the pathway they pursue: whether they are native to the institution, transferring in or transferring out.
In a number of recent reports, the Research Center has discussed the contributions of community colleges to student success, including baccalaureate degree attainment (NSCRC, 2016b). This report provides additional evidence that community colleges facilitate access to postsecondary education, especially for black and Hispanic students: almost half of the students in each of these two groups started in a two-year public institution. However, we also found very low success rates for underrepresented minority students starting at two-year public institutions, particularly for black students. Among black students, low completion rates and high stop-out rates were observed regardless of the subgroup we examined, even those who ordinarily have high attainment rates: traditional-age and exclusively full-time students.
Bachelor’s completion rates for students who started at two-year public institutions are also very low for underrepresented minorities. It is worth noting that six years is a somewhat aggressive timeline for any community college student to transfer and finish a bachelor’s degree, and, in absolute terms, this rate was low for all students, regardless of race and ethnicity. However, black and Hispanic students’ four-year completion rates are dramatically lower than those of white and Asian students. This is particularly troubling in light of the growing expectation that community colleges serve as lower-cost starting points for students seeking bachelor’s degrees.
Adult learners are at a disadvantage in comparison with the traditional-age students regardless of the race and ethnicity category. While the completion gap still exists between black and white, and Hispanic and white adult learners, it is not as large as the completion gap among traditional-age students across race and ethnic categories. Perhaps this can be explained by the challenges adult learners share: balancing work and family responsibilities with school work. There seem to be a need for both four-year public schools and community colleges to enhance these students’ experiences and establish pathways that work better for them and, ultimately, keep them on track to completion.
Appendix A: Technical Notes and Methodology
OVERVIEW
This study examined six-year completion outcomes, including degree and certificate completion, of students by race and ethnicity using a stratified random sample of students who started their postsecondary studies in the fall of 2010. A total of 924,251 students from 647 schools were included in the sample. College completion outcomes for the full population of the fall 2010 cohort, without the race and ethnicity breakdowns, were reported in Signature Report 12, released in December, 2016 (N= 2.9M students), as well as in a state-level supplement, released in March 2017.
The methodological notes provided here cover only the points relevant to the sample, including sample design, weighting, and estimated standard errors and confidence intervals. For the first-time cohort identification, data decisions, and definitions of outcomes see Appendix A in Signature Report 12.
Description of the Sampling Procedures
The National Student Clearinghouse Research Center worked with the National Opinion Research Center (NORC) at the University of Chicago to design a representative sample of schools for conducting college success studies using student race and ethnicity data. Schools have been submitting race and ethnicity data to the Clearinghouse with their regular enrollment reporting files since 2009. As they are optional data elements, however, not all institutions participated and the coverage rates for these data have grown slowly over the years. At the start of this project in 2016, only about half of all records in the Clearinghouse data included a race and ethnicity value. Because of the potential biases in such a dataset (e.g., schools that opted to send the race and ethnicity data might have been the ones with the most resources), we were unable to use them for research purposes. To remedy this, we initiated a targeted recruitment project to encourage a representative sample of schools to provide race and ethnicity data to the Clearinghouse. Race and ethnicity values were appended to students’ prior enrollment data that had already been provided to the Clearinghouse. In other words, no recruitment of students took place within this project. NORC constructed its institution sampling frame using the list of schools already participating in the Clearinghouse enrollment reporting service, which included 96.5 percent of all enrollments in Title-IV, degree-granting institutions and 99.5 percent of enrollments in all public institutions. The final sample drawn from this population included 800 schools. NORC also produced an additional list of 247 schools for a second round of recruiting to replace sampled schools that did not respond to the first recruiting round.
Additional data collection was needed to ensure sufficient data coverage for the fall 2010 entering student cohort and the next five cohorts, from 2011 to 2015. In some cases, when sampled schools were missing data for a small subset of students, the data were augmented by pulling student race and ethnicity from regular Clearinghouse enrollment files and other Clearinghouse services. At the end of the project, 647 schools had complete race and ethnicity data for the fall 2010 cohort.
Weighting
All estimates in this report were weighted to represent the full population described in the overview and description of the sample.
Ideally, the selected sample is fully representative of the population with respect to all the variables measured in the survey. However, this is usually not the case because the sample is not selected with equal probability and not all sample units respond to the survey with the same propensity. These differences cause some groups to be over or underrepresented in the responding sample. If such problems occur, no reliable conclusions can be drawn from the observed survey data, unless the sample is adjusted to correct for the lack of representativeness. A commonly applied correction technique is weighting adjustment, which is applied to the school sample.
NORC computed a final weight for each responding school to support unbiased sample estimates. These weights were used in order for the sample to represent the underlying population of schools. The purpose of the weights was to adjust for potential bias in the sample estimates due to differences in selection probabilities and response rates. The final weight can be interpreted as the number of schools that each responding school represents in the study population.
The survey weight was computed in two steps:
- The base weight was computed to compensate for schools not selected into the sample;
- The base weight was adjusted to compensate for sample schools that did not complete the survey.
Calculation of the Base Weight
The base weight was computed as the inverse of the probability of selection under the sample design. This survey used a stratified survey design with three strata:
- Four-year public institutions
- Two-year public institutions
- Private institutions
Within each stratum, each school in the frame had an equal probability of selection into the sample. Thus, for each stratum, the probability of selection was computed as the ratio of the number of sampled schools to the total number of schools on the frame. The base weight per school was the inverse of its selection probability. Within each stratum, all sample schools had the same base weight and, across all sample schools, the base weight summed up to the number of schools in the frame.
Adjustment for Nonresponse
The purpose of the nonresponse adjustment was to account for the differences in response rates across subgroups of the population. The weighting class method was adopted to compute the nonresponse adjustments. First, the sample was divided into a set of mutually exclusive groups, called weighting classes, where the classes were formed by crossing the original sampling strata with the four-category region variable. States were divided into four regions, following the practice of the U.S. Census Bureau. This cross-classification defined a total of 12 weighting classes. For example, one of the weighting classes was four-year public schools in the West Region. Second, within each weighting class, the nonresponse adjustment factor was computed as the ratio of the total base weight across all schools to the total base weight of responding schools. Following standard practice, we excluded schools from the nonresponse adjustments, if they were determined to be out of scope of the survey.
The final weight was then computed as the product of the base weight and the nonresponse adjustment factor. For student-level analysis, the school weight was used for all students belonging to the particular school.
Bias Analysis
We conducted bias analysis by comparing the weighted demographic statistics, enrollment intensity, and starting institution type distributions from the representative sample with the same statistics from the full population. The assumption here was that if the selected sample was representative of the population, then the demographic distributions should have been very similar to the demographic distribution in the full population. The analysis revealed that the distributions from the sample and the full population were consistent with the exception of age, where the weighted representative sample had a higher proportion of traditional age students than the full population. This may be due to the smaller proportion of students who started at four-year for-profit schools in the selected representative sample than the full population, which was expected because the original sampling methodology did not stratify the sample based on for-profit schools.
For more details see Appendix C.
Standard Errors and Confidence Intervals
Since the study used students from a sample of schools as opposed to the entire universe of first-time students in fall 2010, the estimates are subject to sampling and nonsampling errors. Nonsampling errors were due to a number of causes, including nonresponse and data entry errors. Race/ethnicity data used in this study also come from multiple sources that may have differed in how they collect, store, and report these data.
Sampling errors exist in all sample-based datasets, which means that estimates calculated from this sample will differ from estimates calculated from other possible samples, even if all the samples were based on the fall 2010 cohort and designed in the same way.
Tables 8a, 14a, and 20a in Appendix C provide the estimated standard errors for the sample estimates presented in Tables 8, 14, and 20 in Appendix B.
The tables also report the 95 percent confidence intervals for completion rate estimates for the whole cohort and disaggregated by those who began at a four- or two-year public institution. For example, for the overall completion rate for the whole cohort, regardless of the starting institution, the point estimate was 56.2 percent. The upper level of the 95 percent confidence interval was 58.20 and the lower level was 54.25. This indicates that, statistically, there is only a five percent chance that the range 54.25 to 58.20 excludes the true average completion rate. For this particular data point, the completion rate for full fall 2010 cohort (the focus of Signature Report 12) was 54.8 percent, which fell within the 95 percent confidence interval.
References
Bowen, W. G., Chingos, M. M., & McPherson, M. S. (2009) Crossing the finish line: completing college at America’s public universities. Princeton: Princeton University Press
Carnevale, A. & Strohl, J. (2013). Separate and unequal: How higher education reinforces the intergenerational reproduction of white racial privilege. Washington, DC: Georgetown Public Policy Institute Center of Education and the Workforce. Retrieved from https://web.archive.org/web/20170309043347/https://cew.georgetown.edu/wp-content/uploads/2014/11/SeparateUnequal.FR_.pdf
Choy, S.P. (2001). Students whose parents did not go to college: Postsecondary access, persistence, and attainment. The Condition of Education. Washington, DC: National Center for Education Statistics. Retrieved from https://nces.ed.gov/pubs2001/2001072_Essay.pdf
DeAngelo, L., Franke, R., Hurtado, S., Pryor, J. H., & Tran, S. (2011). Completing college: Assessing graduation rates at four-year institutions. Los Angeles: Higher Education Research Institute, UCLA. Retrieved from https://heri.ucla.edu/DARCU/CompletingCollege2011.pdf
Engle, J. & Theokas, C. (2010). Top Gainers: Some Public Four-Year Colleges and Universities Make Big Improvements in Minority Graduation Rates. College Results Online, The Education Trust. Retrieved from http://files.eric.ed.gov/fulltext/ED511868.pdf
Frehill, L. M. (2000). Race, Class, Gender, and College Completion: The 1980 High School Senior Cohort. Race, Gender & Class, 81-107.
Jackson, B. A., & Reynolds, J. R. (2013). The price of opportunity: Race, student loan debt, and college achievement. Sociological Inquiry, 83(3), 335-368.
Lundy, V. C. (2010). The significance of interactions: Understanding gender, ethnicity/race, and socioeconomic status as related to the likelihood of bachelor’s degree completion. Publicly accessible Penn Dissertations. 128. Retrieved from http://repository.upenn.edu/edissertations/128/
Nichols, A.H. & Evans-Bell, D. (2016). A look at Black student success: Identifying top- and bottom-performing institutions. Washington, DC: The Education Trust.
National Student Clearinghouse Research Center [NSCRC]. (2016a). High School Benchmarks 2016: National college progression rates. Retrieved from https://nscresearchcenter.org/pubproof/high-school-benchmarks-2016-national-college-progression-rates/
National Student Clearinghouse Research Center [NSCRC]. (2016b). The role of community colleges in postsecondary success: Community colleges outcomes report. Retrieved from https://studentclearinghouse.info/onestop/wp-content/uploads/Comm-Colleges-Outcomes-Report.pdf
Oseguera, L. (2005). Four and six-year baccalaureate degree completion by institutional characteristics and racial/ethnic groups. Journal of College Student Retention: Research, Theory & Practice, 7(1), 19-59.
Santos, J. L. & Haycock, K. (2016). Fixing America’s College Attainment Problems: It’s about More than Affordability. Critical Considerations for Any New Federal-State Partnership. New York, NY: Education Trust. Retrieved from https://edtrust.org/wp-content/uploads/2014/09/FixingAmericasCollegeAttainmentProblem_EdTrust.pdf
Shapiro, D., Dundar, A., Wakhungu, P.K., Yuan, X., Nathan, A. & Hwang, Y. (2016, November). Completing College: A National View of Student Attainment Rates – Fall 2010 Cohort (Signature Report No. 12). Herndon, VA: National Student Clearinghouse Research Center. Retrieved from https://nscresearchcenter.org/pubproof/signaturereport12/
Sólorzano, D. G., Villalpando, O., & Oseguera, L. (2005). Educational inequities and Latina/o undergraduate students in the United States: A critical race analysis of their educational progress. Journal of Hispanic Higher Education, 4(3), 272-294.
U.S. Department of Education, National Center for Education Statistics. (2016). Advancing diversity and inclusion in higher education. Washington: DC: US Department of Education. Retrieved from http://www2.ed.gov/rschstat/research/pubs/advancing-diversity-inclusion.pdf