

Completing College – National – 2016
This fifth annual report on national college completion rates offers a look at the six-year outcomes for students who began postsecondary education in fall 2010, toward the end of the Great Recession. It looks at the various pathways students took toward degree completion, as well as the completion rates through May 2016 for the different student types who followed each pathway.
Suggested Citation: Shapiro, D., Dundar, A., Wakhungu, P.K., Yuan, X., Nathan, A. & Hwang, Y. (2016, November). Completing College: A National View of Student Attainment Rates – Fall 2010 Cohort (Signature Report No. 12). Herndon, VA: National Student Clearinghouse Research Center.
Table of Contents
- About This Report
- Executive Summary
- Introduction
- Results
- Overall Six-Year Outcomes
- Students Who Started at Four-Year Public Institutions
- Students Who Started at Two-Year Public Institutions
- Students Who Started at Four-Year Private Nonprofit Institutions
- Students Who Started at Four-Year Private For-Profit Institutions
- Completion across State Lines
- Supplemental Feature: Eight‐Year Outcomes for Fall 2008 Cohort
- Discussion of Results for the 2010 Cohort and Changes from the 2009 Cohort
- Increase in Overall Completion Rates After Two Years of Decline
- Increases in Completion Rates across Ages and Enrollment Intensities
- Completion Rates Increase for Students Who Started at Four-Year Public Institutions
- Increases in Completion Rates for Students Who Started at Two-Year Public Institutions, Including Completions at Four-Year Institutions
- Completion Rates Increase at Four-Year Private Nonprofit Institutions
- Completion Rates Improved for Students Who Started at Four-Year For-Profit Institutions
- Eight-Year Outcomes for Fall 2008 National Cohort
- Completion Rates for Exclusively Full-Time Students
- Implications for Policy
- References
- Appendix A: Methodological Notes
- Appendix B: Coverage Tables
- Appendix C: Results Tables
About This Report
Authors
National Student Clearinghouse Research Center
- Doug Shapiro
- Afet Dundar
Project on Academic Success, Indiana University
- Phoebe Khasiala Wakhungu
- Xin Yuan
- Angel Nathan
- Youngsik Hwang
Acknowledgements
The authors would like to thank Victor Borden, director of Project on Academic Success and Professor of Higher Education and Student Affairs at Indiana University. His comments and suggestions were extremely important to the development of the report. We would also like to acknowledge the team members of the National Student Clearinghouse Research Center, Faye Huie for her assistance with editing sections of the report and Joe Bloom for his work to make the Clearinghouse data analysis ready. Of course, any remaining errors or omissions are solely the responsibility of the authors.
Sponsor
This report was supported by a grant from the Lumina Foundation. Lumina Foundation, an Indianapolis-based private foundation, is committed to enrolling and graduating more students from college — especially 21st century students: low-income students, students of color, first-generation students and adult learners. Lumina’s goal is to increase the percentage of Americans who hold high-quality degrees and credentials to 60 percent by 2025. Lumina pursues this goal in three ways: by identifying and supporting effective practice, through public policy advocacy, and by using our communications and convening power to build public will for change. For more information, log on to www.luminafoundation.org.
Executive Summary
This Signature Report focuses on the six-year outcomes for students who began postsecondary education in fall 2010, toward the end of the Great Recession. In our previous national college completions report, published in November 2015, we studied the cohort of students who entered college in fall 2009. The report showed the continuing effects of the recent recession: the cohort was larger than that of the previous year, had more adult learners, more students in community colleges and for-profit institutions, and more part-time students. Although the official end of the Great Recession is considered to be June 2009 (National Bureau of Economic Research, 2010), its effects on employment, wages, and family finances have lingered far beyond, impacting students, colleges, and states to this day. The cohort in this year’s report, still at slightly over 2.9 million, stayed nearly unchanged in overall size, but there was a marked shift in enrollment destinations: two-year public institutions and four-year for-profit institutions decreased by 2 percent and 11 percent, respectively; while four-year public institutions increased by 3 percent. The cohort also had slightly more traditional-age students compared to the previous year.
Major Findings and Implications
Increase in Overall Completion Rates After Two Years of Decline
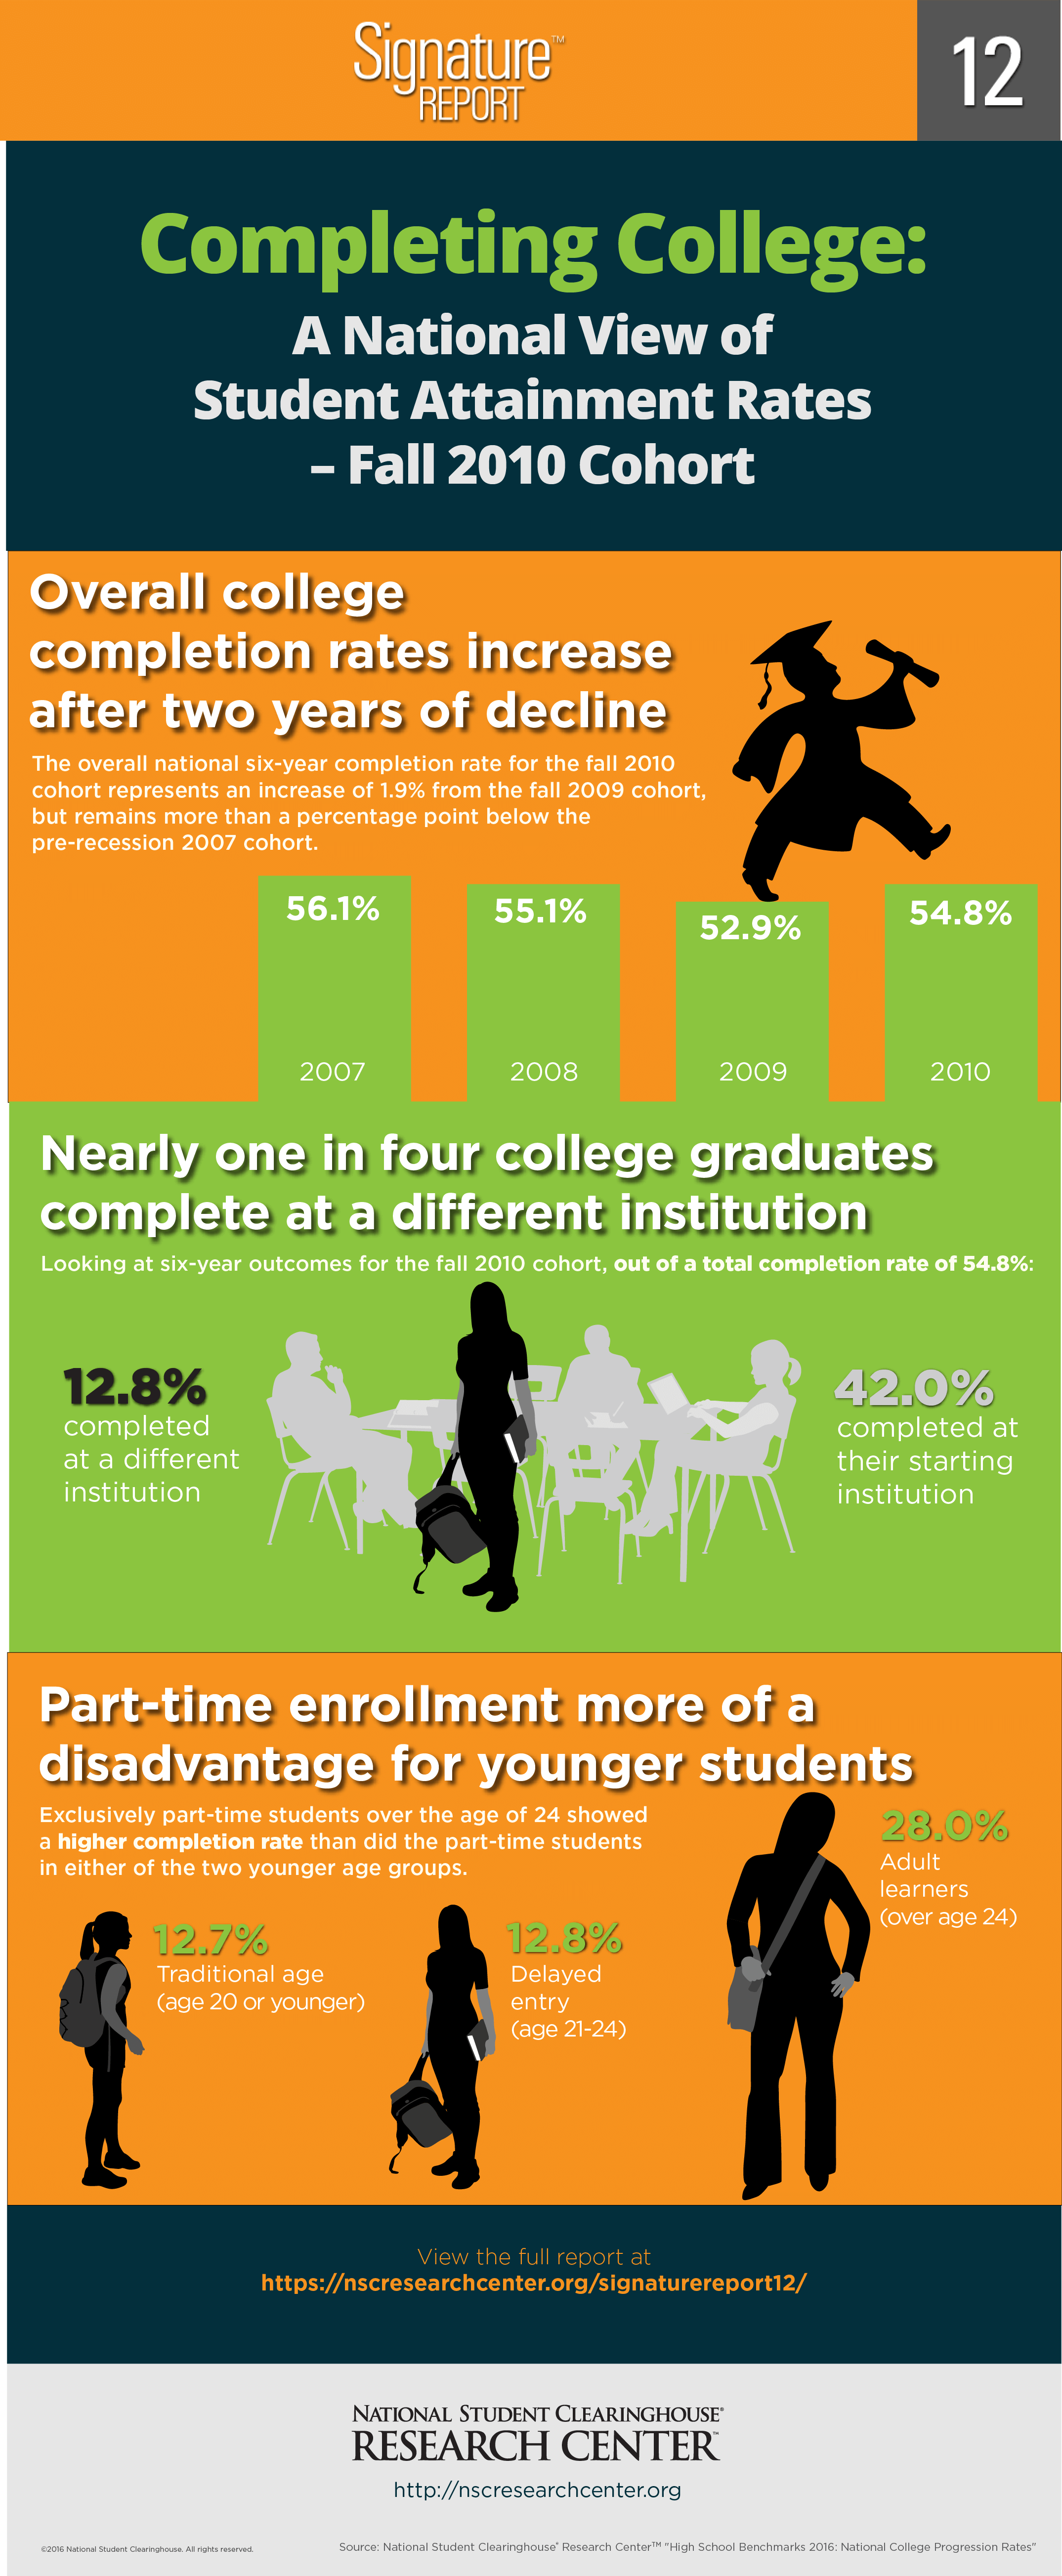
The overall national six-year completion rate for the fall 2010 cohort was 54.8 percent, an increase of 1.9 percentage points from the fall 2009 cohort. This counts all first-time students, regardless of institutional sector or enrollment intensity. This rate represents a recovery nearly to the level of the fall 2008 cohort (55.1 percent), but remains more than a percentage point below the high of 56.1 percent for the pre-recession 2007 cohort. The 2010 cohort’s higher rate of completion represents about 55,000 more graduates than the fall 2009 cohort, even though both were almost exactly the same size to begin with.
A small decrease, less than one percentage point, was observed in the percent of students who were still enrolled in their sixth year without having earned a degree. With more students graduating and fewer still enrolled, the share of students stopping out (no degree and no enrollment in the sixth year) decreased by 1.1 percentage points, from 33.0 percent to 31.9 percent.
Completion Rates Increase for Students Who Started at Four-Year Public Institutions
For students who started at four-year public institutions, the completion rate for the fall 2010 cohort increased 1.2 percentage points compared to that of fall 2009 cohort (62.4 percent and 61.2 percent). The increase was mostly attributable to students who graduated from their starting institution. The largest increase occurred among mixed enrollment students (1.1 percentage points) followed by exclusively full-time students (0.7 percentage points) and exclusively part-time students (0.6 percentage points).
Students in the delayed entry group had the largest increase in completion rates (from 43.1 percent to 50.1 percent), followed by adult learners (from 42.6 percent to 44.8 percent). Traditional-age students in this sector, meanwhile, had only a slight increase of 0.7 a percentage point.
Increases in Completion Rates for Students Who Started at Two-Year Public Institutions, Including Completions at Four-Year Institutions
The total completion rate for two-year starters, regardless of whether the completion occurred at a two-year or four-year institution, increased by slightly more than one percentage point, from 38.1 percent for the fall 2009 cohort to 39.3 percent for 2010 students. Traditional-age students had a 1.7 percentage point increase in their completion rate (42.4 percent and 40.7 percent, respectively). Delayed-entry students also saw an increase in their completion rate, which grew 1.5 percentage points (26.6 percent and 25.2 percent, respectively). Adult learners’ completion rate decreased slightly, from 36.5 percent to 36.2 percent.
In addition to examining the overall completion rates of students who started at two-year public institutions, we also looked specifically at their completions at four-year institutions. This rate, including those who completed with and without first earning a degree at a two-year institution, increased slightly. In total, 16.0 percent of two-year starters had completed a degree at a four-year institution by the end of the study period, up from 15.1 percent for the fall 2009 cohort and very close to the completion rate for the fall 2008 cohort (16.2 percent).
Completion Rates Increase at Four-Year Private Nonprofit Institutions
The completion rate for students who started in four-year private nonprofit institutions in fall 2010 increased to 73.9 from the fall 2009 cohort’s 71.5 percent. The size of the cohort for this sector increased slightly by 1.1 percentage points. Disaggregated by age, we observed a 2.4 percent increase in the number of traditional-age students and a large decrease (7.1 percent) among adult learners in the cohort. Much of the improvement in completion rates was attributable to older students: the increase for traditional age students, by far the largest segment of the cohort, increased by just one percentage point, from 76.0 to 77.0 percent.
Completion Rates Improved for Students Who Started at Four-Year For-Profit Institutions
After dramatic declines in the six-year completion rates of the previous two cohorts, the rate rebounded somewhat for those who started in four-year for-profit institutions in 2010.
In last year’s report, we found a 5.6 percentage point decrease for the fall 2009 cohort from that of the previous year (from 38.4 to 32.8 percent). The completion rate went up this year, to 37.1 percent for the fall 2010 cohort. The percentage who stopped out or dropped out without a degree or certificate decreased from 56.1 percent for the fall 2009 cohort to 52.2 percent for this year’s cohort.
The size of the cohort for this sector declined dramatically, by 11 percent. Most of the decline occurred among delayed entry students (21 percent) and adult learners (13 percent), who make up by far the largest share of the cohort, rather than among traditional-age students (6 percent).
Eight-Year Outcomes for Fall 2008 National Cohort
We examined eight-year outcomes for the fall 2008 cohort, tracking their enrollment patterns through spring 2016. With the two extra years, an additional 6.4 percent of the cohort completed degrees (compared to the six-year completion rate for the same cohort). This brought the total completion rate to 61.4 percent, including 44.8 percent who completed at their starting institution and an additional 16.6 percent who completed at a transfer institution. At the same time, the percentage of students who were still enrolled at the end of the eight-year period was 7.6 percentage points lower than at the six-year period (7.2 percent and 14.7 percent, respectively).
Results show that students who required the two extra years to complete their first degree were slightly more likely to do so at a different institution than at the institution where they started: the completion rate for these late finishers was 2.8 percentage points higher at the starting institution and 3.6 percentage points higher at a different institution.
Completion Rates for Exclusively Full-Time Students
First time ever, in this report, we are publishing completion rates for exclusively full-time students across all four-year institutions and all two-year institutions. There is an often cited result that “the 6-year graduation rate for first-time, full-time undergraduate students who began their pursuit of a bachelor’s degree at a four-year degree-granting institution in fall 2008 was 60 percent.” (U.S. Department of Education, 2016). This percentage is commonly perceived as the overall success rate for college students. The latest available information for two-year institutions is the three-year graduation rate for first-time, full-time degree/certificate-seeking students in fall 2010, which is 29.4 percent.
Our findings show much higher completion rates: 81.3 percent of full-time students who start in a four-year institution complete a degree within six years. Among two-year starters, exclusively full-time students had a 54.7 percent completion rate within six years. Nearly one in four of these completers finished in an institution other than the starting institution.
These higher rates are due mainly to three reasons:
- We include completions at all institutions, not just those where students started. This is a true national success rate for students, not an aggregate of institutional graduation rates for individual colleges.
- We define students as full-time if they attended full time in all enrolled terms, not just the first one (they may have stopped out, but they did not drop to part time).
- This is a six-year rate, even for students starting at two-year institutions. Most students entering community colleges say that a bachelor’s degree is their goal. They should have time to reach it before we stop counting.
Implications for Policy
In previous reports we observed the effects of the Great Recession on higher education: surges in enrollments, particularly among adult and part-time students, followed by declines in completion rates. In this year’s cohort we observed a partial reversal of these trends: dramatic increases in enrollments appear to have leveled off and completion rates are recovering some ground. For two-year institutions that could point to overcrowded classrooms to help explain lower completion rates in the previous years, the higher rates for this year’s smaller cohort were perhaps to be expected. For four-year public and non-profit institutions, however, the rebounding completions rates accomplished with continuing increases in enrollment are a surprising result.
To the extent that institutions may have been able to leverage improvements in student-serving programs, we should expect the upward trend to continue in the coming years. That is because increases in completion rates occurred this year for all students, regardless of their enrollment intensity category (exclusively full-time, exclusively part-time and mixed enrollment). Increases were also observed in completion rates for both traditional-age students and adult-learners.
Still, large differences in completion rates continue to exist based on student enrollment behaviors, such as part-time and mixed enrollment intensities, delayed entry (older students) choice of institution type, and transfer and mobility among multiple institutions. The effects of these factors on completion rates will continue to depend upon the future states of affordability, demographics, and the labor market that influence when, where, and how students attend college.
Using student-level data to disaggregate results for different types of students in different types of institutions enables a deeper understanding of the changes for the 2010 cohort in comparison with the previous cohorts. We hope the report serves as guide for practitioners and policymakers to where the greatest opportunities for improvement may lie.
Introduction
This Signature Report focuses on the six-year outcomes for students who began postsecondary education in fall 2010, toward the end of the Great Recession. Our previous completion report showed a 2.1 percentage point decline in the overall national completion rate between the fall 2008 cohort (55.0 percent) and the fall 2009 (52.9 percent) cohort (Shapiro et al, 2015). Although the number of college students typically increases during dips in the economy similar to that of the recent recession, higher enrollments do not necessarily translate into higher college completion rates (Messer & Wolter, 2010).
College completion is the focus of a national agenda because college education is considered fundamental for individual economic opportunity and United States (US) competitiveness in the global economy (U.S. Department of Education, n.d.). In addition to the national goal to increase the number of adults with a college degree, many states have also set their own objectives to increase graduation rates. Additionally, a wide range of organizations across the U.S. have launched initiatives to increase the number of adults in the U.S. who have a college credential. The College Board, for instance, is involved in projects whose goals are to increase the percentage of college-educated adults from 39 percent to 55 percent by 2025 (College Board, 2010; Lee, et al., 2011). Similarly, the Bill and Melinda Gates Foundation (2015) seeks to double the number of low-income students with a college credential by age 26 and the Lumina Foundation aims to “increase the percentage of Americans with high-quality degrees and credentials from the enduring rate of 39 percent to 60 percent by the year 2025″ (Lumina Foundation for Education, 2009, p. 1).
The initiatives of most organizations that have responded to the call to increase college completions are focused on improving completion outcomes, particularly among low-income and underrepresented students. Witham et al. (2015) highlighted the need to eliminate disparities between ethnic groups and across states in college attendance and completion rates. They also noted the need to involve faculty and institutional practitioners, who are in strong positions to take actions that can improve student outcomes and achieve the completion agenda.
Prior Research on College Completion
Various national reports and empirical studies related to college completion rely on established measures derived from national data sources such as the U.S. Department of Education’s IPEDS collections (e.g., first-to-second year retention, first-time full-time cohort graduation rates, and degree awards). Empirical studies that only use traditional student success measures, such as completion rates at institutions of origin, are substantially limited in their ability to capture the full picture of student progress and completion outcomes. Most significantly, they cannot accommodate student mobility between institutions, which is particularly important for the two-year institutions that help students realize their personal educational goals through means other than completion. A majority of studies focused on one institution or region and relied on institutional or state-level student unit record data. Consequently, they fail to account for increasingly common enrollment behaviors such as multi-institution enrollment, cross-state transfer, and transfer between institutional sectors (Bach et al., 2000; Hillman, Lum, & Hossler, 2008).
Students who enroll in college full-time immediately after high school no longer account for the majority of postsecondary college students (Choy, 2002; Horn & Carroll, 1997; Mullin, 2012; Petty 2014; Reeves, Miller, & Rouse, 2011; Shapiro et al, 2015). Because these “nontraditional” students have many external and competing demands, conventional measures of success, such as graduation rates for institution-based and first-time full-time degree-seeking cohorts, are insufficient for understanding the specific opportunity and risks that shape most students’ academic careers (ACSFA, 2012; Committee on Measures of Student Success, 2011; Moore & Shulock, 2009; U.S. Department of Education, 2011). Subsequently, a significant aspect of college completion research began to focus on the development and adoption of more inclusive methods for tracking student success and mobility across institutions.
What to Find in This Report
This report highlights the completion of postsecondary certificates and degrees by first-time-in-college degree-seeking students who initially enrolled in two- and four-year colleges and universities (public, private nonprofit, or private for-profit) nationwide in fall 2010. The study followed the fall 2010 cohort’s college enrollment behaviors for six years through spring 2016. The study cohort included former dual enrollment students: first-time college students in fall 2010 who had taken college courses while still in high school.
- Measures of Success: Six-year outcomes provided in this report include completions at students’ starting institutions, completions at institutions other than the starting institution, and continued enrollment of noncompleters through the end of the study period. While the report emphasized students’ first completions, it also examined subsequent completions at four-year institutions of students whose first credential was awarded by a two-year institution. Six-year postsecondary outcomes were presented by students’ age at first entry into college, by enrollment intensity and by the type of institution where students first enrolled. Results are presented for students in three categories of enrollment intensity: (1) exclusively full-time enrollment, (2) exclusively part-time enrollment, and (3) enrollments showing both full- and part-time terms during the six years examined (mixed enrollment students).
- Supplemental Feature: Explores eight-year postsecondary outcomes for the fall 2008 cohort.
- Discussion Section: Highlights the major findings of the report and discusses how they compare to the outcomes of the fall 2009 cohort.
A Note on the Data
Data Source
The data for this report were drawn from the StudentTracker® and DegreeVerifySM services, administered by the National Student Clearinghouse® (The Clearinghouse), which tracks 96.7 percent of college enrollments nationwide across all postsecondary institutions, including all institution types: two-year and four-year institutions, public and private institutions, and nonprofit and for-profit institutions. In order to ensure the most accurate possible representation of student outcomes for the study cohort, the results reported here are weighted according to the formula described in Appendix A using the state-by-state coverage rate for each institution type (sector and control). A complete explanation of national coverage rates and the weights used to ensure that results reflect enrollment and completion by sector and control can be found in Appendices A and B.
The student outcomes captured in this report are based on student-level data representing an unduplicated headcount of students across all institutions, a feature of the Clearinghouse data sets that distinguishes them from many other data sources, including the Integrated Postsecondary Education Data System (IPEDS), that may not accurately capture the complexity of postsecondary pathways because they are not structured to identify multiple enrollments by individual students. The capability of StudentTracker to link enrollment records across institutions nationally allows researchers to follow students longitudinally as they move from institution to institution, producing a fuller picture of college persistence and completion.
Although Clearinghouse data contain demographic information on students, historical coverage rates for the demographic data elements are uneven. Therefore, the results summarized in this report give a national overview of college completion by age at first entry and by enrollment intensity, showing the percentage of students who enrolled or completed at various types of institutions, but they do not examine completion by race/ethnicity, for example.
Cohort Definition
The cohort examined in this study is made up of first-time degree-seeking students, of any age, who began their postsecondary studies in the fall of 2010. Showing intent to seek a degree or certificate was defined as follows1:
- For students who started at four-year institutions, enrolled at least one term with an intensity of half-time or higher; and
- For students who started at two-year institutions, either:
- Enrolled full-time for at least one term before August 15, 2011, or
- Enrolled at least half-time for any two terms before December 31, 2011.
First-time status was established by confirming that a student (1) did not show any postsecondary enrollment record in the four years prior to the student’s fall 2010 enrollment, and (2) did not receive a degree or certificate from any postsecondary institution prior to fall 2010, according to Clearinghouse data. An exception was made for former dual enrollment students: first-time college students in fall 2010 who had taken college courses while still in high school were included in the study cohort.
Depending on the strengths and limitations of the data sets they use in their analysis, researchers face considerable complexity in operationalizing the category “first-time student.” For this report, the Clearinghouse and the Project on Academic Success (PAS) balanced competing priorities in selecting a method for identifying the study cohort. On the one hand, Clearinghouse data allowed the researchers to capture a unique headcount of students nationally and, therefore, to follow individual students while also accounting for concurrent enrollments. In addition, Clearinghouse data allowed the researchers to establish first-time enrollment status empirically, i.e., by searching for prior enrollments rather than by relying on institutions’ reports, which may include idiosyncratic definitions as well as errors in transactional records. On the other hand, some limitations do arise with the method for identifying the study cohort in this report.
Because Clearinghouse data on designations for class year are incomplete, for example, the researchers were not able to use them for this report. Consequently, this study’s sample may include students who have more than 30 Advanced Placement (AP), International Baccalaureate (IB), or dual enrollment credits (students included in this study’s sample as first-time students who, in fall 2009, were enrolled in college courses while still in high school), and who may not be considered freshmen by their institutions, despite having first-time-in-college status. Moreover, because of inconsistencies in the historical depth of DegreeVerify database records, it is possible that a small number of graduate students are also included in the study cohort. (For a full discussion of data, definitions, and limitations, please see Appendix A.)
Throughout this report, we examine college completion rates for the fall 2010 cohort. The study followed the cohort through May 31, 2016, and highlighted six-year student outcomes, including degree and certificate completion and continuing enrollment (persistence). Completions were identified using a combination of degree/certificate award records submitted by institutions as part of their participation in DegreeVerify as well as StudentTracker enrollment records indicating completions of a certificate or degree.
Former dual enrollment students, identified as those whose postsecondary enrollment or degree record prior to fall 2010 occurred before the student turned 18 years old, represent 15.8 percent of the fall 2009 cohort. By sector, these students represent 19 percent of those who started in four-year public institutions, 14 percent of the students who started in two-year public institutions, and 15 percent of those who started in four-year private nonprofit institutions. Only two percent of the students who started in four-year private for-profit institutions had prior dual enrollments. The main part of the results section discusses completion rates for the full cohort including former dual enrollment students.
1For comparison purposes, the results for non-degree seeking students who started at two-year public institutions are presented in Appendix C.
FIGURES 1-4 and TABLE 1
Figure 1 shows the fall 2010 cohort (n=2,919,088) including former dual enrollment students, disaggregated by type of starting institution. The largest proportion (41.8 percent, n=1,220,863) was enrolled in four-year public institutions, followed by two‐year public institutions with 37.3 percent (n=1,089,276), and four‐year private nonprofit institutions that constituted 16.8 percent (n=490,048) of the cohort. Four‐year private for‐profit institutions enrolled a small percentage of students (3.9 percent, n=114,166) when compared to their public counterparts. The smallest proportion of enrollments was comprised of two‐year private nonprofit institutions and two‐year private for‐profit institutions enrolling 0.1 percent each.
Figure 1. Fall 2010 Cohort By Starting Institution*
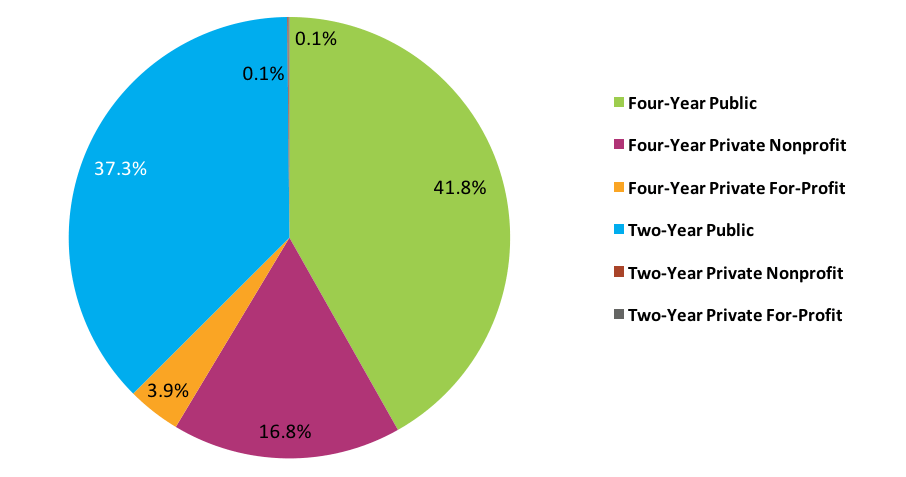
*This figure is based on data shown in Appendix C, Table 6.
Figure 2 represents student’s age in the 2010 cohort at the time of first entry into college. The majority of the students (73.8 percent) were age 20 or younger, followed by students over age 24 (18.8 percent) at the time of their initial enrollment. Only 7.3 percent of students were between 21 and 24 years old at first entry.
Figure 2. Fall 2010 Cohort by Age at First Entry*
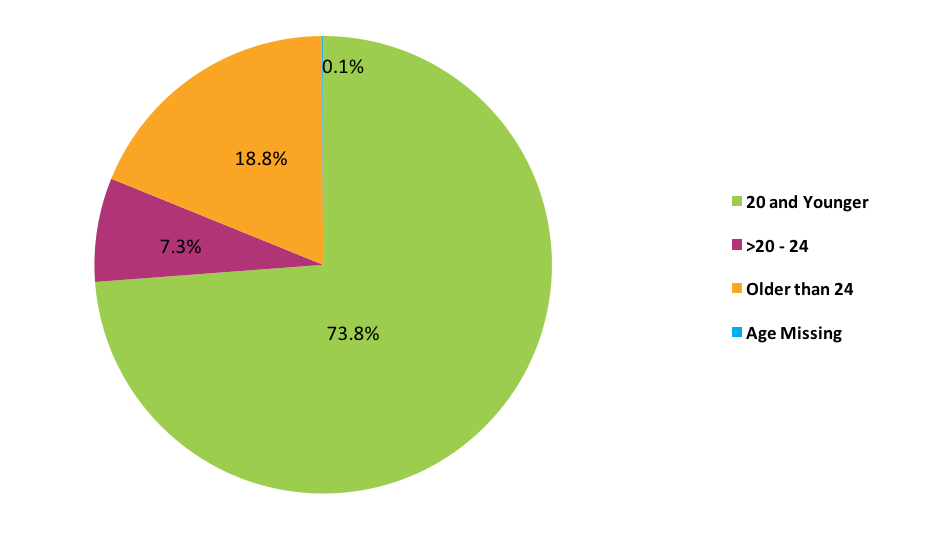
*This figure is based on data shown in Appendix C, Table 1.
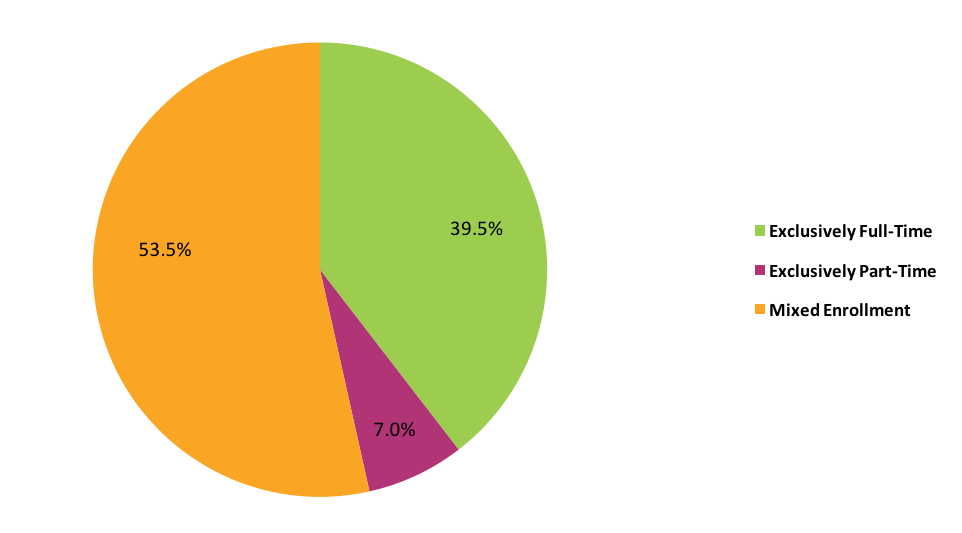
Figure 3 represents a breakdown of students’ enrollment intensity, which revealed that 39.5 percent of students in the cohort were enrolled exclusively full time throughout the study period whereas 7.0 percent were enrolled exclusively part-time. “Exclusively” means during all regular terms, excluding summers, in which the student was enrolled, and hence does not exclude stop‐outs. It is important to note that over half of the cohort (53.5 percent) were mixed enrollment students; that is, students enrolled full-time for some terms and part-time for other terms during the study period (see Appendix A for further detail).
Note that this is a significantly different definition of enrollment status than the one commonly used in graduation rate studies based on IPEDS data. IPEDS cohorts are based on student enrollment status in the first fall term only. Alternately, this report takes into account enrollment status of students over time and across institutions, allowing for a more nuanced classification.
Figure 3. Fall 2010 Cohort by Enrollment Intensity*
*This figure is based on data shown in Appendix C, Table 2.
Figure 4 represents the percentage of men and women in the 2010 cohort. Consistent with Signature Reports and national figures on postsecondary education attendance, women account for more than half of the cohort (54.9 percent). It is important to note that the data excluded students with missing gender data (5.9 percent of the cohort).
Figure 4. Fall 2010 Cohort by Gender*
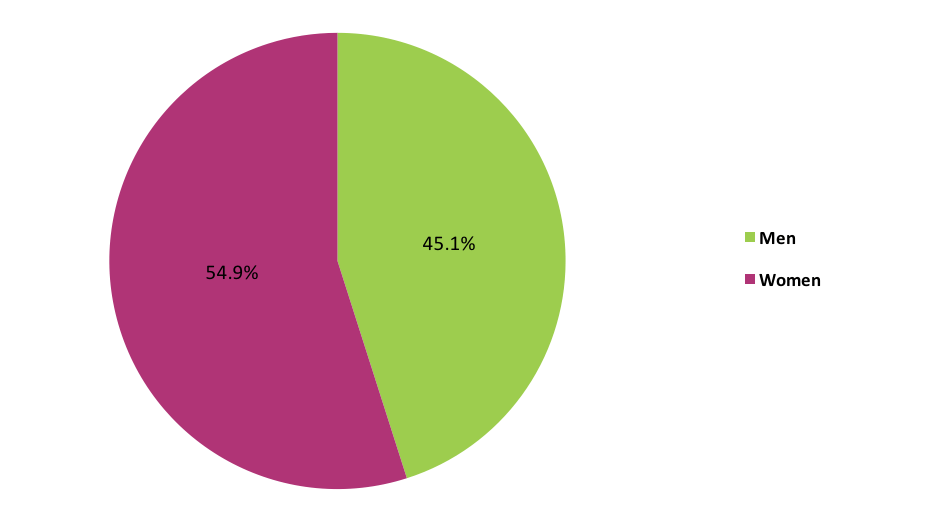
*This figure is based on data shown in Appendix C, Table 4.
Table 1 shows the distribution of students in the study cohort by age at first entry and enrollment intensity. For all the three age groups, students with mixed enrollment represented the largest proportions. For students who were 20 years old or younger at first entry, 54.2 percent had mixed enrollment, followed by students who were enrolled exclusively full-time (42.6 percent), and those enrolled exclusively part-time (3.2 percent). Among students over 24 years old at first entry, a similarly large percentage (51.3 percent) were enrolled both full- and part-time. In contrast to the younger groups, a higher proportion (20.2 percent) of students who were over 24 at first entry were enrolled exclusively part-time throughout the study period.
Table 1. Fall 2010 Cohort by Age at First Entry and Enrollment Intensity
| Age at First Entry | Enrollment Intensity | Weighted Count | Percentage of Age Group | |||||||||||||
|
||||||||||||||||
|
||||||||||||||||
|
||||||||||||||||
|
||||||||||||||||
Results
Overall Six-Year Outcomes
The results in this report describe the six-year outcomes of degree-seeking students who enrolled in postsecondary education for the first time in the fall of 2010. This report highlights each student’s first instance of completion, offering a national picture of college completion and takes a closer look at college outcomes for students of different age groups and enrollment intensity.
Figures 5 through 13 show six-year outcomes for the 2010 fall cohort broken out by:
- Enrollment intensity
- Gender
- Age group at first entry
- Gender and age
- Age group and enrollment intensity
- Starting institution type
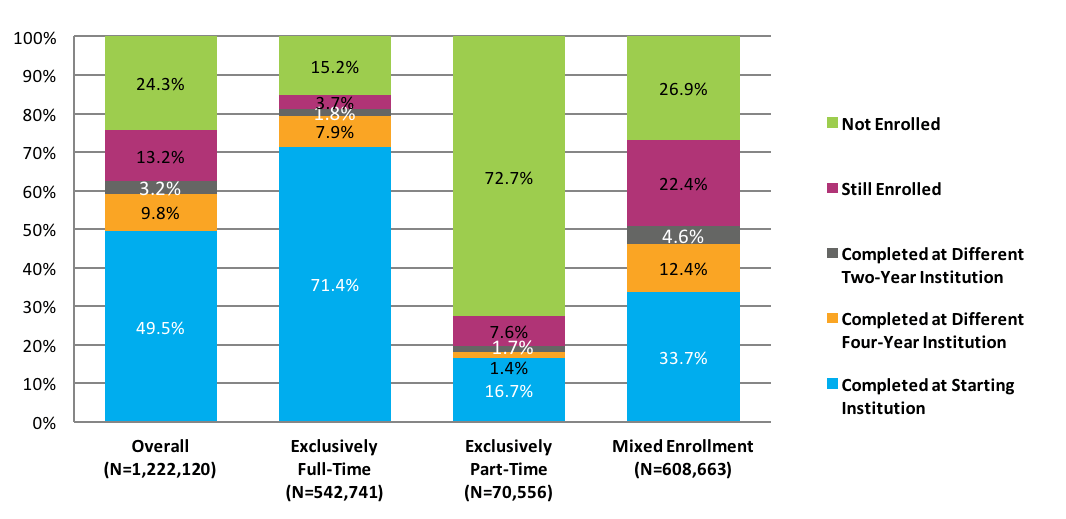
Overall, 42.0 percent of the cohort completed at their starting institution and additional 12.8 percent completed at a different institution, bringing the total completion rate to 54.8 percent, nationally. The proportion of students who had completed or were still enrolled at the end of the study period was 68.1 percent. Exclusively part-time students showed a lower total completion rate (21.0 percent) as compared to students with other enrollment intensities. This low completion pattern is accordant with the findings of the previous report (Signature 10), where the 2009 cohort of exclusively part-time students completed a postsecondary credential at lower rates than their exclusively full-time counterparts. Among this category of students, only 2.6 percent completed at a different institution. Further, while 7.4 percent were still enrolled, 71.6 percent had stopped out at the end of the study period. These results may suggest that six years is not enough time for exclusively part-time students to graduate from college (Figure 5). Overall, about one in four (23.3 percent) students who completed a credential had completed it at a different institution. The largest proportion (36.3 percent) of completion at a different institution was shown by mixed enrollment students (Figure 6), compared to exclusively full-time (13.6 percent) and exclusively part-time students (12.3 percent).
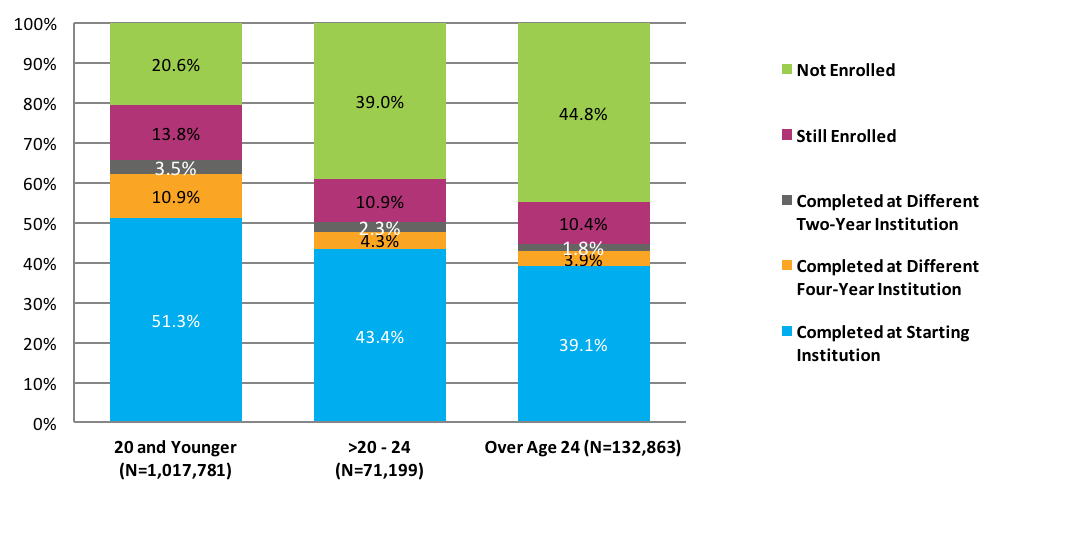
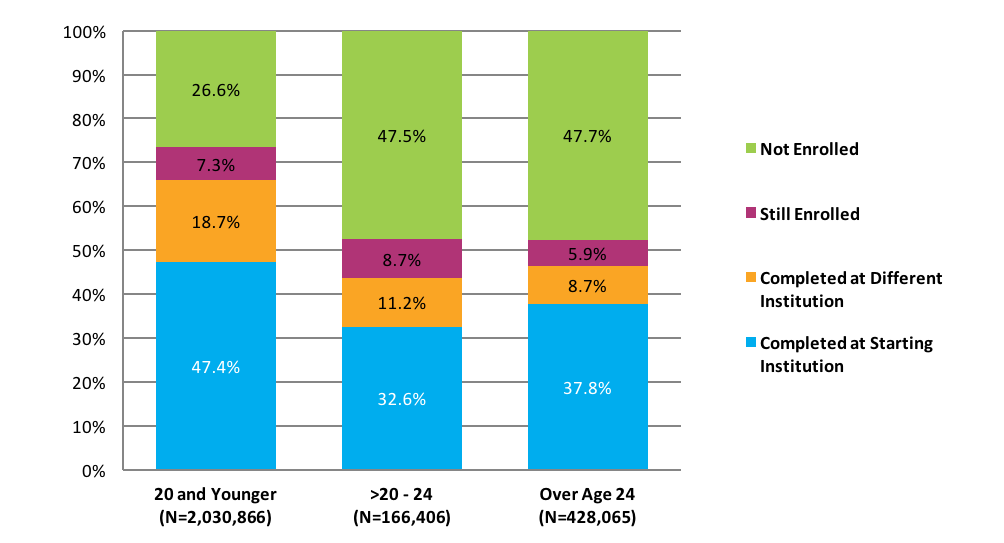
A higher proportion of delayed entry students (48.5 percent) and adult learners (49.3 percent) left postsecondary education without completing a credential as compared to 25.9 percent of traditional-age students who were no longer enrolled at the end of the study period (Figure 8). Additionally, one in four (24.8 percent) traditional-age students completed at a different institution, compared to 16.2 percent of adult learners (Figure 9).
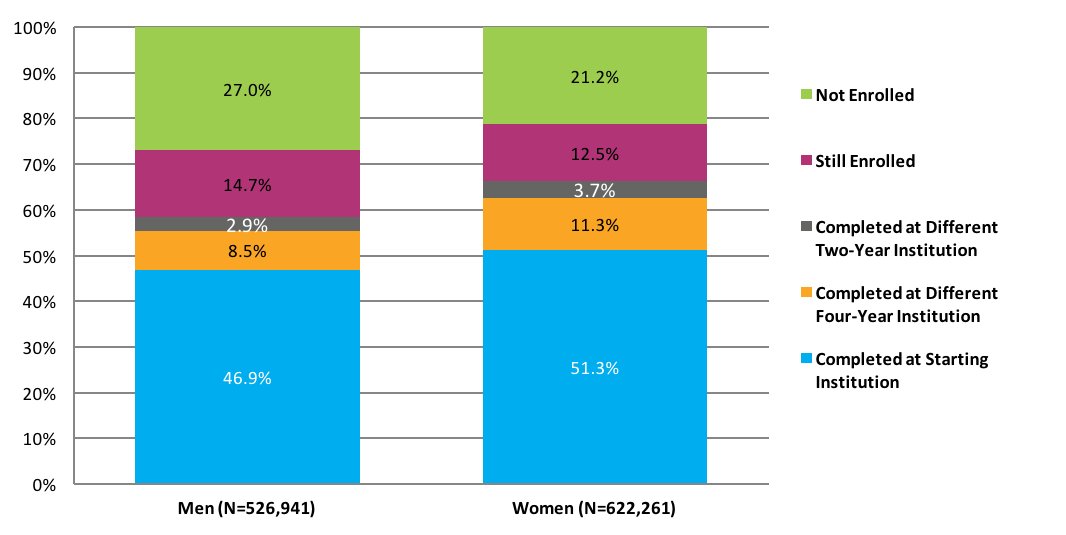
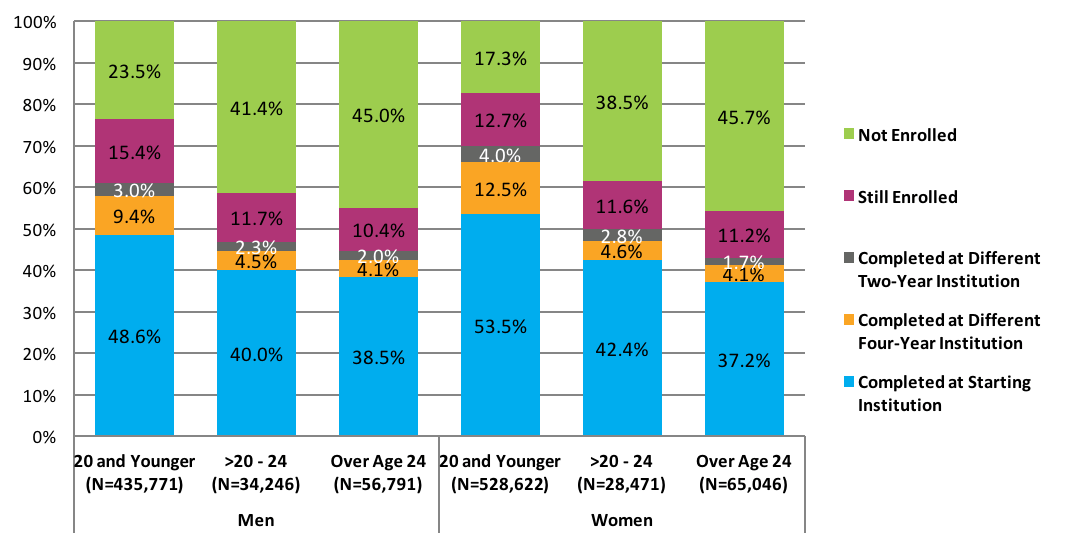
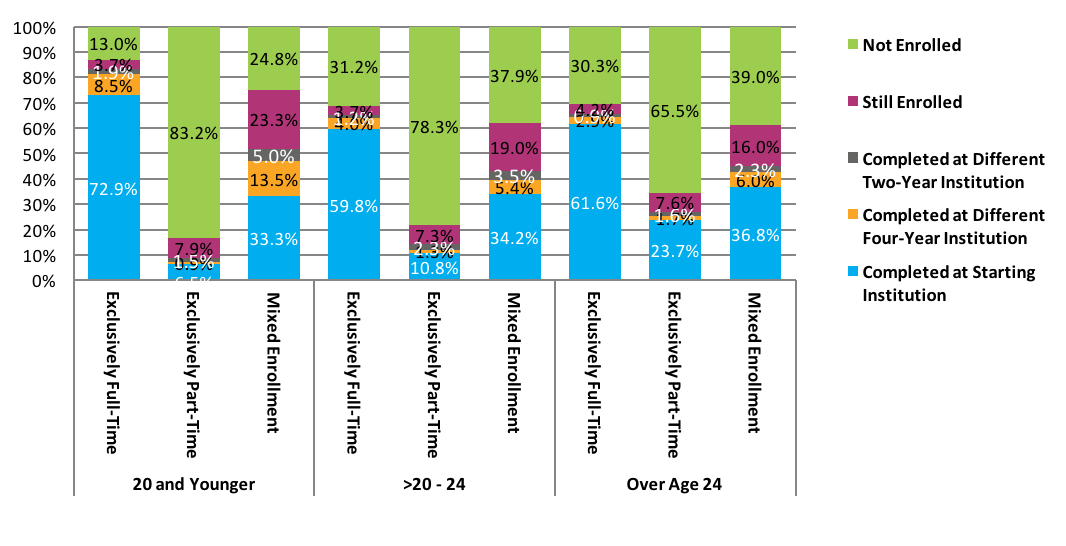
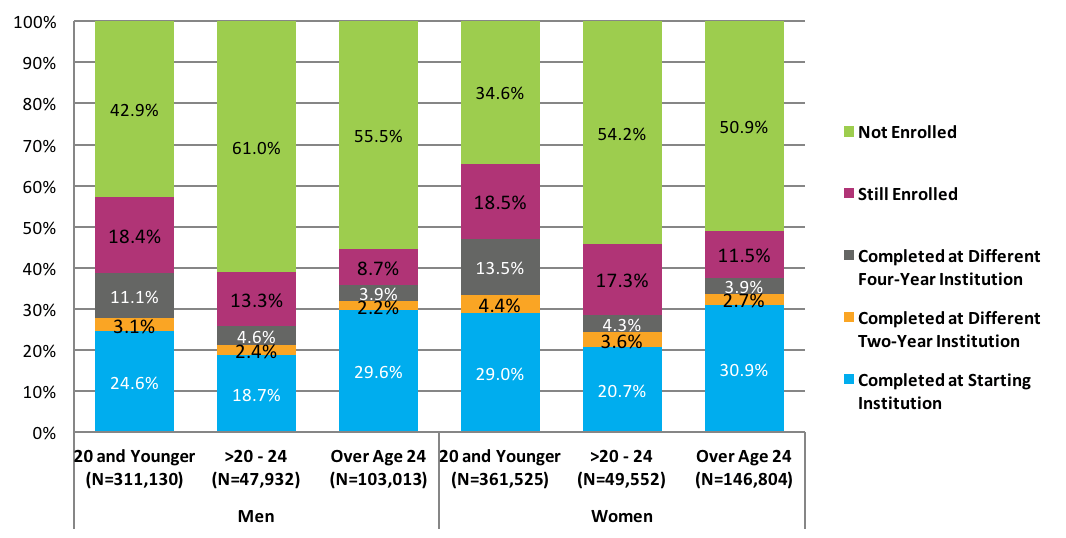
As stated in our previous reports, male students had lower completion rates, but higher stop-out rates than female students, a pattern that was present within each age group (Figure 7). Regardless of gender, almost one in two delayed entry students or adult learners stopped out at the end of the study period (Figure 10). In addition, regardless of age, exclusively part-time students had lower total completion rates in comparison to other enrollment intensities (Figure 11).
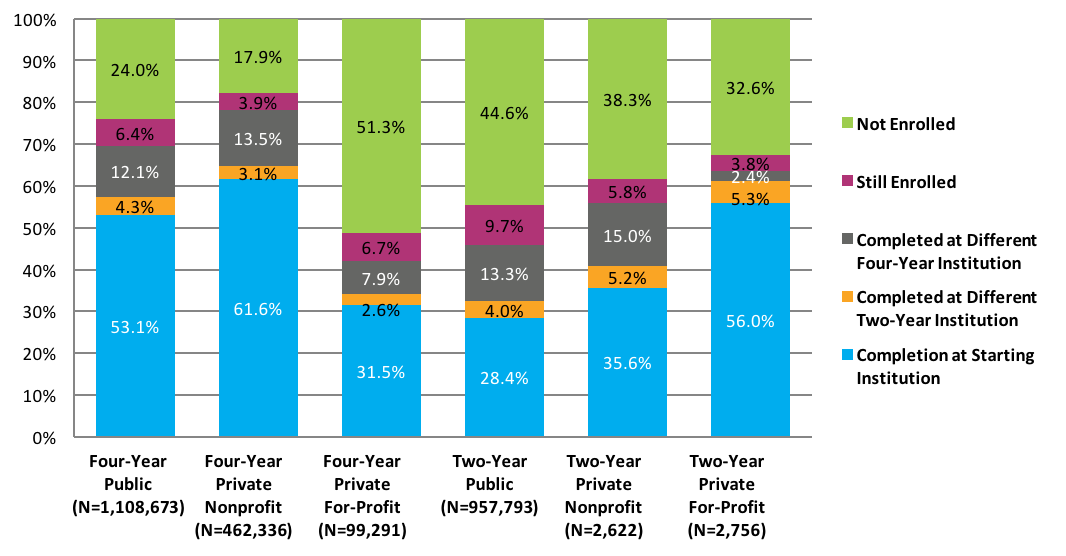
Among four-year institutions, the total completion rate was the highest for students who started at four‐year private nonprofit institutions (73.9 percent), as compared to 62.4 percent at four-year public institutions.
Figure 5. Six-Year Outcomes by Enrollment Intensity (N=2,911,634)*
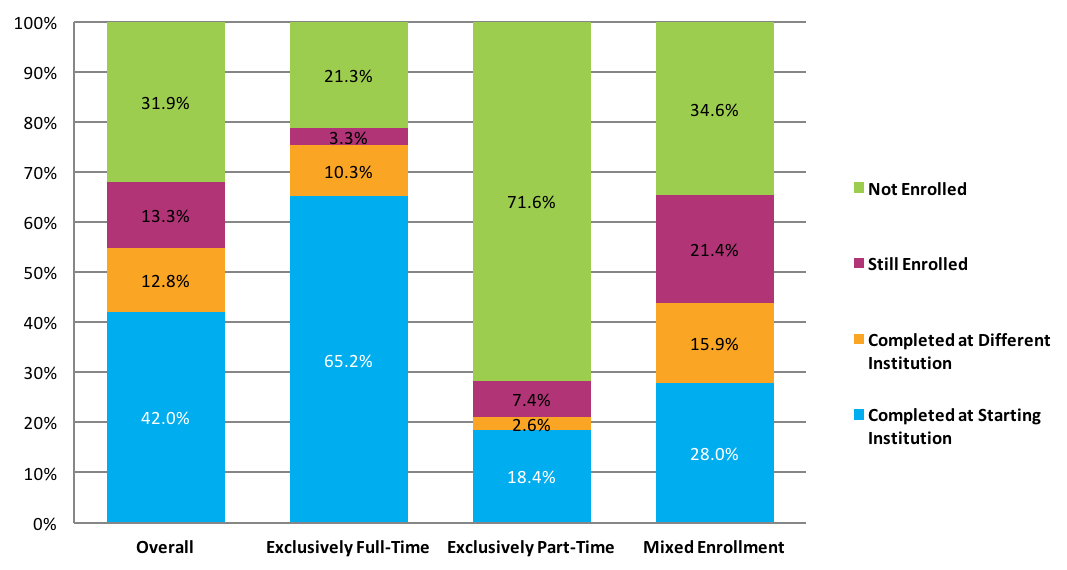
*This figure is based on data shown in Appendix C, Table 7.
Figure 6. Completion at Starting vs. Different Institution by Enrollment Intensity (N=1,594,806)*
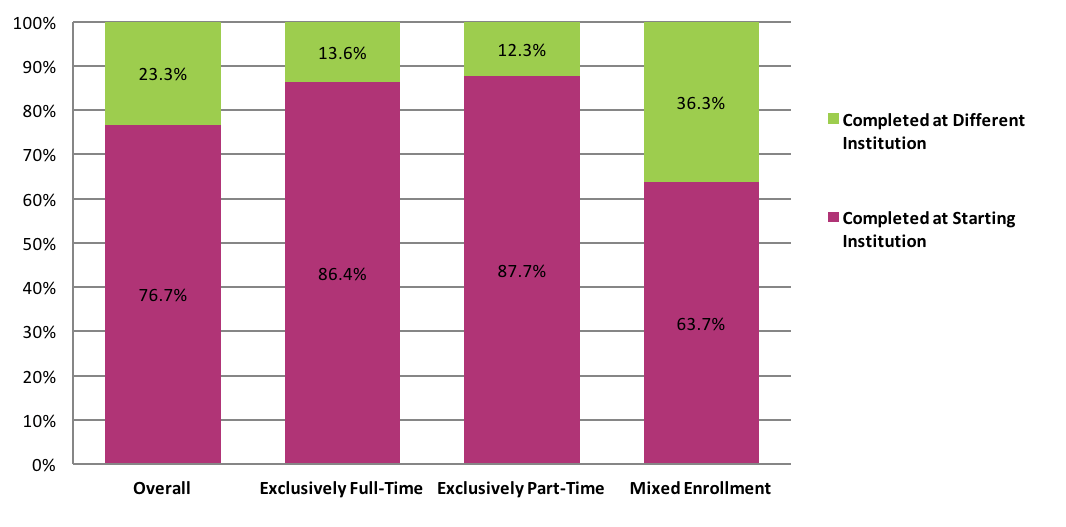
*This figure is based on data shown in Appendix C, Table 7.
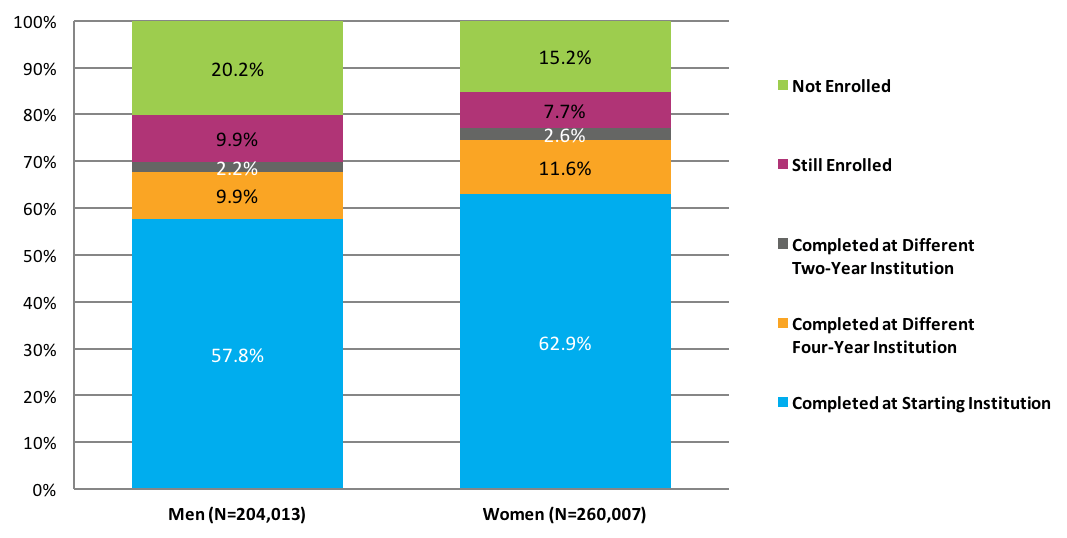
Figure 7. Six-Year Outcomes by Gender (N=2,741,024)*
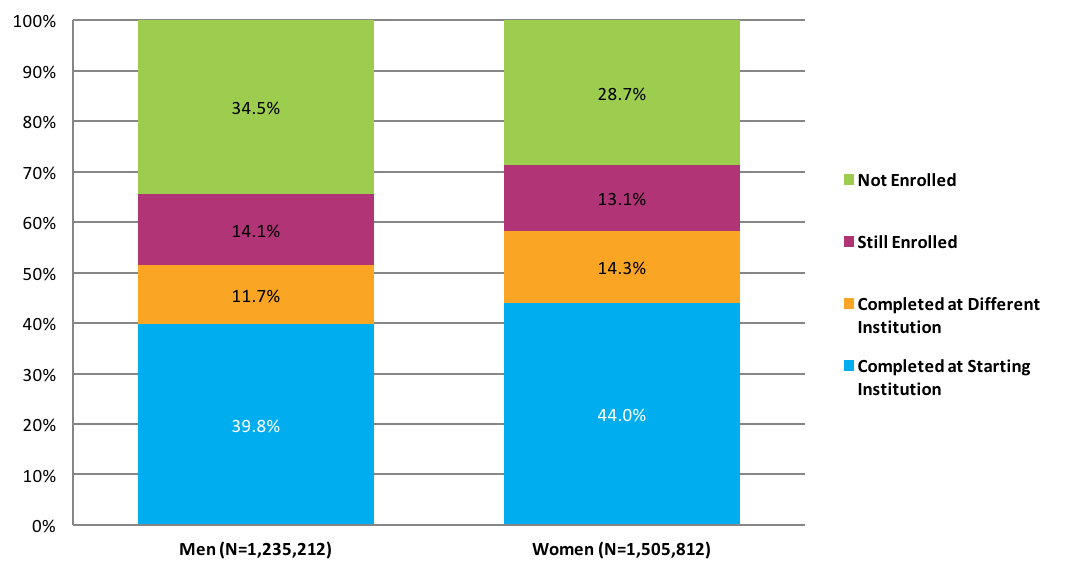
Note: Students with gender data missing were excluded from the above figure.
*This figure is based on data shown in Appendix C, Table 8.
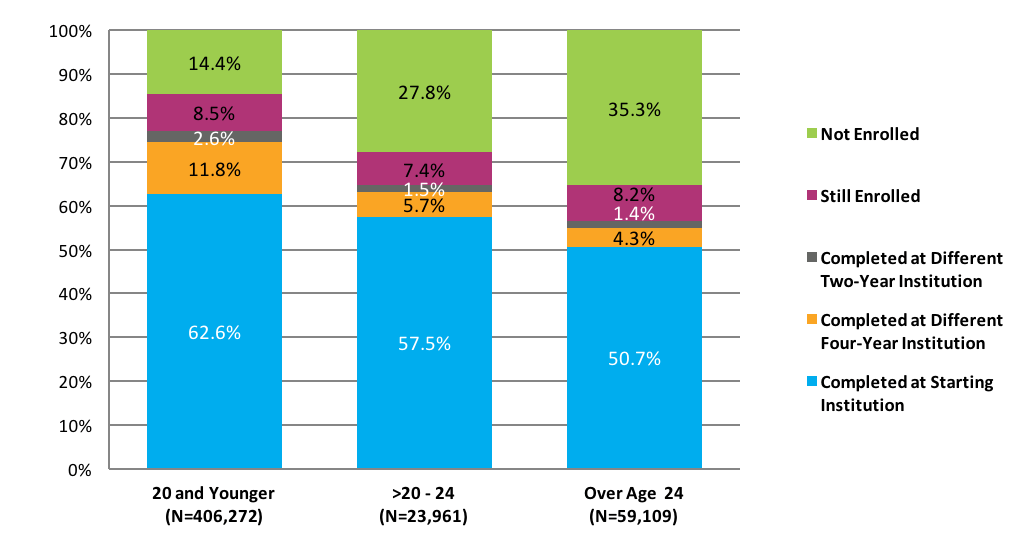
Figure 8. Six-Year Outcomes by Age at First Entry (N=2,909,368)*
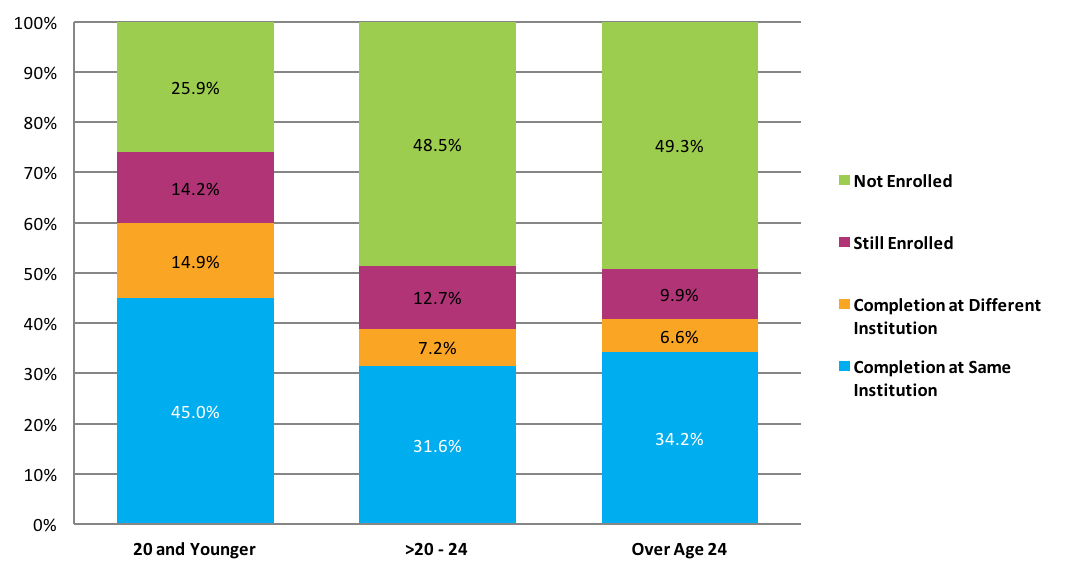
Note: Students with date of birth data missing were excluded from the above figure.
*This figure is based on data shown in Appendix C, Table 9.
Figure 9. Completion at Starting vs. Different Institution by Age at First Entry (N=1,594,366)*
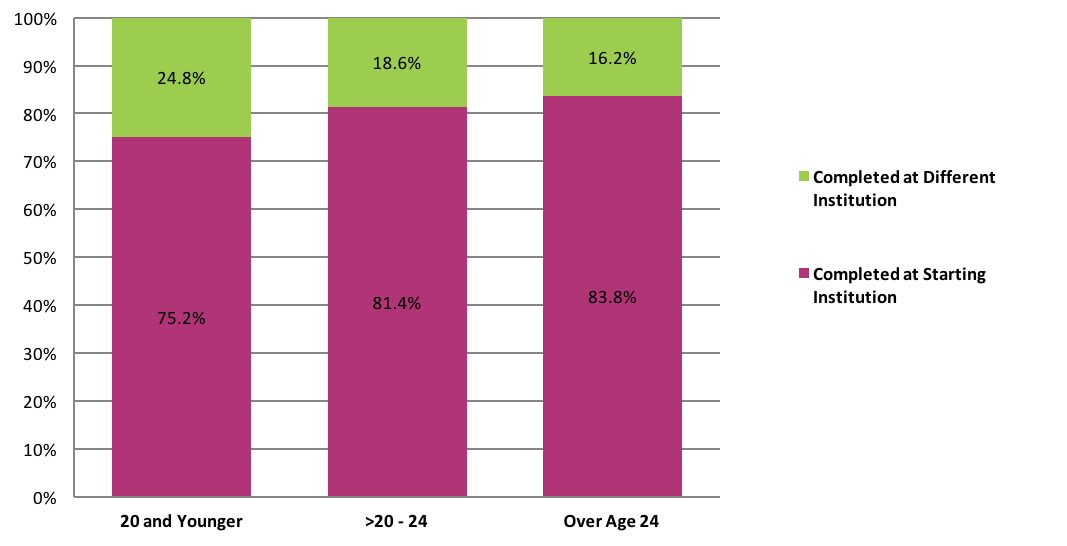
Note: Students with date of birth data missing were excluded from the above figure.
*This figure is based on data shown in Appendix C, Table 9.
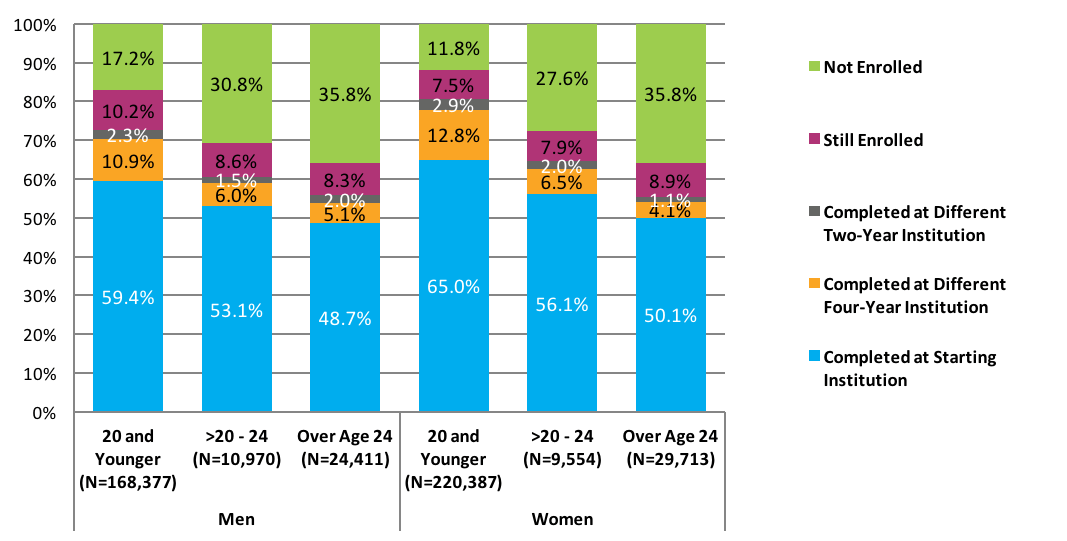
Figure 10. Six-Year Outcomes by Age at First Entry and Gender (N=2,739,008)*
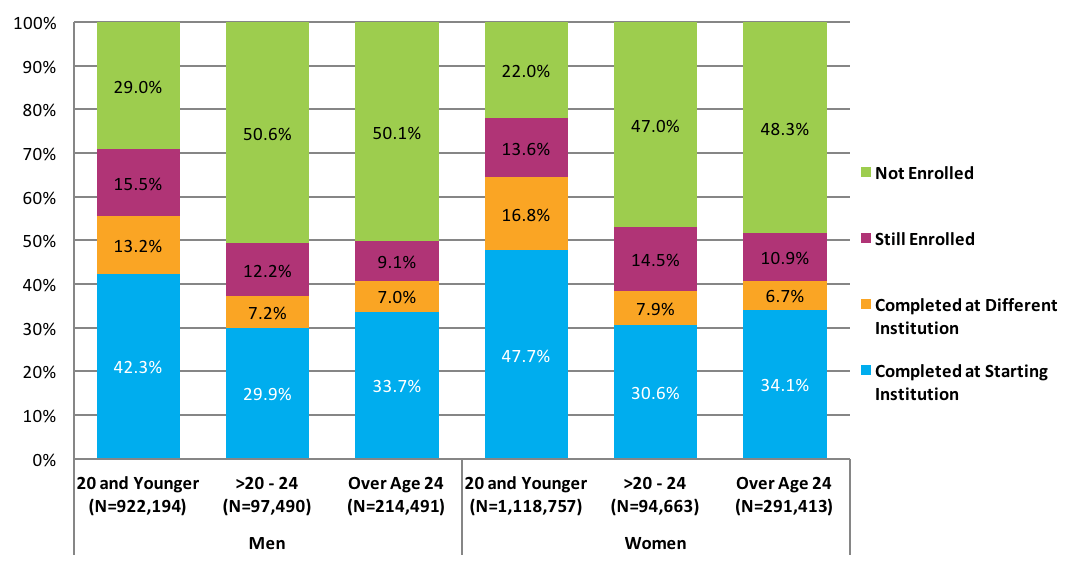
Note: Students with missing birth date and/or gender data were excluded from the above figure.
*This figure is based on data shown in Appendix C, Table 10.
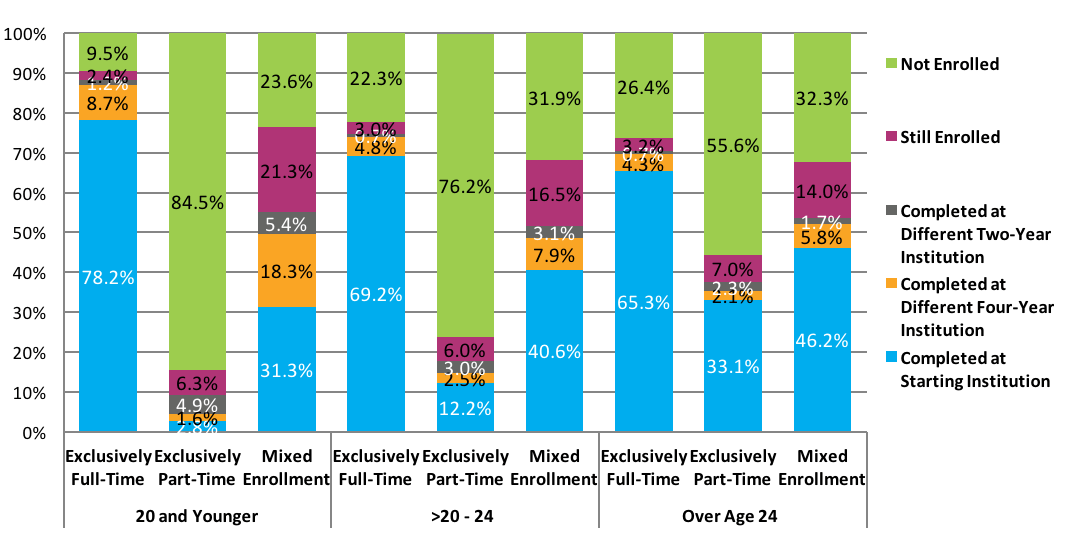
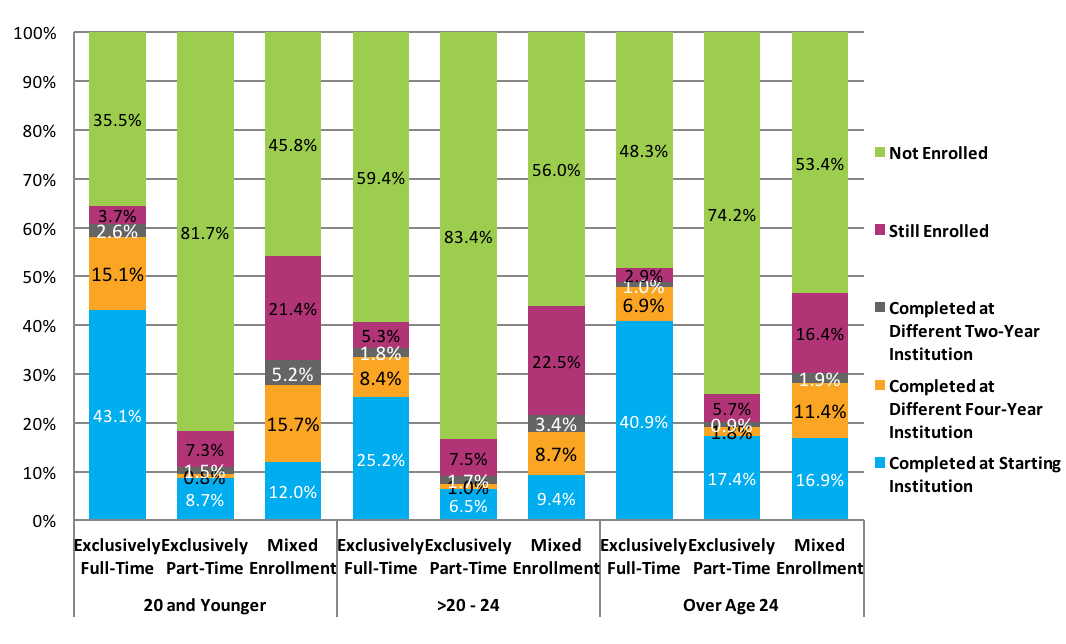
Figure 11. Six-Year Outcomes by Age and Enrollment Intensity (N=2,907,845)*
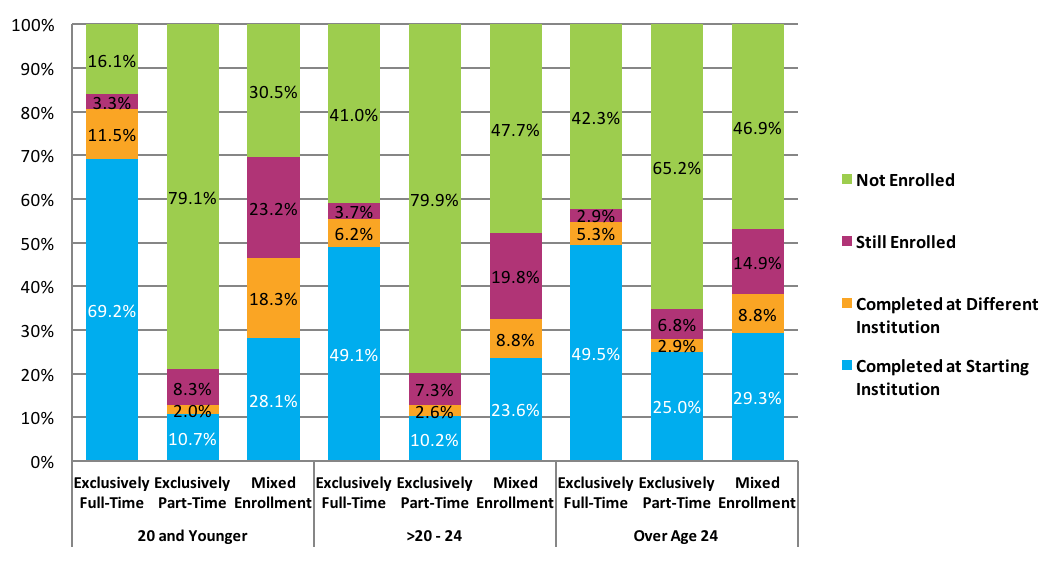
Note: Students with date of birth data missing were excluded from the above figure.
*This figure is based on data shown in Appendix C, Table 11.
Figure 12. Six-Year Outcomes by Starting Institution Type (N=2,911,634)*
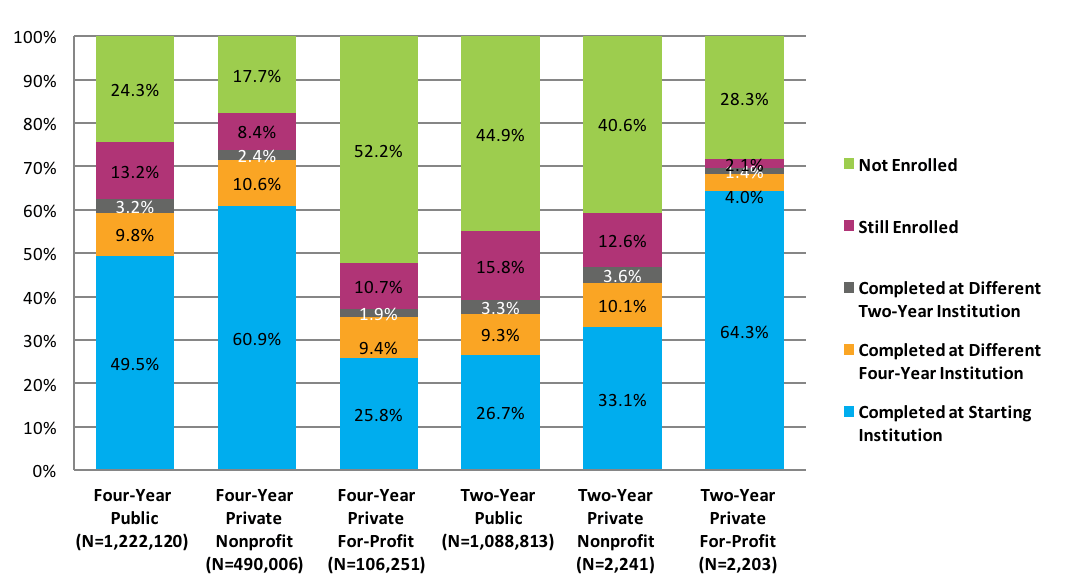
*This figure is based on data shown in Appendix C, Table 14.
Figure 13. Completion at Starting vs. Different Institution by Starting Institution Type (N=1,594,806)*
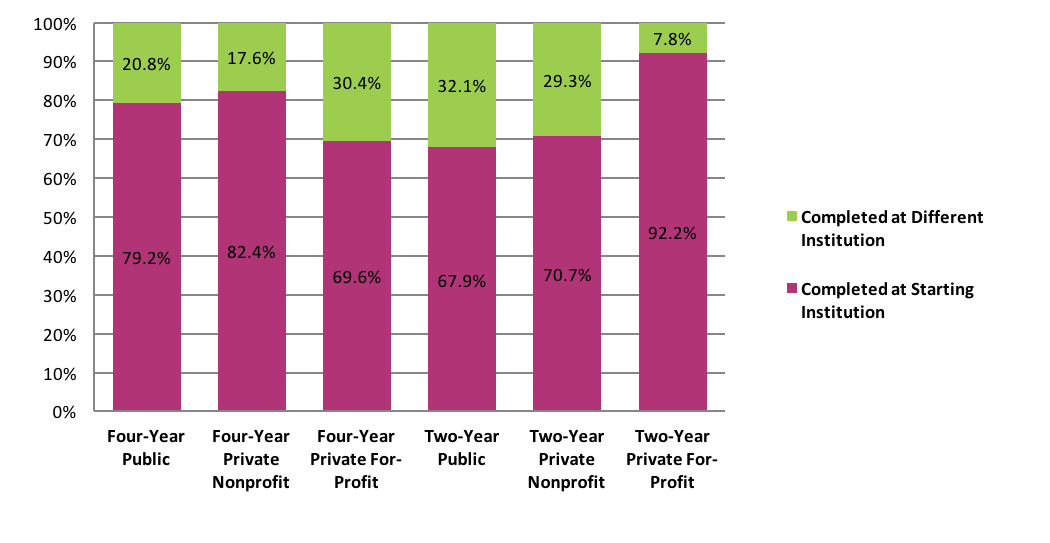
*This figure is based on data shown in Appendix C, Table 14.
Students Who Started at Four-Year Public Institutions
Figures 14 through 18 present the six‐year outcomes of students who started at four‐year public institutions.
For students who began at four-year public institutions, 62.4 percent graduated with a degree within six years, with 49.5 percent completing at their starting institution, and an additional 13.0 percent at a different institution. Among this cohort, almost one in four students were no longer enrolled at the end of the study period. Stop-out rates were lowest for exclusively full-time students compared to exclusively part-time or mixed enrollment students. Mixed enrollment students had the highest proportion (22.4 percent) of students who were still enrolled at the end of the study period (Figure 14). Among students who started at four-year public institutions a higher proportion of traditional-age students graduated with a degree (65.6 percent), in comparison to delayed entry students (50.1 percent) and adult learners (44.8 percent). In agreement with previous reports, traditional-age students had the highest completion rates, followed by delayed entry students, and then adult learners, regardless of the gender. On the other hand, female students had higher completion rates than male students among traditional-age and delayed entry students but not among adult learners, as shown in Figure 17. Part-time students had the lowest completion rates and highest stop-out rates regardless of student’s age at first entry (Figure 18), a finding that is evident in our previous completion reports
Figure 14. Six-Year Outcomes for Students Starting at Four-Year Public Institutions by Enrollment Intensity (N=1,222,120)*
*This figure is based on data shown in Appendix C, Table 15.
Figure 15. Six-Year Outcomes for Students Starting at Four-Year Public Institutions by Gender (N=1,149,202)*
Note: Students with missing gender data were excluded from the above figure.
*This figure is based on data shown in Appendix C, Table 16.
Figure 16. Six-Year Outcomes for Students Who Started at Four-Year Public Institutions by Age at First Entry (N=1,221,843)*
*This figure is based on data shown in Appendix C, Table 17.
Figure 17. Six-Year Outcomes for Students Who Started at Four-Year Public Institutions by Gender and Age at First Entry (N=1,148,947)*
Note: Students with missing birth date and/or gender data were excluded from the above figure.
*This figure is based on data shown in Appendix C, Table 18.
Figure 18. Six-Year Outcomes for Students Who Started at Four-Year Public Institutions by Age at First Entry and Enrollment Intensity (N=1,221,685)*
Note: Students with missing birth date data were excluded from the above figure.
*This figure is based on data shown in Appendix C, Table 19.
Students Who Started at Two Year Public Institutions
Figures 19 through 26 display the six‐year outcomes for students who started at two‐year public institutions.
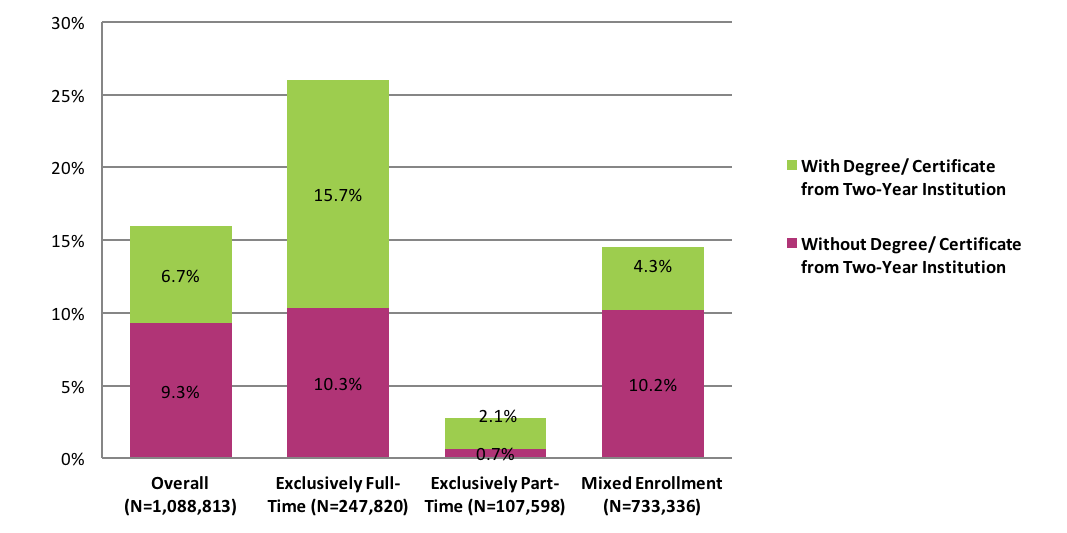
Overall, 39.3 percent of the students who started at a two-year public institution completed a degree or certificate within six years, with 26.7 percent completing at their first institution, 3.3 percent at a different two-year institution, and 9.3 at a different four-year institution. Exclusively full-time students displayed the highest total completion rate, with over half of students (54.5 percent) completing postsecondary education within six years, compared to one-fifth (20.3 percent) of exclusively part-time students, and about two-fifths (36.9 percent) of mixed enrollment students. The completion rates within six years for exclusively part-time students highlight the significance of examining this category of students over a longer duration. Consistent with previous reports (Signature 6, 8, and 10), mixed enrollment students represented the highest proportion (21.2 percent) of students who were still enrolled at the end of the six years (Figure 19). Among the students with different enrollment intensities, exclusively full-time students showed the highest rate (26.0 percent) of completion at four-year institutions, either with or without a degree or certificate from a two-year institution, compared to exclusively part-time and mixed enrollment students (Figure 20).
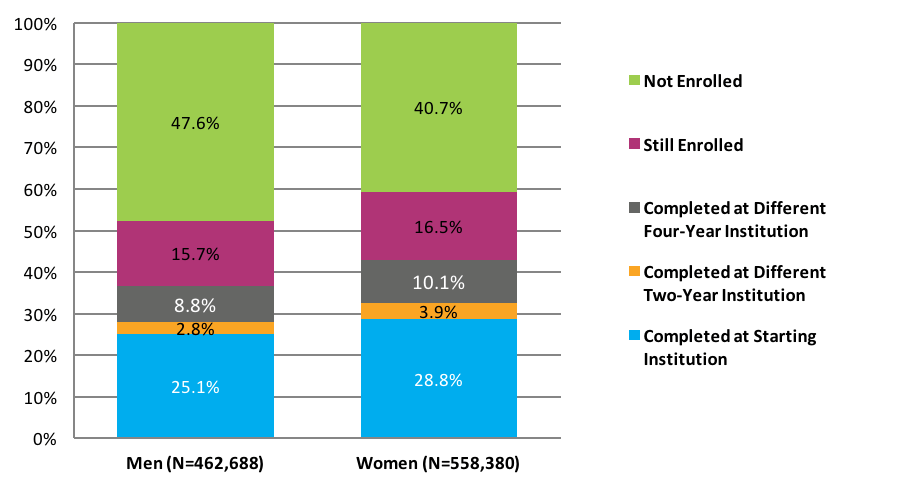
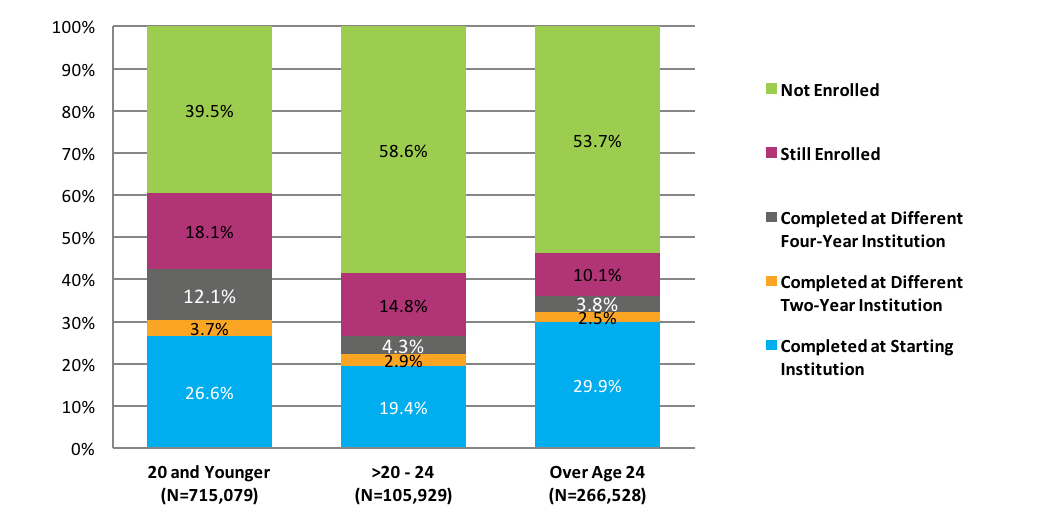
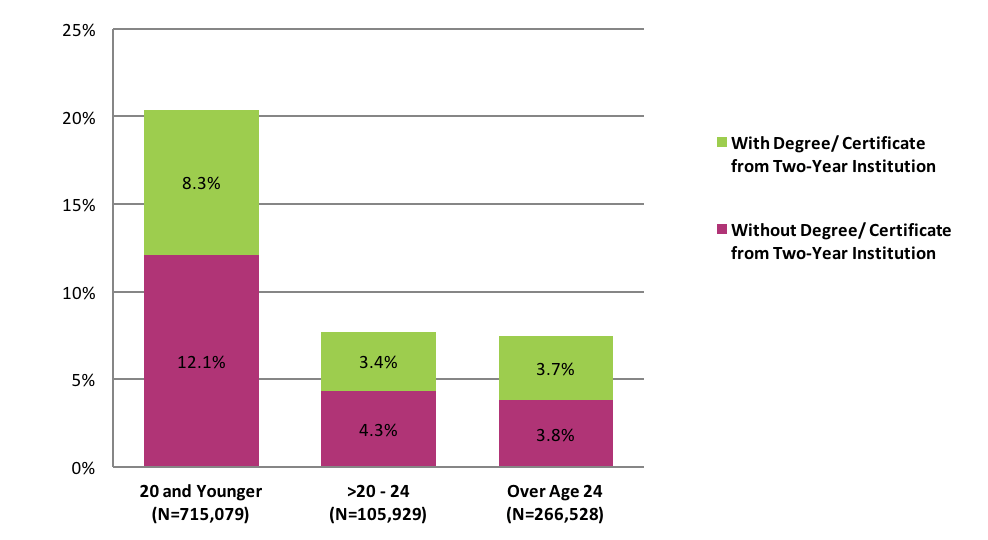
Delayed entry students had a lower completion rate (26.6 percent), compared to that of adult learners (36.2 percent). The former also had a higher stop-out rate than the latter (58.6 percent and adult learners, 53.7 percent) (Figure 22). The total completion rate of traditional-age women who started at two-year public institutions was higher (46.9 percent), as compared to their male peers (38.8 percent) of the same age group. Across all age groups, men had higher stop-out rates than women, with the largest difference of 8.2 percentage points being among traditional-age students (42.9 percent and 34.6 percent, respectively). (Figure 24). Compared to the two older age groups, a larger proportion of traditional‐age students completed at a four‐year institution. Additionally, among exclusively part-time students, adult learners had a higher completion rate, which was 12.3 percentage points higher than that of traditional-age students who were enrolled exclusively part time (Figure 25). A higher proportion of traditional-age students who enrolled exclusively full time or had mixed enrollment completed a degree or certificate at a four‐year institution than the delayed entry and adult learner students (Figure 26).
Figure 19. Six-Year Outcomes and First Completion for Students Who Started at Two-Year Public Institutions by Enrollment Intensity (N=1,088,813)*
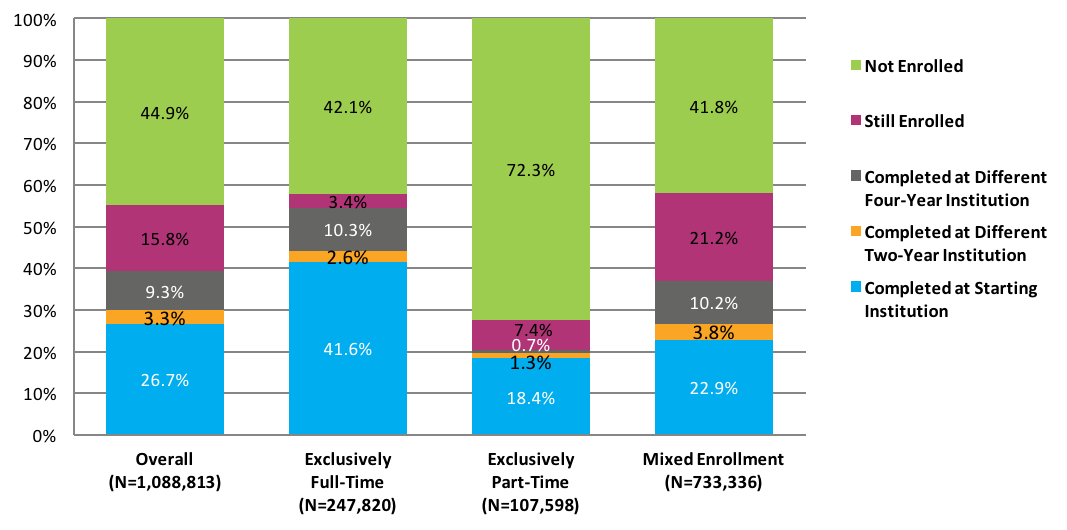
*This figure is based on data shown in Appendix C, Table 22.
Figure 20. Completion at Four-Year Institutions for Students Who Started at Two-Year Public Institutions by Enrollment Intensity (N=1,088,813)*
*This figure is based on data shown in Appendix C, Table 22.
Figure 21. Six-Year Outcomes and First Completion for Students Who Started at Two-Year Public Institutions by Gender (N=1,021,068)*
Note: Students with missing gender data were excluded from the above figure.
*This figure is based on data shown in Appendix C, Table 23.
Figure 22. Six-Year Outcomes and First Completion for Students Who Started at Two-Year Public Institutions by Age at First Entry (N=1,087,536)*
Note: Students with missing birth date data were excluded from the above figure.
*This figure is based on data shown in Appendix C, Table 24.
Figure 23. Completion at Four-Year Institutions Among Students Who Started at Two-Year Public Institutions by Age at First Entry (N=1,087,536)*
Note: Students with missing birth date data were excluded from the above figure.
*This figure is based on data shown in Appendix C, Table 24.
Figure 24. Six‐Year Outcomes and First Completion for Students Who Started at Two‐Year Public Institutions by Gender and Age at First Entry (N=1,019,956)*
Note: Students with missing birth date and/or gender data were excluded from the above figure.
*This figure is based on data shown in Appendix C, Table 25.
Figure 25. Six-Year Outcomes and First Completion for Students Who Started at Two-Year Public Institutions by Age at First Entry and Enrollment Intensity (N=1,087,477)*
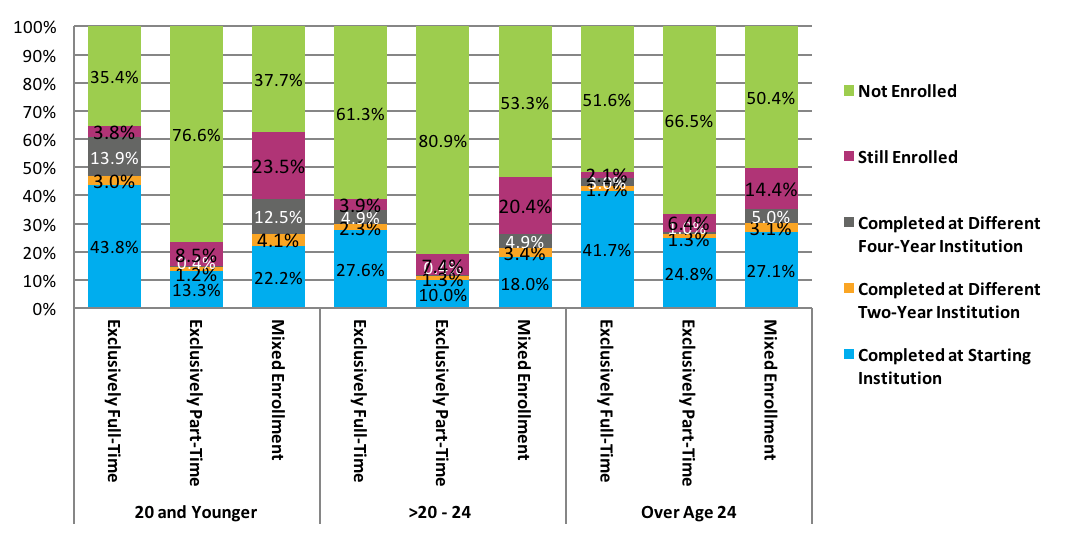
Note: Students with missing birth date data were excluded from the above figure.
*This figure is based on data shown in Appendix C, Table 26.
Figure 26. Completion at Four-Year Institutions Among Students Who Started at Two-Year Public Institutions By Age at First Entry and Enrollment Intensity (N=1,087,477)*
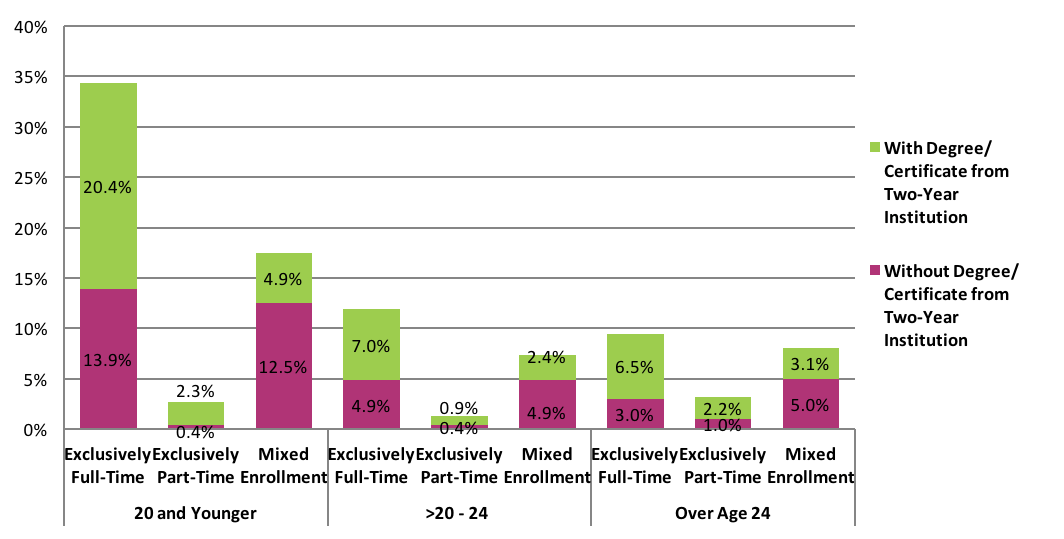
Note: Students with missing birth date data were excluded from the above figure.
*This figure is based on data shown in Appendix C, Table 26.
Students Who Started at Four-Year Private Nonprofit Institutions
Figures 27 through 31 show the six‐year outcomes for students who started at four‐year private nonprofit institutions.
Overall, 73.9 percent of the cohort completed a postsecondary credential by the end of six years (Figure 27). Women had higher completion rates (77.1 percent) than men (69.9 percent). Noticeably, a lower percentage of women (15.2 percent) compared to men (20.2 percent) had stopped out at the end of the study period (Figure 28). Traditional-age students had a higher overall completion rate and high rates of completion at their starting institutions as compared to the delayed entry and adult learner students (Figure 29). Among both men and women, traditional-age students had the highest completion rate. Among women, the completion rate for adult learners was 9.2 percentage points lower than that of their peers in the delayed entry group. The difference was 4.8 percentage points among men. (Figure 30). Age seemed to play into completion rates differently among different enrollment intensity groups: while traditional-age students had the highest completion rate among those with exclusively full-time enrollments, adult learners had the highest completion rate among students who enrolled exclusively part time (Figure 31).
Figure 27. Six-Year Outcomes for Students Who Started at Four-Year Private Nonprofit Institutions by Enrollment Intensity (N=490,006)*
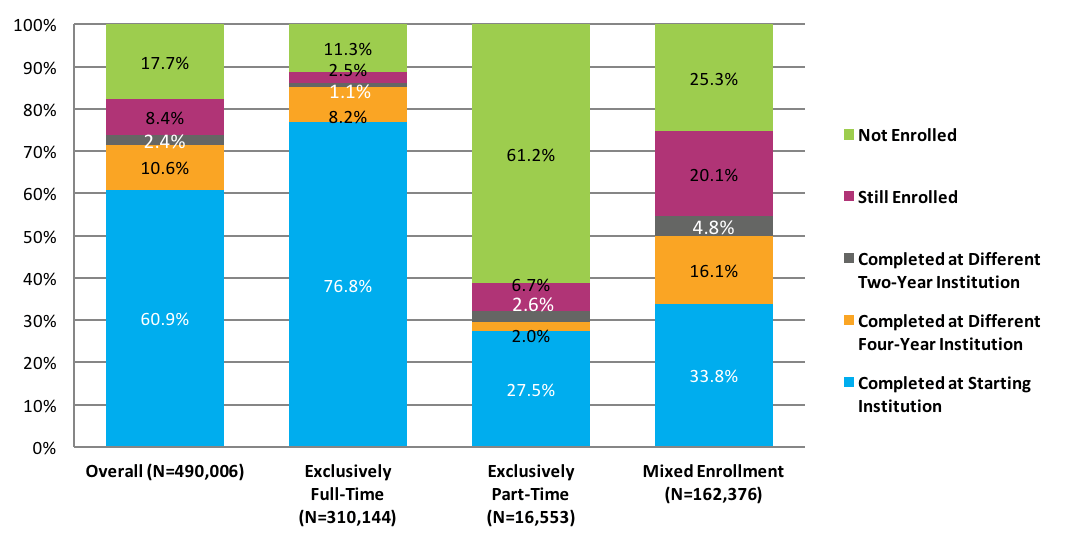
*This figure is based on data shown in Appendix C, Table 36.
Figure 28. Six-Year Outcomes for Students Who Started at Four-Year Private Nonprofit Institutions by Gender (N=464,020)*
Note: Students with missing gender data were excluded from the above figure.
*This figure is based on data shown in Appendix C, Table 37.
Figure 29. Six-Year Outcomes for Students Who Started at Four-Year Private Nonprofit Institutions by Age at First Entry (N=489,342)*
Note: Students with missing birth date data were excluded from the above figure.
*This figure is based on data shown in Appendix C, Table 38.
Figure 30. Six-Year Outcomes for Students Who Started at Four-Year Private Nonprofit Institutions by Gender and Age at First Entry (N=463,412)*
Note: Students with missing birth date and/or gender data were excluded from the above figure.
*This figure is based on data shown in Appendix C, Table 39.
Figure 31. Six-Year Outcomes for Students Who Started at Four-Year Private Nonprofit Institutions by Age at First Entry and Enrollment Intensity (N=488,410)*
Note: Students with missing birth date were excluded from the above figure.
*This figure is based on data shown in Appendix C, Table 40.
Students Who Started at Four-Year Private For-Profit Institutions
Figures 32 through 36 present the six‐year outcomes for students who started at four‐year private for-profit institutions.
The fall 2010 cohort’s overall completion rate was 37.1 percent, with 25.8 percent of the cohort completing at their starting institution and 11.3 percent at a different institution (Figure 32). When broken down by age, traditional-age students had a higher total completion rate (41.9 percent) than adult learners (37.9 percent), while delayed entry students had the lowest completion rate (26.1 percent), as shown in Figure 34. Further examination by age and enrollment intensity showed that traditional-age students who enrolled exclusively full-time had the highest completion rate (60.8 percent), which was 12.0 percentage points higher than that of adult learners who enrolled exclusively full-time (Figure 36). Additionally, disaggregating by age and gender showed that, male traditional-age students had a higher proportion (15.5 percent) of students who completed at a different four-year institution than their female peers in the same age group (Figure 35).
Figure 32. Six-Year Outcomes for Students Starting at Four-Year Private For-Profit Institutions by Enrollment Intensity (N=106,251)*
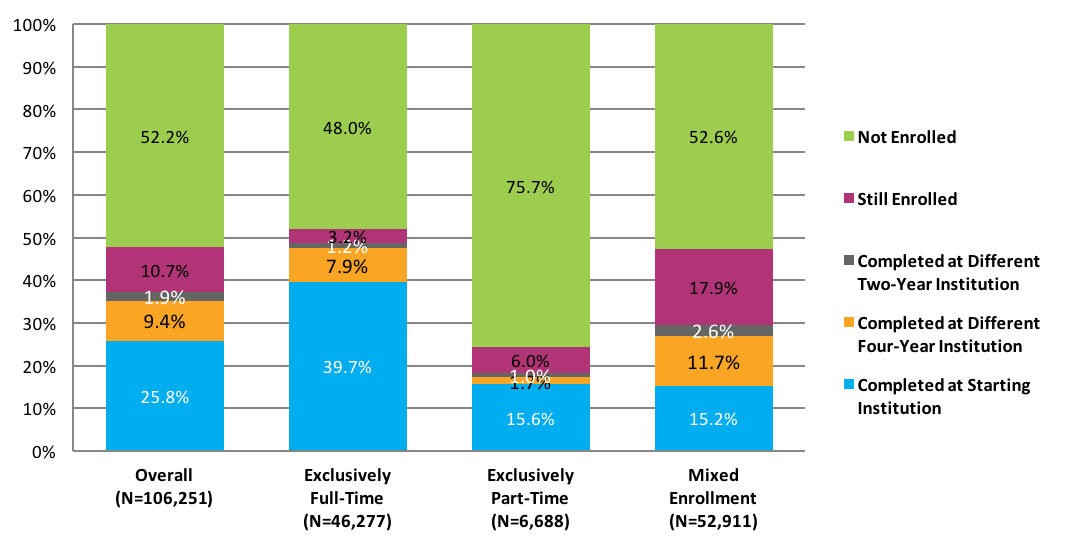
*This figure is based on data shown in Appendix C, Table 43.
Figure 33. Six-Year Outcomes for Students Starting at Four-Year Private For-Profit Institutions by Gender (N=102,587)*
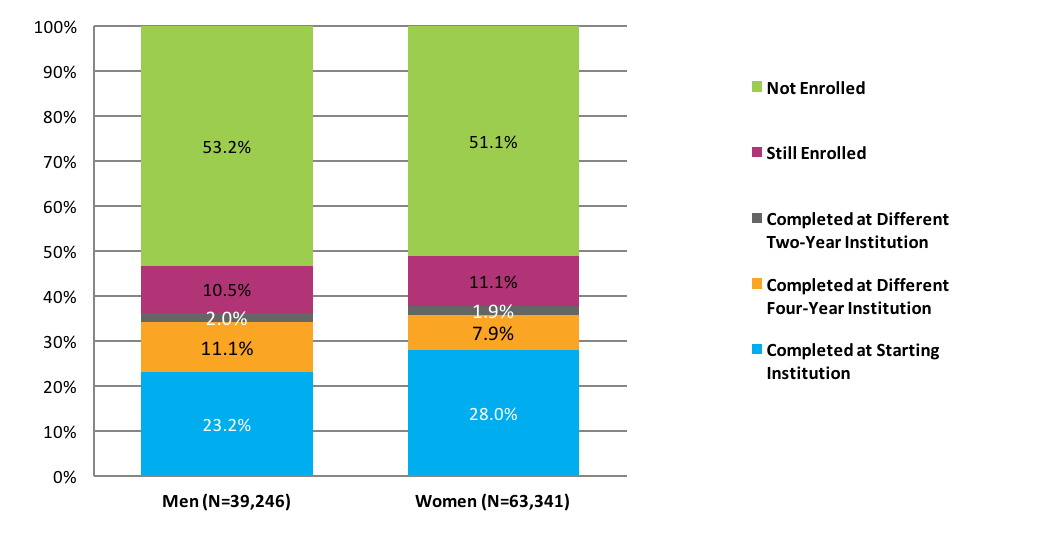
Note: Students with missing gender data were excluded from the above figure.
*This figure is based on data shown in Appendix C, Table 44.
Figure 34. Six-Year Outcomes for Students Starting at Four-Year Private For-Profit Institutions by Age at First Entry (N=106,244)*
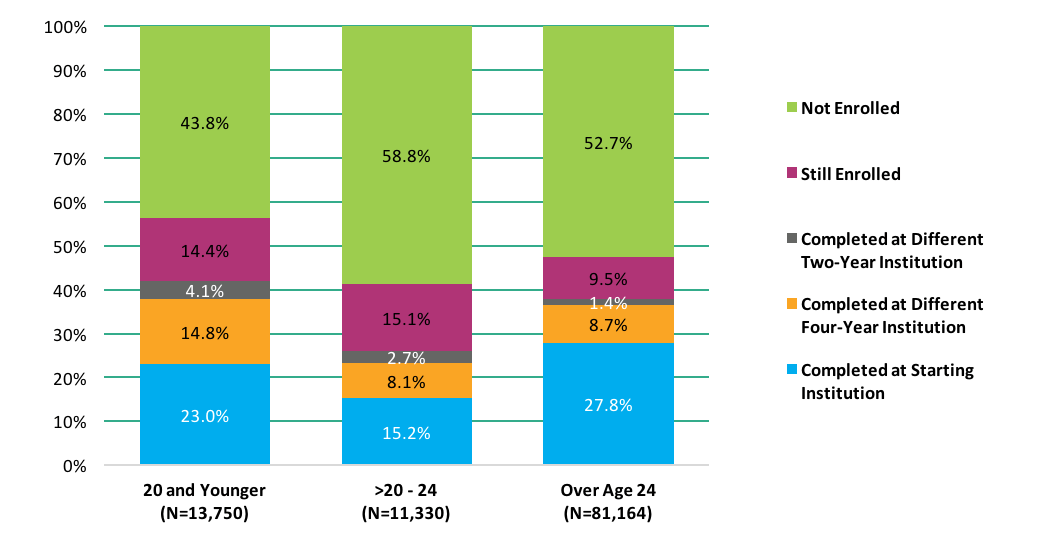
Note: Students with missing birth date data were excluded from the above figure.
*This figure is based on data shown in Appendix C, Table 45.
Figure 35. Six-Year Outcomes for Who Started at Four-Year Private For-Profit Institutions by Gender and Age at First Entry (N=102,582)*
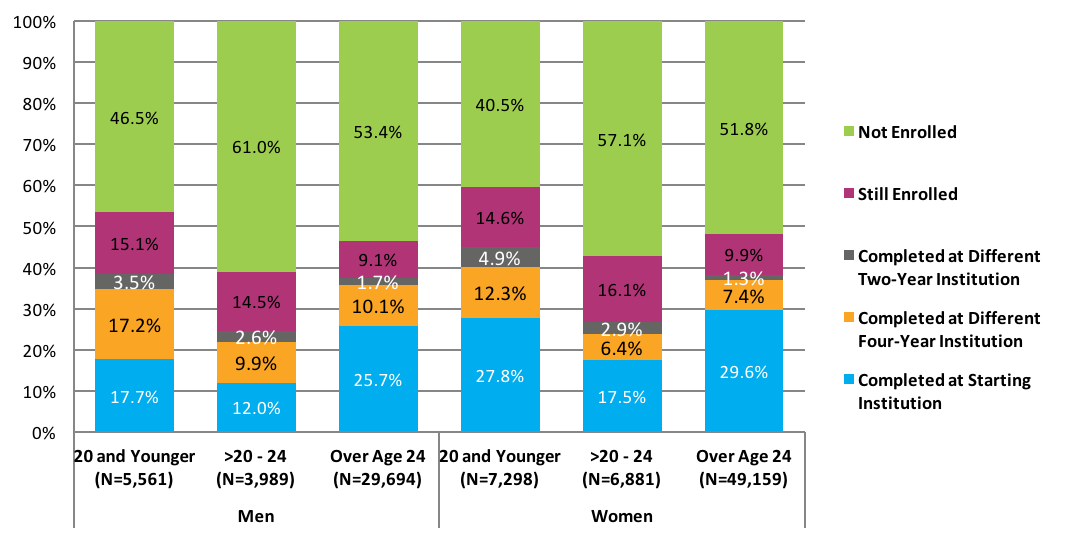
Note: Students with missing birth date data were excluded from the above figure.
*This figure is based on data shown in Appendix C, Table 46.
Figure 36. Six-Year Outcomes for Students Who Started at Four-Year Private For-Profit Institutions by Age at First Entry and Enrollment Intensity (N=105,870)*
Note: Students with missing birth date data were excluded from the above figure.
*This figure is based on data shown in Appendix C, Table 47.
Completion Across State Lines
Figures 37 through 41 present six‐year outcomes for students who completed at institutions across state lines.
Overall, 8.8 percent of the cohort completed at a different in-state institution, 3.4 percent completed at a different out-of-state institution, and 0.6 percent completed at a different multistate institution. Specifically, one-third (3.3 percent out of 10.3 percent) of exclusively full-time students who completed at a different institution did so at an out-of-state institution. Additionally, almost one-fourth (3.8 percent out of 16.0 percent) of mixed enrollment students completed at a different institution did so at an out-of-state institution. Exclusively part-time students displayed lower completion rates at a different in- and out-of-state institution (1.4 percent and 0.9 percent, respectively), in comparison to the students in other enrollment intensities (Figure 37). Women had a slightly higher completion rate (3.7 percent) at different out-of-state institutions than men (3.3 percent), as shown in Figure 38. The outcomes broken down by age and gender indicate that female traditional-age students had higher (4.3 percent) completion rates at a different out-of-state institution than their male peers (3.7 percent). Further results revealed that among adult learners, higher proportions of male students (2.0 percent) completed at a different out-of-state institution than female students (1.4 percent) (Figure 40). Traditional-age students with mixed enrollment had the highest completion rates at a different in- and out-of-state institution (11.3 percent and 3.8 percent, respectively) when comparing the results by enrollment intensity and age group (Figure 41).
Figure 37. Completion Rates at Different Institutions Across State Lines by Enrollment Intensity (N=2,811,171)*
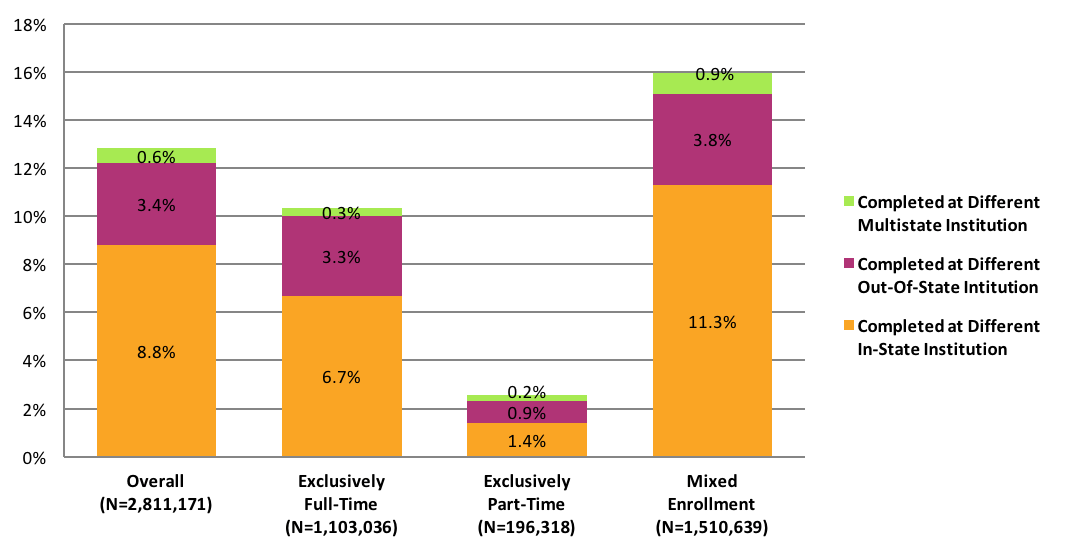
Note: Students who started at a multistate institution were excluded from the above figure.
*This figure is based on data shown in Appendix C, Table 50.
Figure 38. Completion Rates at Different Institutions Across State Lines by Gender (N=2,643,796)*
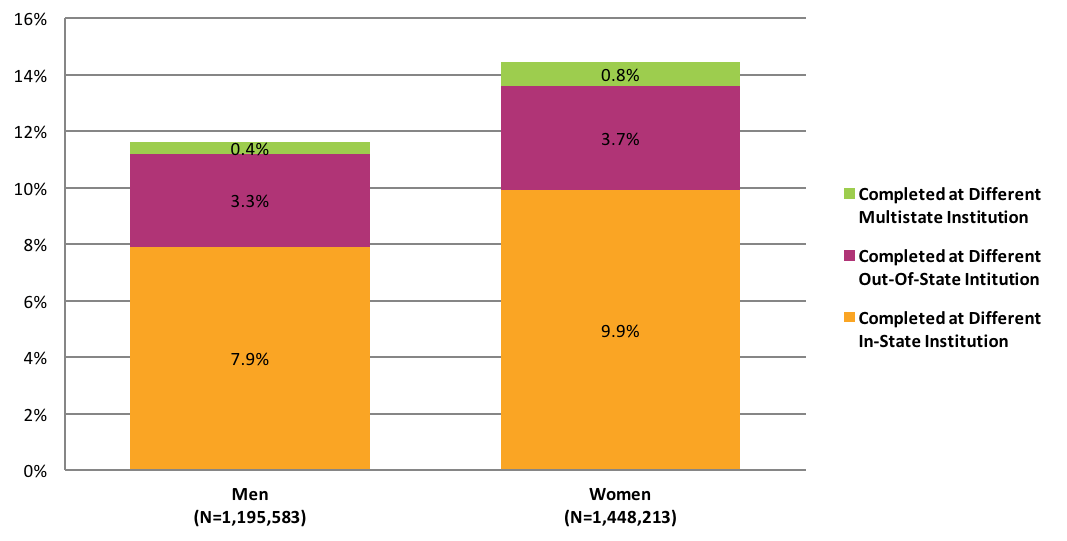
Note: Students with missing gender data missing and those who started at a multistate institution were excluded from the above figure.
*This figure is based on data shown in Appendix C, Table 51.
Figure 39. Completion Rates at Different Institutions Across State Lines by Age at First Entry (N=2,808,919)*
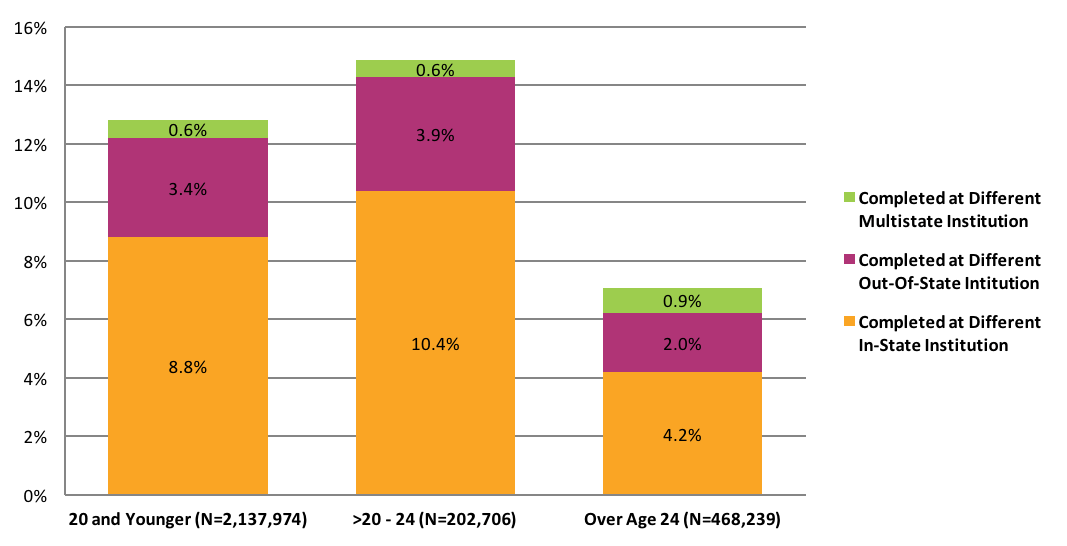
Note: Students with missing gender data missing and those who started at a multistate institution were excluded from the above figure.
*This figure is based on data shown in Appendix C, Table 52.
Figure 40. Completion Rates at Different Institutions Across State Lines by Gender and Age at First Entry (N=2,641,793)*
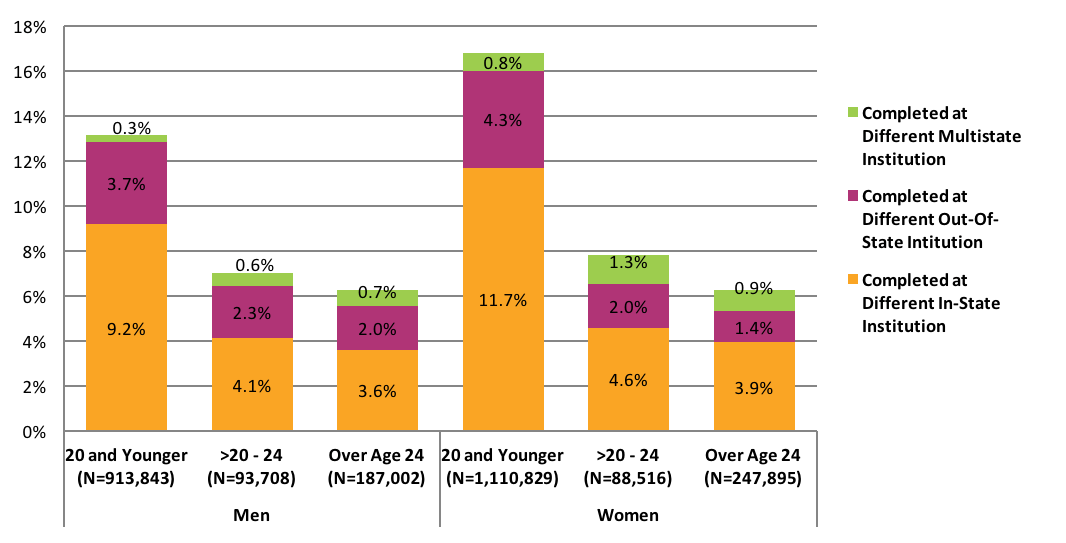
Note: Students with missing birth date and/or gender data missing and those who started at a multistate institution were excluded from the above figure
*This figure is based on data shown in Appendix C, Table 53.
Figure 41. Completion Rates at Different Institutions Across State Lines by Age at First Entry and Enrollment Intensity (N=2,807,744)*
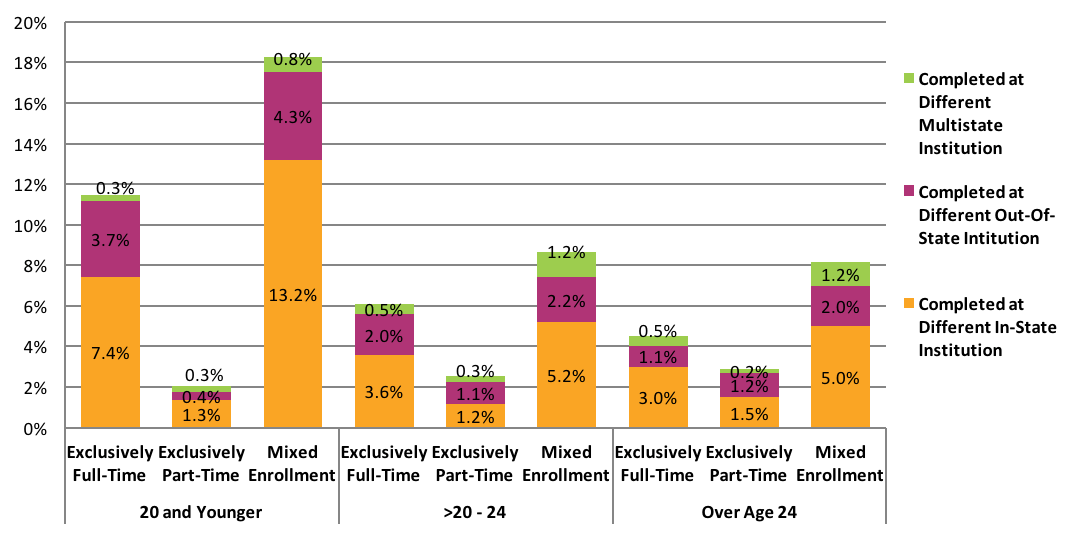
Note: Students with missing date of birth data and those who started at a multistate institution were excluded from the above figure.
*This figure is based on data shown in Appendix C, Table 54.
Supplemental Feature: Eight‐Year Outcomes for Fall 2008 Cohort
This supplemental feature focused on the findings of first-time students who began their postsecondary education in fall 2008, the cohort examined in Signature 8, published in November 2014. In this part of the report, we highlight eight-year outcomes of this cohort, as compared to their sixth year.
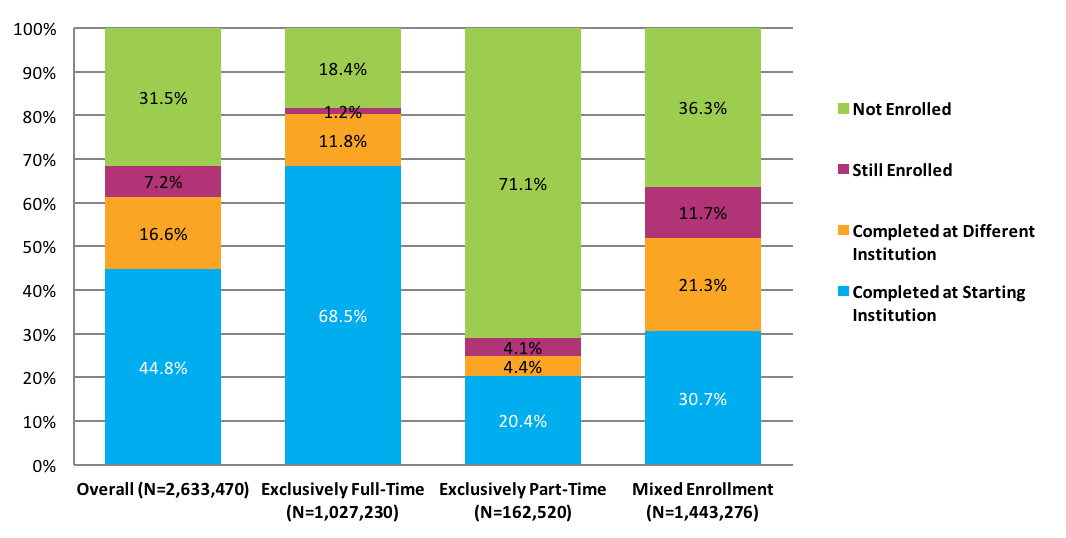
Figure S-1. Eight-Year Outcomes for Fall 2008 Cohort by Enrollment Intensity (N=2,633,470)*
*This figure is based on data shown in Appendix C, Table S-1.
Figure S‐1 shows eight year outcomes for the fall 2008 cohort, including first degree or certificate completion at starting or different institutions, continuing enrollment or stop-out during the last year of the study period. The eight-year completion rate was 61.4 percent with 44.8 percent of the cohort completing their education at their starting institution and an additional 16.6 percent completing at a different institution. In comparison to the six-year completion rate, this represented a 6.3 percentage point increase in total completions.
The eight-year completion rate for exclusively full‐time students was 80.4 percent, which included 11.8 percent who completed at institutions other than their starting institution.
The total completion rate increased from 21.0 percent in the sixth year to 24.8 percent in the eighth year for exclusively part-time students. The percentage of students who were still enrolled declined from 10.4 percent to 4.1 percent, increasing the stop-out rate from 68.5 percent in the sixth year to 71.1 percent in the eighth year.
The increase in completion rates from six to eight years was the largest for mixed enrollment students: with an additional 9 percentage point increase the eight-year completion rate was 52.0 percent. The percentage of students who were still enrolled went down more than twice (from 23.7 to 16.2 percent), leaving the percentage of those who stopped out by the eighth year at 36.3 percent.
Completion at Starting vs. Different Institution
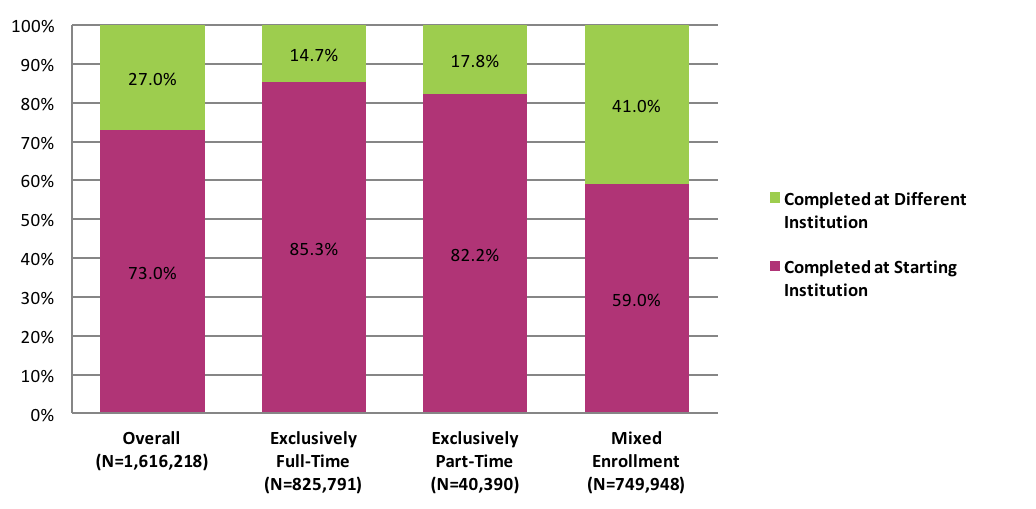
Figure S-2 shows the proportion of completers who completed a postsecondary credential from their starting institution versus a different institution for each enrollment intensity group. Regardless of the enrollment intensity, the proportion of students who completed at an institution other than their starting institution increased from the sixth to the eighth year. Overall, more than one in four students completed their first degree at a different institution in the eighth year (27 percent). The proportion of completions happening elsewhere in the sixth year was 23.6 percent for this cohort. Among students with mixed enrollment, about two in five students (41.0 percent) completed at an institution other than the one where they first enrolled: a little over one in three mixed enrollment students completed elsewhere at the end of the sixth year.
Figure S-2. Eight-Year Completion Outcomes at Starting vs. Different Institution by Enrollment Intensity for Fall 2008 Cohort (N=1,616,218)*
*This figure is based on data shown in Appendix C, Table S-1.
Outcomes by Age at First Entry
Figure S-3. Eight-Year Outcomes for Fall 2008 Cohort by Age at First Entry (N=2,625,337)*
Note: Students with date of birth data missing were excluded from the above figure.
*This figure is based on data shown in Appendix C, Table S-2.Figure S-3 shows eight-year outcomes for the 2008 fall cohort disaggregated by age at first entry. Among traditional-age students, the total completion rate increased by 6.8 percentage points between the sixth (59.3 percent) and eighth-year (66.1 percent), which was the largest increase as compared to delayed entry students (5.5 percentage points, from 38.3 to 43.8 percent), and adult learners (4.4 percentage points, from 42.1 to 46.5 percent).
Outcomes by Starting Institution Type
Figure S-4. Eight-Year Outcomes by Starting Institution Type (N=2,633,470)*
*This figure is based on data shown in Appendix C, Table S-3.
Figure S-4 breaks down the eight-year outcomes for the 2008 fall cohort by type of institution at first entry. Increases in the total completion rates were observed for students in all types of institutions. The highest increase was among students who started in four-year public institutions, a gain of 6.7 percentage points, followed by two-year public institutions (6.6 percentage points). While four-year private nonprofit institutions showed the highest total completion rate in the eighth-year (78.2 percent), their completion rate increased by only 4.6 percentage points from six to eight years.
At four-year institutions, the stop-out rate was the highest among students who enrolled at four-year private for-profit institutions. One in two students dropped out during the eighth year, compared to one in five students at four-year public institutions.
Discussion of Results for the 2010 Cohort and Changes from the 2009 Cohort
In our previous national college completions report, published in November 2015, we studied the cohort of students who entered college in fall 2009. The report showed the continuing effects of the recent recession: the cohort was larger than that of the previous year, had more adult learners, more students in community colleges and for-profit institutions, and more part-time students. Although the official end of the Great Recession is considered to be June 2009 (National Bureau of Economic Research, 2010), its effects on employment, wages, and family finances have lingered far beyond, impacting students, colleges, and states to this day. The cohort in this year’s report, still at slightly over 2.9 million, stayed nearly unchanged in overall size, but there was a marked shift in enrollment destinations: two-year public institutions and four-year for-profit institutions decreased by 2 percent and 11 percent, respectively; while four-year public institutions increased by 3 percent. The cohort also had slightly more traditional-age students compared to the previous year.
Increase in Overall Completion Rates After Two Years of Decline
Figure D1: Six-Year Completion Rates for All First-Time Students in All Institutions
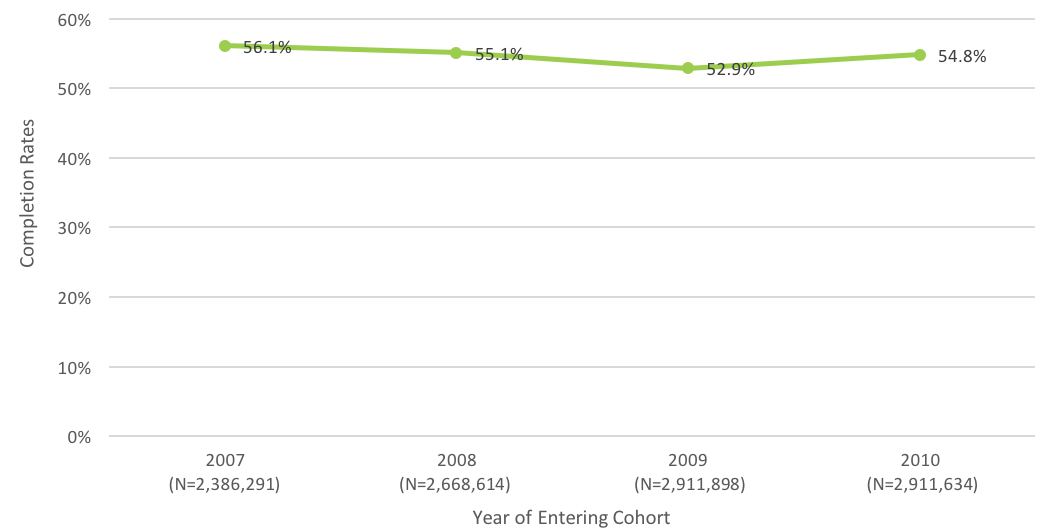
The overall national six-year completion rate for the fall 2010 cohort was 54.8 percent, an increase of 1.9 percentage points from the fall 2009 cohort. This counts all first-time students, regardless of institutional sector or enrollment intensity. This rate represents a recovery nearly to the level of the fall 2008 cohort (55.1%), but remains more than a percentage point below the high of 56.1 percent for the pre-recession 2007 cohort. The 2010 cohort’s higher rate of completion represents about 55,000 more graduates than the fall 2009 cohort, even though both were almost exactly the same size to begin with.
A small decrease, less than one percentage point, was observed in the percent of students who were still enrolled in their sixth year without having earned a degree. With more students graduating and fewer still enrolled, the share of students stopping out (no degree and no enrollment in the sixth year) decreased by 1.1 percentage points, from 33.0 percent to 31.9 percent.
Examining the rates by age and enrollment intensity reveals that all student populations experienced increases in their completion rates. Some groups had larger increases than others. In particular, delayed-entry students and exclusively full-time students experienced large increases in completion rates.
Increases in Completion Rates Across Ages and Enrollment Intensities
The report divides students into three age groups: those who began postsecondary education immediately after high school (age 20 or younger), those who delayed entering college for a few years (over age 20 through 24), and adult learners (over age 24). Completion rates increased for the delayed entry group by 5.2 percentage points, from 33.6 to 38.8 percent, bringing the completion rate to where it was for the fall 2008 cohort. This is a very small cohort, however, so larger variability in outcomes is to be expected. Traditional-age students and adult learners experienced increases as well, 1.3 and 1.4 percentage points, respectively.
Consistent with last year’s results, we found that students enrolling exclusively part-time had by far the lowest completions rates, but that disaggregating by both age and enrollment intensity revealed part-time enrollment to be less of a disadvantage to older students than to younger students. Exclusively part-time students over age 24 again showed a higher completion rate than did the part-time students in either of the two younger age groups. This is an inversion of the pattern for full-time and mixed enrollment students for whom the younger groups consistently complete at higher rates than older students. Among exclusively part-time students, the completion rate for adult learners was more than twice as high as for delayed entry or traditional-age students (28.0 percent, 12.8 percent, and 12.7 percent, respectively). These group differences highlight the importance of targeting and differentiating efforts for improving student outcomes, whether through institutional or public policy initiatives, so that they align with the needs of different types of students.
Completion Rates Increase for Students Who Started at Four-Year Public Institutions
For students who started at four-year public institutions, the completion rate for the fall 2010 cohort increased 1.2 percentage points compared to that of fall 2009 cohort (62.4 percent and 61.2 percent). The increase was mostly attributable to students who graduated from their starting institution. The largest increase occurred among mixed enrollment students (1.1 percentage points) followed by exclusively full-time students (0.7 percentage points) and exclusively part-time students (0.6 percentage points).
Students in the delayed entry group had the largest increase in completion rates (from 43.1 percent to 50.1 percent), followed by adult learners (from 42.6 percent to 44.8 percent). Traditional-age students in this sector, meanwhile, had only a slight increase of 0.7 a percentage point.
Increases in Completion Rates for Students Who Started at Two-Year Public Institutions, Including Completions at Four-Year Institutions
The total completion rate for two-year starters, regardless of whether the completion occurred at a two-year or four-year institution, increased by slightly more than one percentage point, from 38.1 percent for the fall 2009 cohort to 39.3 percent for 2010 students. A 0.7 percentage point increase occurred among students completing at the same institution, increasing the same institution completion rate from the fall 2009 cohort’s 26.0 percent to 26.7 percent this year. The percentage of those who completed their first degree at a transfer institution also increased, going from 12.1 percent to 12.6 percent. A slightly larger percentage completed a bachelor’s degree after an associate, resulting in the total four-year degree completion rate increasing 0.9 percentage points. Traditional-age students had a 1.7 percentage point increase in their completion rate (42.4 percent and 40.7 percent, respectively). Delayed-entry students also saw an increase in their completion rate, which grew 1.5 percentage points (26.6 percent and 25.2 percent, respectively). Adult learners’ completion rate decreased slightly, from 36.5 percent to 36.2 percent.
In addition to examining the overall completion rates of students who started at two-year public institutions, we also looked specifically at their completions at four-year institutions. This rate, including those who completed with and without first earning a degree at a two-year institution, increased slightly. In total, 16.0 percent of two-year starters had completed a degree at a four-year institution by the end of the study period, up from 15.1 percent for the fall 2009 cohort and very close to the completion rate for the fall 2008 cohort (16.2 percent).
Completion Rates Increase at Four-Year Private Nonprofit Institutions
The completion rate for students who started in four-year private nonprofit institutions in fall 2010 increased to 73.9 from the fall 2009 cohort’s 71.5 percent. The size of the cohort for this sector increased slightly by 1.1 percentage points. Disaggregated by age, we observed a 2.4 percent increase in the number of traditional-age students and a large decrease (7.1 percent) among adult learners in the cohort. Much of the improvement in completion rates was attributable to older students: the increase for traditional age students, by far the largest segment of the cohort, increased by just one percentage point, from 76.0 to 77.0 percent.
Completion Rates Improved for Students Who Started at Four-Year For-Profit Institutions
After dramatic declines in the six-year completion rates of the previous two cohorts, the rate rebounded somewhat for those who started in four-year for-profit institutions in 2010.
In last year’s report, we found a 5.6 percentage point decrease for the fall 2009 cohort from that of the previous year (from 38.4 to 32.8 percent). The completion rate went up this year, to 37.1 percent for the fall 2010 cohort. The percentage who stopped out or dropped out without a degree or certificate decreased from 56.1 percent for the fall 2009 cohort to 52.2 percent for this year’s cohort.
The size of the cohort for this sector declined dramatically, by 11 percent. Most of the decline occurred among delayed entry students (21 percent) and adult learners (13 percent), who make up by far the largest share of the cohort, rather than among traditional-age students (6 percent).
Eight-Year Outcomes for Fall 2008 National Cohort
We examined eight-year outcomes for the fall 2008 cohort, tracking their enrollment patterns through spring 2016. With the two extra years, an additional 6.4 percent of the cohort completed degrees (compared to the six-year completion rate for the same cohort). This brought the total completion rate to 61.4 percent, including 44.8 percent who completed at their starting institution and an additional 16.6 percent who completed at a transfer institution. At the same time, the percentage of students who were still enrolled at the end of the eight-year period was 7.6 percentage points lower than at the six-year period (7.2 percent and 14.7 percent, respectively).
Results show that students who required the two extra years to complete their first degree were slightly more likely to do so at a different institution than at the institution where they started: the completion rate for these late finishers was 2.8 percentage points higher at the starting institution and 3.6 percentage points higher at a different institution.
Among students with mixed enrollment intensities, the eight-year total completion rate showed a marked increase over the six-year completion rate for the same cohort (52.0 percent and 43.0 percent, respectively). For exclusively part-time students the eight-year completion rate was 3.8 percentage points higher than the six-year completion rate (24.9 percent and 21.0 percent, respectively).
Examining the increases in the completion rate from six years to eight years by age revealed large increases for all age groups. The eight-year completion rate had about an 11 percent increase over the six-year rate for traditional-age students, a 14 percent increase for delayed entry students, and a 10 percent increase for adult learners.
Completion Rates for Exclusively Full-Time Students
Figure D2. Total Completion Rates for Exclusively Full-Time Students by Level of Starting Institutions (N=1,149,649)*
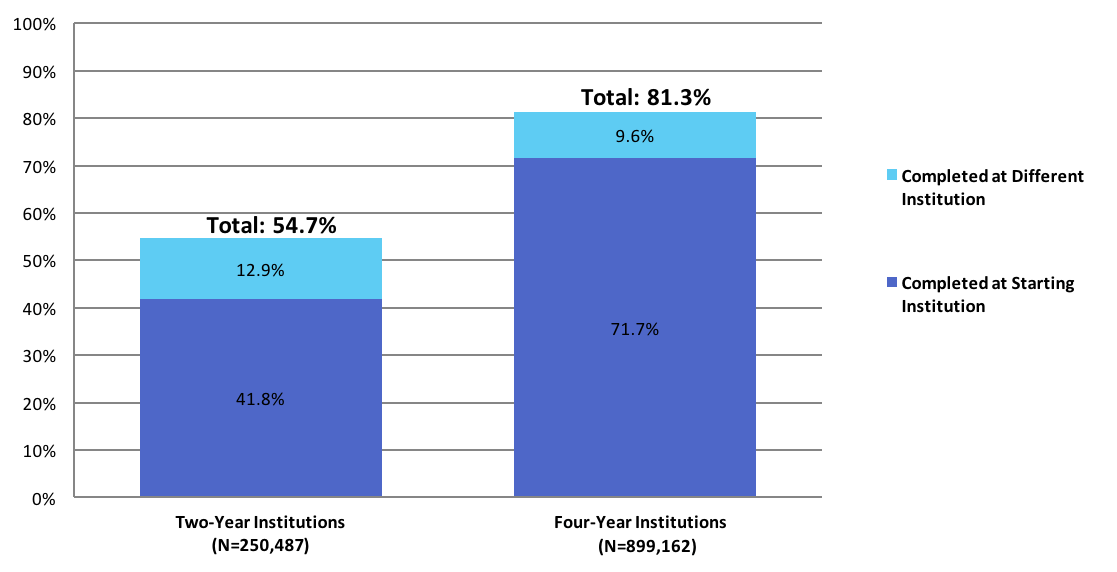
This figure is based on data shown in Appendix C, Table 7a and Table 7b.
In all our reports, we emphasize the need for developing multiple measures of successful postsecondary outcomes that capture the complexity of today’s student pathways and institutional categories. There is also a place, however, for concise snapshots of how our nation is doing at creating student success as a whole. We know that students frequently change institutions and enrollment intensity, for example, but overall 54.8 percent complete a degree within six years.
There is an often cited result that “the 6-year graduation rate for first-time, full-time undergraduate students who began their pursuit of a bachelor’s degree at a four-year degree-granting institution in fall 2008 was 60 percent.” (U.S. Department of Education, 2016). This percentage is commonly perceived as the overall success rate for college students. The latest available information for two-year institutions is the three-year graduation rate for first-time, full-time degree/certificate-seeking students in fall 2010, which is 29.4 percent.
Our findings show much higher completion rates. As shown in Figure D2, 81.3 percent of full-time students who start in a four-year institution complete a degree within six years. Among two-year starters, exclusively full-time students had a 54.7 percent completion rate within six years. Nearly one in four of these completers finished in an institution other than the starting institution.
These higher rates are due mainly to three reasons:
- We include completions at all institutions, not just those where students started. This is a true national success rate for students, not an aggregate of institutional graduation rates for individual colleges.
- We define students as full-time if they attended full time in all enrolled terms, not just the first one (they may have stopped out, but they did not drop to part time).
- This is a six-year rate, even for students starting at two-year institutions. Most students entering community colleges say that a bachelor’s degree is their goal. They should have time to reach it before we stop counting.
Of course, most students are not full-time all the time. Even among those who start full time, most do not stay full time. They drop to part time for many reasons, but more often related to work, financial, or family constraints than to academic ones. For two-year starters, the group measured in our exclusively full-time rates includes only about 250,000 students, or a quarter of the entire cohort. For four-year starters, it is about 900,000 students, or half of the cohort. Still, for a student seeking to know, “what are my chances of graduating if I go to college full-time?” this is the best available measure.
For a more complete picture than this single snapshot, we offer the detailed metrics presented throughout the report. They show the outcomes for the full range of student enrollment behaviors and institutional pathways that we observe in higher education today.
Implications for Policy
In previous reports we observed the effects of the Great Recession on higher education: surges in enrollments, particularly among adult and part-time students, followed by declines in completion rates. Institutions actually graduated more students during these years, due to the larger starting cohorts, but completion rates declined at the national level and for every institution type and all student subgroups. In this year’s cohort we observed a partial reversal of these trends: dramatic increases in enrollments appear to have leveled off and completion rates are recovering some ground. For two-year institutions that could point to overcrowded classrooms to help explain lower completion rates in the previous years, the higher rates for this year’s smaller cohort were perhaps to be expected. For four-year public and non-profit institutions, however, the rebounding completions rates accomplished with continuing increases in enrollment are a surprising result.
To the extent that institutions may have been able to leverage improvements in student-serving programs, we should expect the upward trend to continue in the coming years. That is because increases in completion rates occurred this year for all students, regardless of their enrollment intensity category (exclusively full-time, exclusively part-time and mixed enrollment). Increases were also observed in completion rates for both traditional-age students and adult-learners.
Still, large differences in completion rates continue to exist based on student enrollment behaviors, such as part-time and mixed enrollment intensities, delayed entry (older students) choice of institution type, and transfer and mobility among multiple institutions. The effects of these factors on completion rates will continue to depend upon the future states of affordability, demographics, and the labor market that influence when, where, and how students attend college.
Using student-level data to disaggregate results for different types of students in different types of institutions enables a deeper understanding of the changes for the 2010 cohort in comparison with the previous cohorts. We hope the report serves as guide for practitioners and policymakers to where the greatest opportunities for improvement may lie.
References
Advisory Committee on Student Financial Assistance (ACSFA). (2012). Pathways to success: Integrating learning with life and work to increase national college completion (A report to the U.S. Congress and Secretary of Education). Washington, DC: Author.
Bach, S. K., Banks, M. T., Kinnick, M. K., Ricks, M. F., Stoering, J. M., & Walleri, R. D. (2000, June). Student attendance patterns and performance in an urban postsecondary environment. Research in Higher Education, 41(3), 315-330.
Bill & Melinda Gates Foundation. (2015). New initiative to double the number of low-income students in the U.S. who earn a postsecondary degree. Retrieved http://www.gatesfoundation.org/Media-Center/Press-Releases/2008/12/New-Initiative-to-Double-the-Number-of-LowIncome-Students-in-the-US-Who-Earn-a-Postsecondary-Degree
Choy, S. P. (2002). Access and persistence: Findings from 10 years of longitudinal research on students. Washington, DC: American Council on Education.
Committee on Measures of Student Success. (2011, December). Committee on Measures of Student Success: A report to Secretary of Education Arne Duncan. Washington, DC: Author.
College Board Advocacy and Policy Center. (2010). The college completion agenda: State policy guide. New York, NY: National Conference for State Legislatures. Retrieved from http://www.ncsl.org/documents/educ/policyguide_062810sm.pdf
Hillman, N., Lum, T., & Hossler, D. (2008). Understanding Indiana’s reverse transfer students: A case study in institutional research. Community College Journal on Research & Practice, 39(2), 113-134.
Horn, L. J. & Carroll, C. D. (1997, October). Confronting the odds: Students at risk and the pipeline to higher education (Statistical Analysis Report, NCES 98-094). Washington, DC: U.S. Department of Education, National Center for Education Statistics.
Lee, J. M., Jr., Edwards, K., Menson, R. & Rawls, A. (2011). The college completion agenda: 2011 progress report. Washington, DC: College Board Advocacy and Policy Center.
Lumina Foundation for Education. (2009). Goal 2025: Lumina Foundation’s strategic plan. Indianapolis, IN: Author.
Messer, D., & Wolter, S. C. (2010). Time-to-degree and the business cycle. Education Economics, 18(1), 111-123. doi:10.1080/09645290903102860
Moore, C., & Shulock, N. (2009). Student progress toward degree completion: Lessons from the research literature. Sacramento, CA: Institute for Higher Education Leadership and Policy.
Mullin, C. M. (2012). Transfer: An indispensable part of the community college mission. Policy Brief.
National Bureau of Economic Research. (2010). Business Cycle Dating Committee press release. Cambridge, MA: Author. Retrieved from http://www.nber.org/cycles/sept2010.pdf
Petty, T. (2014). Motivating first-generation students to academic success and college completion. College Student Journal, 48(2), 257-264.
Reeves, T. J., Miller, L. A., & Rouse, R. A. (2011). Reality check: A vital update to the landmark 2002 NCES study of nontraditional college students. Phoenix, AZ: Apollo Research Institute.
Shapiro, D., Dundar, A., Wakhungu, P.K., Yuan, X., Nathan, A. & Hwang, Y. (2015, November). Completing College: A National View of Student Attainment Rates – Fall 2009 Cohort (Signature Report No. 10). Herndon, VA: National Student Clearinghouse Research Center. Retrieved from https://nscresearchcenter.org/signaturereport10/
U.S. Department of Education. (n.d.) College affordability and completion: Ensuring a pathway to opportunity. Retrieved from http://www.ed.gov/college
U.S. Department of Education. (2011). Committee on Measures of Student Success: A report to Secretary of Education Arne Duncan, Washington, DC: Author. Retrieved from http://www2.ed.gov/about/bdscomm/list/acmss.html#reports
U.S. Department of Education, National Center for Education Statistics. (2016). The Condition of Education 2016 (NCES 2016-144), Undergraduate Retention and Graduation Rates.
Witham, K; Chase, M; Bensimon E.M., Hanson, D & Longanecker, D. (2015) Moving the attainment agenda from policy to action, Change: The Magazine of Higher Learning, 47:4, 6-15, DOI:10.1080/00091383.2015.1053779
Appendix A: Methodological Notes
Overview
This report describes six-year college student success outcomes, focusing primarily on degree and certificate completion of a cohort of first-time-in-college degree-seeking students who started their postsecondary education at U.S. colleges and universities in the fall of 2010. The study follows this cohort for six years, through May 31, 2016. The results presented in the report center on student outcomes over the six-year span, including completion (i.e., receipt of any postsecondary credential by the end of the study period), persistence (i.e., having enrollment records at any postsecondary institution during the last year of the study period), and stop-out without completion (i.e., having no enrollment records at any postsecondary institution during the last year of the study period). The report mainly focuses on students’ first completion, with further distinctions drawn between completions awarded at the institution where a student first enrolled (his or her starting institution) and those awarded at an institution other than the starting institution. For students who started at a two-year public institution, this report also presents an overview of their completions at a four-year institution, either as a first completion (i.e., those who completed a four-year degree without having first earned a credential at a two-year institution2) or as a subsequent degree after a first completion awarded in the two-year sector. In addition to results on degree and certificate completion rates by enrollment intensity, age group, gender and starting institution type, the report includes results on completion across state lines, and for students who started at multistate institutions.
2Throughout this report, “two-year institution” is used broadly to designate institutions offering both associate’s degrees and less-than-two-year degrees and certificates.
National Coverage of the Data
The National Student Clearinghouse® (the Clearinghouse) is a unique and trusted source for higher education enrollment and degree verification. Since its creation in 1993, the participation of institutions nationwide in Clearinghouse data-collection programs has steadily increased. Currently, Clearinghouse data include more than 3,600 colleges and 96.7 percent of U.S. college enrollments. The Clearinghouse has a 23-year track record of providing automated student enrollment and degree verifications. Due to the Clearinghouse’s unique student-level record approach to data collection the Clearinghouse data provide opportunities for robust analysis not afforded by the more commonly used institution-level national databases.
The enrollment data used in this report provide an unduplicated headcount for the fall 2010 first-time-in-college student cohort. Clearinghouse data track enrollments nationally and are not limited by institutional and state boundaries. Moreover, because this database is comprised of student-level data, researchers can use it to link concurrent as well as consecutive enrollments of individual students at multiple institutions — a capability that distinguishes the Clearinghouse database from national databases built with institution-level data. For instance, in the National Center for Education Statistics (NCES) and the Integrated Postsecondary Education Data System (IPEDS) — one of the most widely used national data sets in postsecondary education research — concurrent enrollments remain unlinked and, therefore, are counted as representing separate individuals. There are nationally representative samples (e.g., National Education Longitudinal Study, NELS:88/2000; Beginning Postsecondary Students Longitudinal Study, Educational Longitudinal Study, ELS:02; etc.) that are based on student-level data. However, by definition samples have their limitations in terms of the currency of the data as well as its uses. For example, a nationally representative sample cannot be used to produce regional or state-level results. The Clearinghouse data do not have those limitations because of the frequency of the data collection and the near-census national coverage.
Cohort Identification, Data Cut, and Definitions
Focusing on the cohort of first-time-in-college degree-seeking students who started their postsecondary studies at U.S. colleges and universities in the fall of 2010, this report examines completion over a span of six years, through May 31, 2016. In order not to exclude or misrepresent the outcomes of students whose postsecondary pathways included enrollment in college preparatory summer study, the report also includes students who started their studies in the summer of 2010 (i.e., July 11 to August 14, 2010). Furthermore, to limit the cohort to first-time undergraduate students only, the study uses data from the Clearinghouse’s StudentTracker and DegreeVerify services to confirm that students included in the study (1) showed no previous college enrollment in the four years prior to June 1, 2010, and (2) had not completed a college degree prior to the first day of enrollment in fall 2010. Former dual enrollment students, first-time college students who had enrolled in college courses while still in high school, were included in the cohort for this study (see more on former dual enrollment students below).
In defining the study cohort, it was necessary to identify a coherent set of first-enrollment records that would as closely as possible represent a starting point for the fall 2010 cohort of first-time-in-college students. With this goal in mind, the researchers excluded enrollment records that were either (1) not clearly interpretable within the study’s framework and data limitations or (2) inconsistent with the experiences of first-time college enrollment that were the focus of the analysis. Students who showed concurrent enrollments (defined in this step as enrollments overlapping by at least one day) at different institutions in the fall 2010 term were therefore excluded from the study. Also excluded were students who first enrolled in postsecondary study outside the U.S. or its territories (e.g., Guam, Puerto Rico, the U.S. Virgin Islands), or who started at non-IPEDS institutions.
Because our outcome of interest was completion, we sought to focus analyses on degree-seeking students only. Consequently, we attempted to exclude non-degree-seeking, casual course takers from the cohort. For students who first enrolled in four-year institutions, non-degree-seeking students were defined as those who had only one enrollment record, with intensity of less than half-time. Students who started at two-year institutions were excluded as non-degree-seeking students if they failed to meet one of the following criteria: (1) one or more full-time enrollment before August 15, 2011 and (2) two enrollment terms with half-time status or more before December 31, 20113.
In summary, the study cohort included students who fulfilled all of the following conditions:
- Enrolled in a Title IV institution in fall 2010. This was defined as any term with a start date between August 15 and October 31, 2010, inclusive; or between July 11 and August 14, 2010, inclusive;
- Did not have a previous enrollment record, as shown in StudentTracker, between June 1, 2006, and May 31, 2010, unless the previous enrollment record was before the student turned 18 years old (dual enrollment);
- Did not receive any degree or certificate from a postsecondary institution prior to the first day of enrollment in fall 2010, according to Clearinghouse data unless the award date was before the student turned 18 years old (dual enrollment);
- Enrolled at just one institution in fall 2010 (i.e., showed no overlapping multiple enrollments between July 11 and August 14, 2010 or August 15 and October 31, 2010);
- Had at least one legitimate enrollment status throughout the study period; that is, enrolled for at least one term with full-time, part-time (i.e., half-time or less than half-time), or withdrawal status4;
- Showed intent to seek a degree or certificate. That is:
- For students who started at four-year institutions, enrolled at least one term with an intensity of half-time or higher.
- For students who started at two-year institutions, either:
- Enrolled full time for at least one term before August 15, 2011, or
- Enrolled at least half time for any two terms before December 31, 2011
3We excluded 516,864 students who began at two-year institutions, as non-degree-seeking students as a result.
4The Clearinghouse receives enrollment status data as full-time, half-time, less-than-half-time, withdrawal, or other statuses from its participating institutions
Former Dual Enrollment Students
The cohort used in this study includes former dual enrollment students: first-time college students who had previously taken dual enrollment courses. These are the students who enrolled in college courses prior to fall 2010 while still in high school. Enrollment records in the Clearinghouse data do not have an indicator for dual enrollment students. For this reason a proxy was used to identify this population. Students were identified as former dual enrollment students if their enrollment or degree record prior to fall 2010 was before the student turned 18 years old. Former dual enrollment students represent 15.8 percent of the fall 2010 cohort. As proportion of the sample for each sector, former dual enrollment students represent 19 percent of the students who started in four-year public institutions, 14 percent of the students who started in two-year public institutions and 15 percent of those who started in four-year private nonprofit institutions. Only two percent of the students who started in four-year private for-profit institutions had prior dual enrollments.
Enrollment Intensity
For this report, enrollment intensity is classified as exclusively full time throughout the study period, exclusively part time throughout the study period, or mixed enrollment (including both full-time and part-time enrollments), based on students’ enrollments across all terms (in which the student was enrolled and, hence, does not exclude stop‐outs) through the first completion or, for non-completers, through the entire study period. In establishing students’ enrollment intensity in this way, enrollments during summer terms (defined as terms with both the start date and the end date falling between May 1 and August 31 in any given year) and short terms (defined as terms lasting less than 21 days) were excluded from consideration.
For terms in which a student showed concurrent enrollment records (i.e., records that overlapped by 30 days or more), the two highest-intensity enrollments were considered. For example, a student concurrently enrolled half time at two institutions was categorized as enrolled full time for that term. Overall, for each term under consideration (i.e., all terms except summer terms and short terms − less than 21 days − up through the first completion, or, if no completion, throughout the entire study period), the “exclusively full-time enrollment” designation was assigned to students whose enrollment showed one of three situations: (1) the enrollment record showed exclusively full-time enrollment for all terms; or (2) for terms with concurrent enrollments, the two highest-intensity enrollment records included at least one full-time enrollment; or (3) for terms with concurrent enrollments, the two highest-intensity enrollment records both reflected half-time enrollment.
The “part-time enrollment” designation was assigned to students whose enrollment for each term under consideration showed one of the two following situations: (1) the enrollment record showed exclusively half-time or less than half-time enrollment; or (2) for terms with concurrent enrollments, the two highest-intensity enrollment records included some combination of half-time and less than half-time enrollments, but no full-time enrollment, and no more than one half-time enrollment.
The category of mixed enrollment was applied to students who showed a combination of full-time and part-time enrollments across the terms under consideration. Finally, students who showed records indicating withdrawal but no full-time or part-time enrollments were randomly assigned to an enrollment intensity category.
Age Group
The study focused on three age groups, namely, 20 years old or younger, between 21 and 24 years old, and older than 24 years old. The first group “20 years old or younger” is defined to approximate enrollment immediately after high school, while the second group (“over age 20 through 24)”) is meant to represent students who delay entry into postsecondary education for a few years after finishing high school. The final category included adult learners, defined as those who were older than 24 when they began college. For all categories, we define age as of the end of the 2010 calendar year (December 31, 2010). Students with birthdates of December 31, 1990, or later were placed in the first category. Those with birthdates between December 31, 1986, and December 30, 1990, inclusive, were categorized in the second group (“over age 20 through 24)”). Students with birthdates before December 31, 1986, were placed in the final category (“over 24 years old”).
Concurrent Completion
For this report, we examined completion by first-time students at either two-year or four-year institutions. We defined completion as having obtained a degree or certificate at any institution within the six-year study period (i.e., by May 31, 2016). Clearinghouse data provide a unique headcount of U.S. college enrollments during each term, which allows for the tracking of individuals including those with concurrent completion. In preparing data for this report, a small number of individuals showed more than one completion awarded at multiple institutions on the same day. In these instances, a primary completion record was selected using decision rules specific to the sector of the student’s starting institution.
The first set of decision rules was applied to students with concurrent completions who started at a two-year institution:
- Concurrent Completions at Two Different Two-Year Institutions
- Same over different: Completions at the starting institution were selected over completions
at other institutions. - Random selection: If the first decision rule did not result in a single completion record being selected, then a completion record was selected at random.
- Same over different: Completions at the starting institution were selected over completions
- Concurrent Completions at One Two Year Institution and One Four Year Institution
- Two-year then four-year: The two-year degree completion was considered the first completion and the four-year degree completion was considered a subsequent completion.
- Concurrent Completions at Two or More Four-Year Institutions
- Random selection: If a student started at a two-year institution but later completed at two or more four-year institutions concurrently, then a completion record was selected at random.
The second set of decision rules was applied to students who started at four-year institutions and later showed concurrent completion records:
- Same over different: Completions at the starting institution were selected over completions at other institutions.
- Four-year over two-year: If the first decision rule did not result in the selection of a single completion record, then completions at four-year institutions were selected over those at two-year institutions.
- Random selection: If neither of the first two decision rules resulted in the selection of a single completion record, then a completion record was selected at random.
Imputation of Values for Gender
The Clearinghouse’s coverage of student gender has increased dramatically for enrollments occurring in recent years. However, imputation of gender for the majority of enrollment records is still necessary in order to use the data for research studies using older cohorts. To meet this need, the Research Center developed an imputation process based on first names. Previously submitted name‐gender pairs throughout the Clearinghouse database are used to determine the probability of any first name being associated with either gender. To increase the accuracy of the imputation process, the Research Center also draws on name‐gender data from the Social Security Administration (SSA) and the U.S. Census Bureau.
Because the Clearinghouse collects transactional data, its data contain many more unique first names than the other sources. International students may also contribute to the large variety of first names submitted to the Clearinghouse. The imputation used only those pairs in which the name occurred in at least two instances and was associated with a single gender in at least 95 percent of the instances. The SSA and Census data sets were used to ensure that name‐gender pairs were consistent across every data set in which they occurred and to enhance the imputation process by contributing name‐gender pairs that did not occur in the Clearinghouse data.
Institutions reported student gender to the Clearinghouse for approximately half of all students included in this report. The imputation process that yielded additional gender codes produced a total gender coverage rate of 94 percent.
Imputation of Missing Data on Graduation Records
The National Student Clearinghouse collects graduation information from its participating institutions via two data reporting services: Enrollment Reporting and DegreeVerify. Enrollment Reporting has higher data coverage rates, but includes only basic completion information such as graduation indicator and the date of graduation. For the fall 2010 cohort, Enrollment Reporting covered 93 percent of all the students in Title IV degree-granting institutions listed in IPEDS (including 98 percent of the students in public institutions, 93 percent in private nonprofit institutions, and 53 percent in private for-profit institutions). DegreeVerify includes enhanced information on completions, including degree title, major, level, and CIP code, but covered only 84 percent of enrollments in 2010. Institutions may participate either in Enrollment Reporting alone or in both services. Completions data for this report included information drawn from either service. An analysis conducted by the Clearinghouse on the 2010 cohort found that graduation data for the institutions that participated in DegreeVerify were relatively more complete for some of the years covered in this study than those for institutions that participated only in Enrollment Reporting, biasing completion rates slightly downwards for institutional sectors with lower participation rates in DegreeVerify.
In order to correct for this bias the Research Center conducted a randomized imputation procedure for missing graduation data among students at non-DegreeVerify institutions who were no longer enrolled, but for whom outcome data were missing (that is, for whom the institution had reported neither a graduation nor a withdrawal status in their Enrollment Reporting). This involved comparing the Enrollment Reporting and DegreeVerify records for institutions that participated in both services and estimating, for each institution type, the average percentage of students with missing outcomes in the enrollment data who had a reported graduation in the DegreeVerify data. We further specified these underreporting rates by taking into account student age and the academic year. We then used random assignment of graduation outcomes to students with missing data at the institutions that did not participate in DegreeVerify in order to match each institution’s underreporting rate for each student age group and for every year of the study to the average rate for similar students at institutions of the same type that did participate in DegreeVerify.
This imputation was performed only for students with missing outcomes data at institutions that did not participate in DegreeVerify. It is based on the typical underreporting of graduation outcomes from similar institutions that participate in both Enrollment Reporting and DegreeVerify. The table below shows, for each institution type, the percentage of the starting cohort for whom graduation data were imputed:
| Institution Type |
Percentage of the Starting Cohort With an Imputed Completion |
| Two-Year Private For-Profit | 0.34% |
| Two-Year Private Nonprofit | 0.46% |
| Two-Year Public | 0.27% |
| Four-Year Private For-Profit | 0.16% |
| Four-Year Private Nonprofit | 0.10% |
| Four-Year Public | 0.32% |
| Total | 0.21% |
Imputation of Missing Data through Weighting by State and Institution Type
The institutions participating in the Clearinghouse Enrollment Reporting service (i.e., providing the data coverage) is not 100 percent of all institutions for any individual year. Therefore, in order to account for possibilities of not capturing a student’s enrollment outcome due to non-coverage of Clearinghouse data, the analysis weights were calculated using 2015 coverage rate of the sector, control, and state of the institution where a student was enrolled for the last enrollment record. Last enrollment record was defined based on the first completion (for completers) or the last enrollment record either before stop-out (for students who had no enrollment records during the last year of the study) or before the end of the study period (for persisters). For students who completed a degree at the starting institution or were still enrolled at the starting institution by the end of the study period, a weight=1 was applied. For all other students, two weights were created and applied in this study:
For students who completed a degree or were still enrolled at a different institution by the end of the study period, a “transfer” weight was applied. The transfer weight used was an over-weight based on the coverage of the sector, control, and state of the institution in which the student was enrolled for the last enrollment record, as calculated by the formula provided below:
For students who stopped out by the end of the study period, a “missing” weight was applied. The missing weight used was an under-weight based on the coverage of the sector, control, and state of the institution in which the student was enrolled for the last enrollment record, as calculated by the formula provided below:
![]()
Data Limitations
The data limitations in this report center mainly on the data coverage, the methods used for cohort identification, and the definition of key constructs, as outlined above.
The representation of private for-profit institutions in the StudentTracker data is lower than that of other institution types, with 64 percent coverage for four-year private for-profit institutions in fall 2010 compared to 93 percent and 99 percent respectively for four-year private nonprofit institutions and four-year public institutions. Despite the challenges presented by low participation in the early years covered in this report, current Clearinghouse data nevertheless offer near-census national coverage, representing more than 96 percent of U.S. postsecondary enrollments. In an effort to correct for coverage gaps, in this study, data were weighted, as explained above.
Data limitations resulting from the cohort identification methods used in preparing this report also should be noted. Because the Clearinghouse data on designations for class year are incomplete, the researchers identified first-time undergraduate students via two indirect measures:
- No previous college enrollments recorded in StudentTracker going back four years, and
- No previous degree awarded in the Clearinghouse’s historical DegreeVerify database.
Given these selection criteria, the sample for this report may include students who had more than 30 Advanced Placement (AP), International Baccalaureate (IB), or dual enrollment credits (students who are included in this study’s sample as first-time students but in fall 2010 they were enrolled in college courses while still in high school) and who would not be considered first-time students despite having first-time status. Moreover, because of inconsistencies in the historical depth of DegreeVerify database records, it is possible that a small number of graduate students are also included in the study cohort.
Finally, although Clearinghouse data contain some demographic information on students, historical coverage rates for the demographic data elements are uneven. Consequently, the results summarized in this report do not break enrollments out by race/ethnicity and results on gender are based partially on imputed values, as described above.