
Science & Engineering Degree Attainment – 2015
Science & Engineering Degree Attainment: 2004-2014
From 2004 to 2014, science and engineering degrees increased in prevalence for both genders. The trend was driven by growth in the so-called “hard sciences.”
S&E Degrees Becoming More Prevalent
The percentage of bachelor’s degrees accounted for by S&E disciplines increased two percentage points for men, and one percentage point for women. The percentage of master’s degrees accounted for by S&E disciplines increased one percentage point for men, and remained nearly flat for women. At the doctoral level, social sciences and psychology decreased in prevalence, while the other S&E disciplines increased. S&E “hard sciences” now account for 48 percent of all doctoral degrees earned by men, up from 45 percent in 2004.
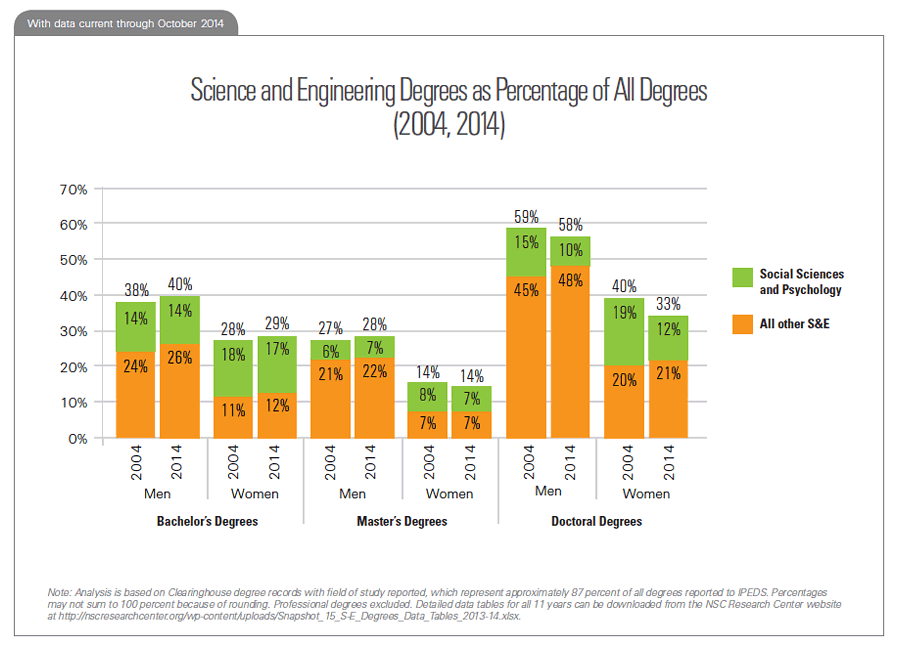
Note: Analysis is based on Clearinghouse degree records with field of study reported, which represent approximately 87 percent of all degrees reported to IPEDS. Percentages may not sum to 100 percent because of rounding. Professional degrees excluded.
The definition of science and engineering used in this Snapshot Report includes social sciences and psychology and is based on classifications used by the National Science Foundation. Professional degrees, such as MD, DMD, and JD, are excluded from this analysis of doctoral degrees.
Women Earn Smaller Share of S&E Degrees at Advanced Levels
In 2014, women earned 49 percent of all S&E bachelor’s degrees, 43 percent of S&E master’s degrees, and 40 percent of S&E doctoral degrees. At each degree level, the overall gender distribution changed little from 2004 to 2014. However, there was considerable variation among specific disciplines, as shown in subsequent exhibits.
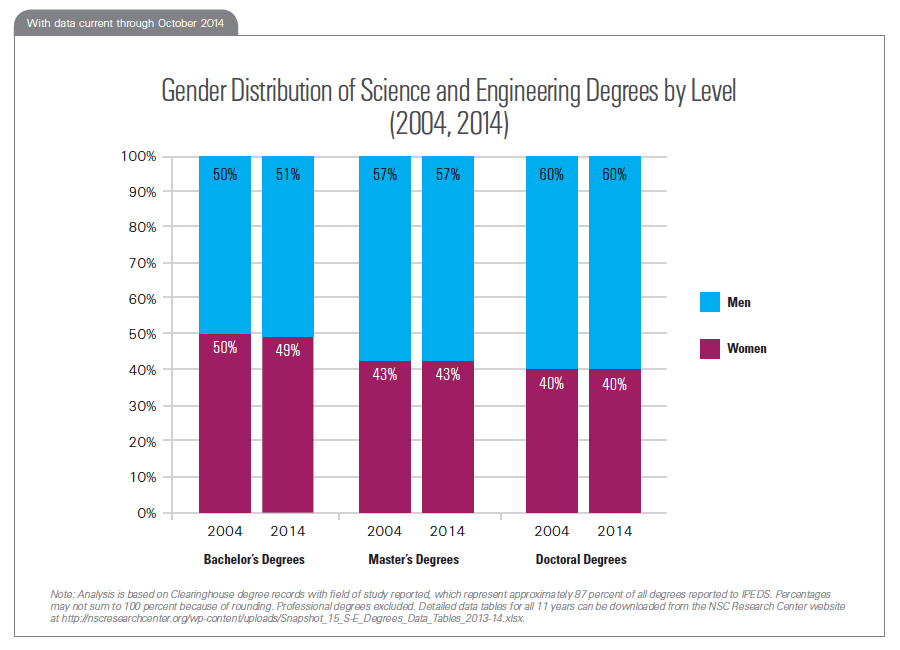
Note: Analysis is based on Clearinghouse degree records with field of study reported, which represent approximately 87 percent of all degrees reported to IPEDS. Percentages may not sum to 100 percent because of rounding. Professional degrees excluded.
Professional degrees, such as MD, DMD, and JD, are excluded from this analysis of doctoral degrees.
S&E by Discipline: Women Losing Ground at Bachelor’s Level
From 2004 to 2014, the share of bachelor’s degrees earned by women decreased in all seven S&E disciplines. The biggest decrease was in the computer sciences, where the share of bachelor’s degrees earned by women dropped five percentage points. In all years studied, women earned the majority of bachelor’s degrees in biological and agricultural sciences and social sciences and psychology.
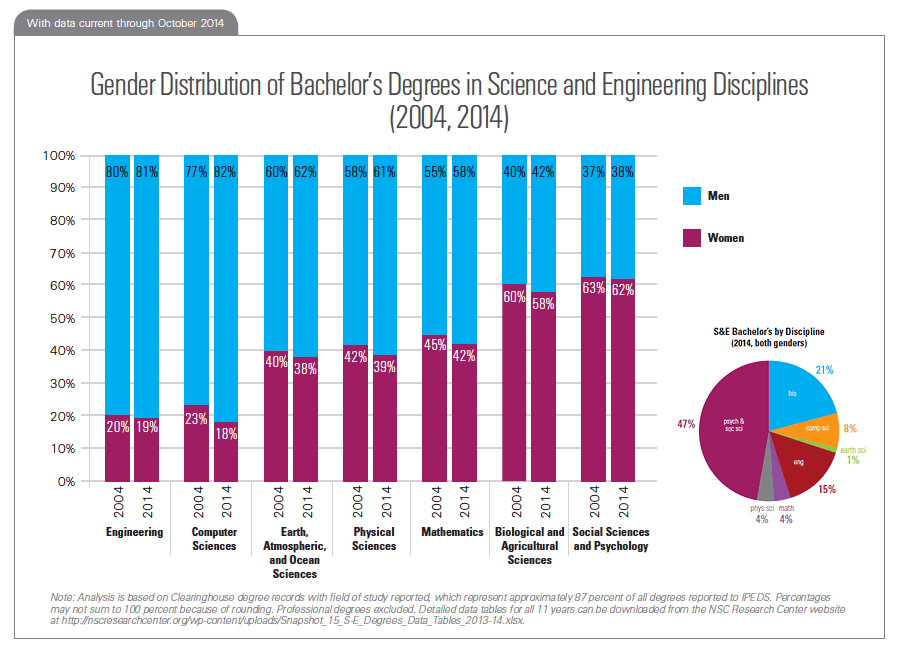
Note: Analysis is based on Clearinghouse degree records with field of study reported, which represent approximately 87 percent of all degrees reported to IPEDS. Percentages may not sum to 100 percent because of rounding. Professional degrees excluded.
S&E by Discipline: Mixed Results at Master’s Level
From 2004 to 2014, the share of master’s degrees accounted for by women increased in three S&E disciplines and decreased in four. The biggest increase occurred in engineering, where the share of master’s degrees earned by women grew three percentage points. The biggest decreases were in the computer sciences and earth/atmospheric/ocean sciences. In both of these disciplines, the share of master’s degrees earned by women dropped three percentage points.
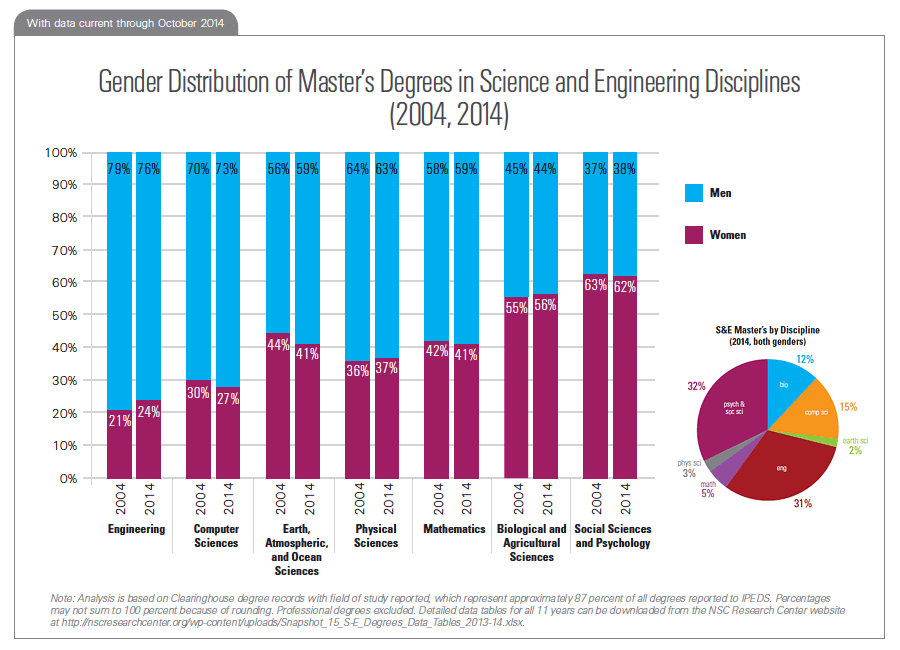
Note: Analysis is based on Clearinghouse degree records with field of study reported, which represent approximately 87 percent of all degrees reported to IPEDS. Percentages may not sum to 100 percent because of rounding. Professional degrees excluded.
S&E by Discipline: Women Gaining Ground at Doctoral Level
From 2004 to 2014, women made the largest gains at the doctoral level. The share of doctoral degrees earned by women increased in five S&E disciplines. In four S&E disciplines, the share of doctoral degrees earned by women increased by at least four percentage points.
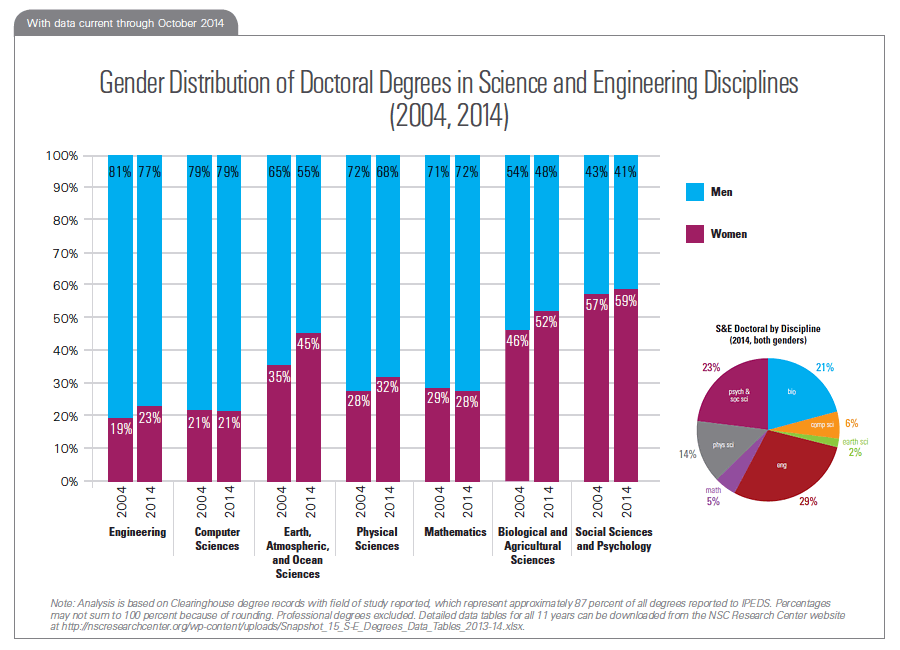
Note: Analysis is based on Clearinghouse degree records with field of study reported, which represent approximately 87 percent of all degrees reported to IPEDS. Percentages may not sum to 100 percent because of rounding. Professional degrees excluded.
Professional degrees, such as MD, DMD, and JD, are excluded from this analysis of doctoral degrees.
Sponsored in part by the Lumina Foundation, committed to enrolling and graduating more students from college.
