
Persistence & Retention
This report series helps institutions understand first-year college persistence and retention patterns and identify disparities between different students, institutions, or states in this important early success indicator.

This report series helps institutions understand first-year college persistence and retention patterns and identify disparities between different students, institutions, or states in this important early success indicator.

This report series measures academic progress in each subsequent academic year for six years after entry, broken out by the type of starting institution and enrollment intensity at entry (full-time vs. part-time). Results do not account for enrollment intensity changes after entry.

Among all students who enrolled in college for the first time in fall 2017, 73.8 percent persisted at any U.S. institution in fall 2018, while 61.7 percent were retained at their starting institution

By the end of year four, 43.7 percent had completed a postsecondary credential, while 23.0 percent were no longer enrolled. By the end of year six, 64.3 percent had graduated, while 26.6 percent had left college without earning a credential.

Of all students who started college in fall 2016, 73.9 percent persisted at any U.S. institution in fall 2017, while 61.6 percent were retained at their starting institution.

By the end of year four, 42.1 percent of individuals who began college in fall 2011 had completed a postsecondary credential, while 23.5 percent were no longer enrolled. By the end of year six, 63.1 percent had graduated, while 27.4 percent had left college without earning a credential.

Of all associate degrees reported to the Clearinghouse for the 2010-11 academic year, 575,067 were earned by students with no previous degrees or certificates. Within the next six academic years, 65.1 percent of these students enrolled at four-year institutions and 41.4 percent earned bachelor’s degrees.

Of all associate degrees reported to the Clearinghouse for the 2010-11 academic year, 575,067 were earned by students with no previous degrees or certificates. Within the next six academic years, 65.1 percent of these students enrolled at four-year institutions and 41.4 percent earned bachelor’s degrees.

Of all students who started college in fall 2015, 73.4 percent persisted at any U.S. institution in fall 2016, while 61.1 percent were retained at their starting institution. The persistence rate is the percentage of students who return to college at any institution for their second year, while the retention rate is the percentage of students who return to the same institution.

From 2006 to 2016, degree attainment in the so-called “hard sciences” increased in prevalence for both genders. Excluding social sciences and psychology, the percentage of bachelor’s degrees accounted for by S&E disciplines increased five percentage points for men, and two percentage points for women.

In the 2015-16 academic year, 49 percent of students who completed a four-year degree were enrolled at a two-year institution at some point in the previous 10 years.

By the end of year four, 40.5 percent of individuals who began college in fall 2010 as full-time degree-seeking students had completed a postsecondary credential, while 24.5 percent were no longer enrolled. By the end of year six, 61.1 percent had graduated, while 28.5 percent had left college without earning a credential.
During the Great Recession, there was a slight increase in the percentage of bachelor’s degree earners who opted to continue their educations at two-year institutions. However, that percentage has now dropped well below pre-recession levels, with only 5.8 percent of 2013-14 bachelor’s degree earners having returned to college at two-year institutions.

Of all associate degrees reported to the National Student Clearinghouse for the 2009-10 academic year, 536,351 were earned by students with no previous degrees or certificates. Within the next six academic years, over 64 percent of these students enrolled at a four-year institution and 41 percent earned a bachelor’s degree.

Of all students who started college in fall 2014, 72.1 percent persisted at any U.S. institution in fall 2015, while 60.6 percent were retained at their starting institution.

During the 2014-15 academic year, 9.4 percent of all students attended more than one institution, a figure that has remained constant for the last three years. In each year shown, the mobility rate was highest for students who began the academic year at a two-year public institution.

This snapshot goes beyond traditional measures of postsecondary attainment by tracking the fall 2009 entering cohort over time, and showing persistence, stop-out, and completion rates at the end of each subsequent academic year. The model tracks outcomes for both full-time and part-time starters, and takes spring and summer terms into account.

Of all associate degrees earned in 2008-09 that were reported to the National Student Clearinghouse, 488,046 were found to be the first postsecondary credential earned by a student. Forty-one percent of these students went on to earn a bachelor’s degree within six years.

The overall persistence rate for students who entered college in Fall 2013 was 1.0 percentage points higher than that of students who entered college in Fall 2012, while the retention rate increased by 1.1 percentage points.

In the 2013-14 academic year, 46 percent of students who completed a four-year degree were enrolled at a two-year institution at some point in the previous 10 years.

Nationally, 14.6 percent of all 2013-14 college graduates attended college in at least one other state or territory in the 10 years prior to receiving a credential.

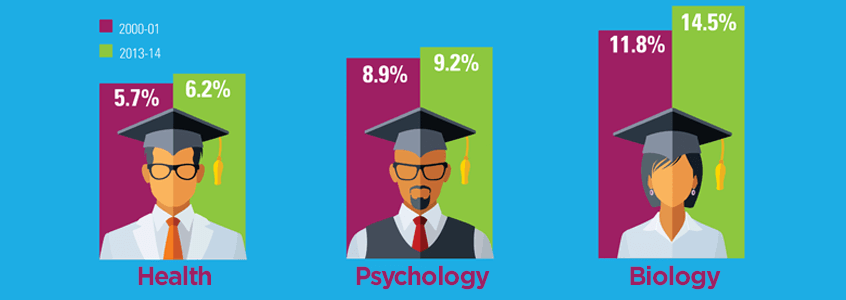
From 2004 to 2014, science and engineering degrees increased in prevalence for both genders. The trend was driven by growth in the so-called “hard sciences.”

Of all associate degrees earned in 2008-09 that were reported to the National Student Clearinghouse, 488,046 were found to be the first postsecondary credential earned by a student. Forty-one percent of these students went on to earn a bachelor’s degree within six years.

Just over 9% of all students attended more than one institution during the 2012-13 academic year. Overall, student mobility rates increased from 2010-11 to 2011-12, and then stabilized in 2012-13.
Between 2009 and 2013, students over the age of 26 showed a 25% growth rate in science and engineering bachelor’s degree completion compared to a 19% growth rate among students age 26 or under at time of completion.
Between 2009 and 2013, S&E bachelor’s degree completions for both men and women had almost identical growth at 20% and 21%, respectively. With social sciences and psychology included, women accounted for 50% of all S&E bachelor’s degrees in both 2009 and 2013.
6.5% of students who graduated with a bachelor’s degree in 2008-09 enrolled in a two-year institution within the next two academic years, an increase from 5.9 percent of 2004-05 graduates.
In academic year 2011-12, nearly a third of the first-time college students in two-year public institutions began college in January or later months.
The National Student Clearinghouse Research Center examined the postsecondary outcomes of students who transferred from two-year to four-year institutions in three different academic years.
From 2007-08 to 2010-11, the number of degrees awarded to students age 25 and older increased by 22%, compared to 17% for those under age 25.
For many students, the path to successfully completing a degree at a four-year institution includes enrollment at one or more two-year institutions. In the 2010-11 academic year, 45 percent of all students who completed a degree at a four-year institution had previously enrolled at a two-year institution.
On average, 15.1 percent of all U.S. postsecondary students who received undergraduate degrees in 2010-11 had previously attended college in at least one other state or territory. The National Student Clearinghouse Research Center has identified the percentage of undergraduate degree completers in the 2010-11 academic year who had prior enrollments in at least one other state or territory.
According to the National Student Clearinghouse Research Center, on average, 38 percent of all students, undergraduate and graduate, in a fall term are adult learners.
According to the National Student Clearinghouse Research Center, 3.2% of all students attended two or more postsecondary institutions concurrently during its one-year study period. Concurrent enrollment in this report occurs when a student’s enrollment at two or more postsecondary institutions overlaps by at least 30 days.
According to the National Student Clearinghouse Research Center, 8% of students attended more than one postsecondary institution in 2010-2011. The most mobile students were those with both full- and part-time statuses, with 17.2% of these students attending more than one institution during a single year.
National Student Clearinghouse Research Center Snapshot Report on college student’s persistence rates by percentage of college students staying in school and how persistence varied by type of institution for 2010.