Science & Engineering Degree Attainment – By Age – 2013
Growth in Science and Engineering (S&E) Bachelor’s Degrees by Age
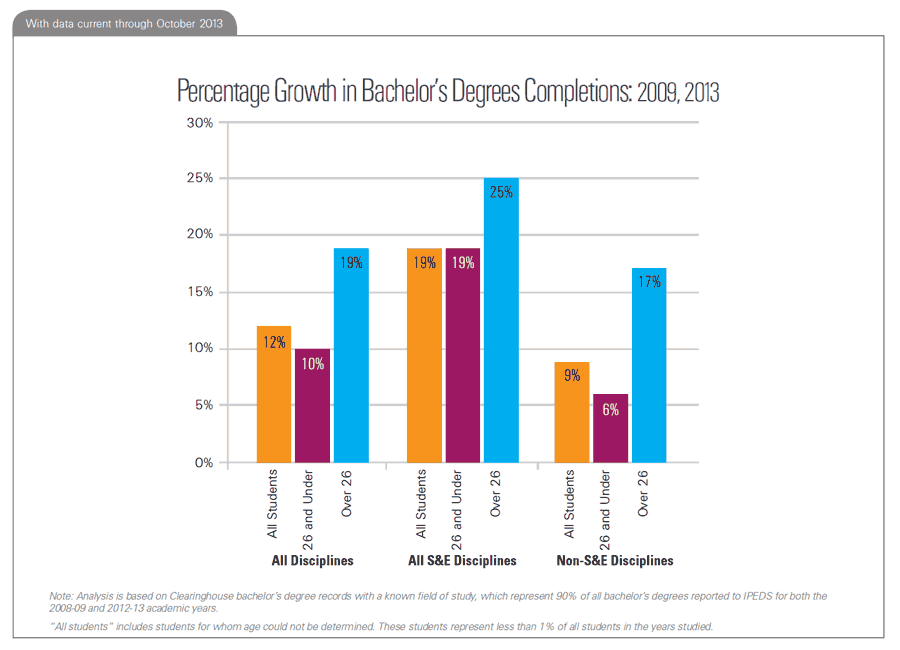
Between 2009 and 2013, students over the age of 26 showed a 25% growth rate in S&E bachelor’s degree completion compared to a 19% growth rate among traditional-age students (those age 26 or under at time of completion). In 2013, students over the age of 26 accounted for 18% of all S&E bachelor’s degrees.
Older Students Experiencing Fastest Growth in S&E Bachelor’s Degrees
- Over the last five years, the overall number of science and engineering (S&E) bachelor’s degree completions has grown by 19%, compared to 9% growth for non-S&E disciplines.
- Among traditional-age students (students who completed bachelor’s degrees at age 26 or under), S&E bachelor’s degree completions grew by 19%, compared to only 6% growth for non-S&E disciplines.
- Among students over the age of 26, S&E bachelor’s degree completions grew by 25%, compared to 17% growth for non-S&E disciplines.
- The definition of science and engineering used in this snapshot includes social sciences and psychology and is based on classifications used by the National Science Foundation.
Science and Engineering: A Young Person’s Game?
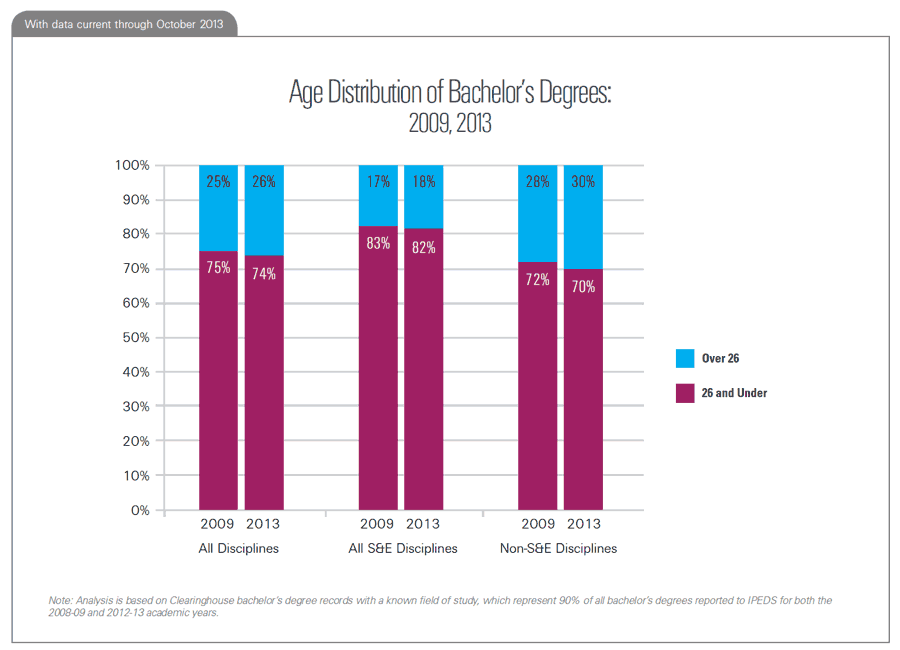
- In the 2012-13 academic year, students over the age of 26 earned 26% of all bachelor’s degrees, and 30% of bachelor’s degrees completed in non-S&E disciplines. However, they accounted for only 18% of bachelor’s degrees completed in S&E.
- Nonetheless, the percentage of S&E bachelor’s degrees earned by students over the age of 26 has increased slightly, by a single percentage point, since 2008-09.
Mathematics and Computer Science Attract Largest Share of Students over the Age of 26
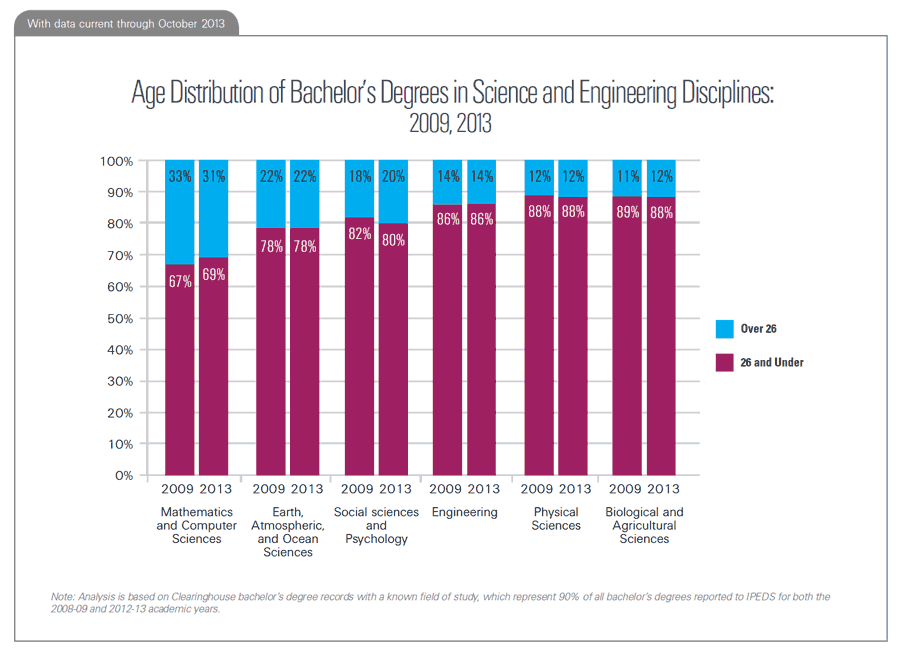
- In 2012-13, nearly a third of all bachelor’s degrees in mathematics and computer science were completed by students over the age of 26.
- However, since 2008-09, the share of bachelor’s degrees completed by students over the age of 26 has decreased two percentage points in mathematics and computer science, while increasing two percentage points in social sciences and psychology.
Growing Prevalence of S&E Bachelor’s Degrees among Both Age Groups
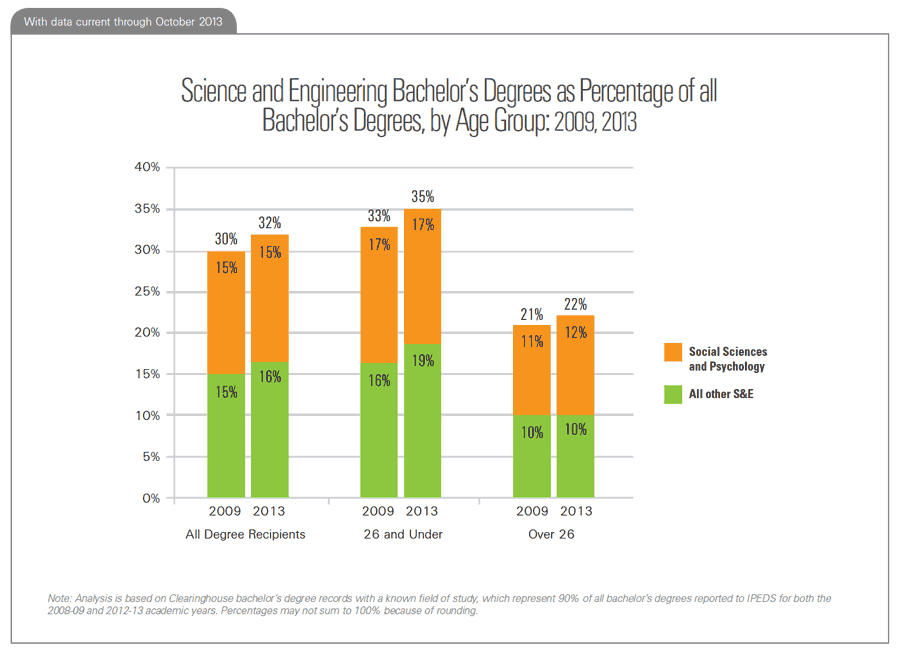
- In 2012-13, S&E bachelor’s degrees accounted for 32% of all bachelor’s degrees, up from 30% in 2008-09.
- 22% of all bachelor’s degrees earned by students over age 26 were in S&E disciplines, compared to 35% of all bachelor’s degrees earned by traditional-age students.
- Over the last five years, attainment of S&E degrees, as a percentage of all bachelor’s degrees, increased slightly for both age groups.
- Excluding social sciences and psychology, the remaining S&E disciplines accounted for 10% of all bachelor’s degrees earned by students over the age of 26, and 19% of all bachelor’s degrees earned by traditional-age students in 2012-13.
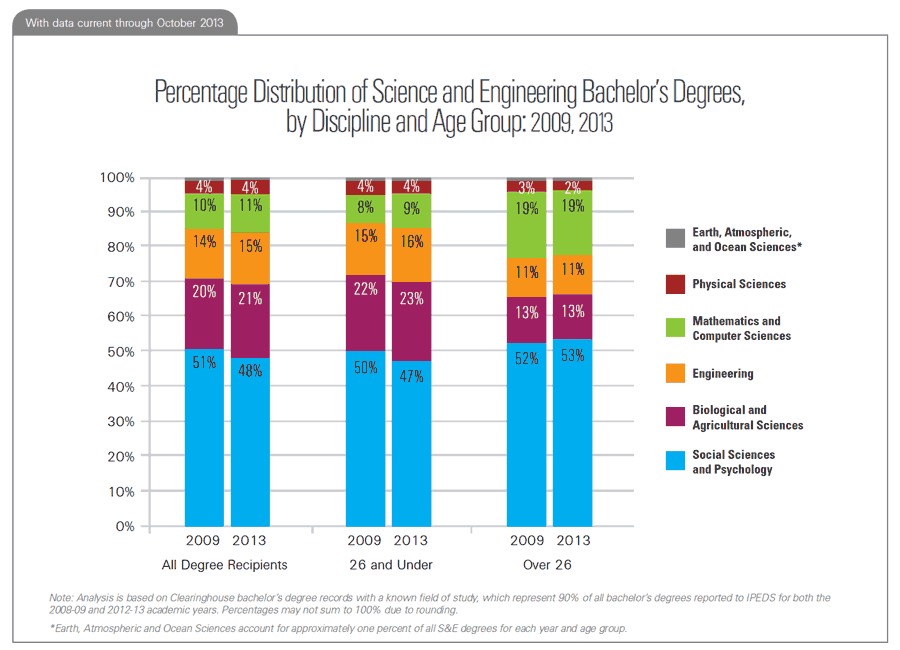
Within S&E, Choice of Discipline Varies by Age Group
- In 2012-13, each age group completed the largest share of their S&E bachelor’s degrees in social sciences and psychology: 47% of the degrees completed by traditional-age students, compared to 53% of the degrees completed by students over the age of 26.
- Over the last five years, the percentage of S&E bachelor’s degrees accounted for by social sciences and psychology has decreased by three percentage points for traditional-age students, while increasing slightly for the older students.
- Biological and agricultural sciences was the second most common S&E category for traditional-age students, accounting for 23% of their S&E bachelor’s degrees in 2012-13.
- Mathematics and computer science was the second most common S&E category for students over 26, accounting for 19% of their S&E bachelor’s degrees in 2012-13.
Sponsored in part by the Lumina Foundation, committed to enrolling and graduating more students from college.
Data analysis performed by Jason DeWitt, Research Manager, and Travis Maciejewski, Research Associate.
