

High School Benchmarks – 2014
National College Progression Rates for high schools participating in the National Student Clearinghouse StudentTracker® service
Our second annual report provides high school-to-college transition rates for graduates of public non-charter, public charter, and private high schools. For students of public non-charter high schools the rates are reported in 12 categories based on the school-level demographic and geographic characteristics.
Table of Contents
- Introduction
- Section 1: National Results
- Section 2: Results by High School Type
- Results for Public Non-Charter High Schools
- Outcomes for Low Income, High Minority, Urban High Schools
- Outcomes for Low Income, Low Minority, Urban High Schools
- Outcomes for Low Income, High Minority, Suburban High Schools
- Outcomes for Low Income, Low Minority, Suburban High Schools
- Outcomes for Low Income, High Minority, Rural High Schools
- Outcomes for Low Income, Low Minority, Rural High Schools
- Outcomes for Higher Income, High Minority, Urban High Schools
- Outcomes for Higher Income, Low Minority, Urban High Schools
- Outcomes for Higher Income, High Minority, Suburban High Schools
- Outcomes for Higher Income, Low Minority, Suburban High Schools
- Outcomes for Higher Income, High Minority, Rural High Schools
- Outcomes for Higher Income, Low Minority, Rural High Schools
- Results for Public Charter High Schools
- Results for Private High Schools
- Results for Public Non-Charter High Schools
- References
- Appendix A: Methodological Notes
- Appendix B: Postsecondary Coverage Tables
- Appendix C: Tables for Section 1: National Results
Introduction
The second annual High School Benchmarks Report provides new data on the high school-to-college transition of students. Such timely and comprehensive data are important for educators and policymakers interested in outcomes of secondary education and access to postsecondary education, particularly for students from low income and minority populations traditionally not well served by higher education.
Research projects demographic shifts among high school graduates in the next few years (Prescott & Bransberger, 2012). Further information on how schools in various geographical areas, and with higher percentages of low income and minority students, perform in terms of their students’ college access and persistence, compared to schools with a lower percentage of low income and minority students, is needed to better understand postsecondary outcomes of graduates from various types of high schools.
Previous research has shown that high school context may lead students to make different educational choices when it comes to the decision to enroll in college or what college to attend (Wolniak & Engberg, 2010; Hurwitz, Smith, Howell, & Pender, 2012; McDonough, 1997; Roderick, Coca & Nagaoka, 2011). Research has also shown that high schools are not only an important source of information for students making postsecondary education plans (Bell, Rowan-Kenyon, & Perna, 2009; Hossler, Schmidt, & Vesper, 1999), but also have lasting effects on students, with some high school context variables continuing to be important for students’ success, even after enrolling in college (Black, Lincoln, Cullinove, & Vernon, 2012). School-based resources are especially important for students from families in which no adults have attended college. Notwithstanding the effects of individual-level factors on postsecondary education decisions, research has found that what high schools do to help their students navigate the college-going process has significant implications on their students’ postsecondary outcomes (Hill, 2008, McDonough, 1997).
Some data on the college-going rates of high school students at the national level are available (Aud et al., 2013). Many schools and districts also have access to timely reports on the college access and persistence rates of their own graduates through the StudentTracker® service of the National Student Clearinghouse. This report is designed to enable those schools to benchmark their students’ outcomes to those of other schools with similar characteristics and that also use the StudentTracker service. Using the results reported here, high schools and districts can place their own StudentTracker results into context with the college access and persistence rates for schools with similar student populations in similar locales across the country.
This is a descriptive study. No causal inferences should be made based on these results alone. The data on which this report is based do not comprise a nationally representative sample of schools or high school graduates. Yet, it is a large and broad sample, covering over 3.5 million students from public and private high schools over four years, or more than a quarter of all U.S. high school graduates each year. It includes data from all 50 states. In addition to providing reasonable benchmarks for individual schools and districts using StudentTracker reports, we believe it also makes a significant contribution to discussions about equitable access to, and persistence in, postsecondary education amongst practitioners and policymakers at the school, district, state, and national levels.
What To Find In This Report
This report provides high school-to-college transition rates for public non-charter; public charter; and private high school graduates. For students of public non-charter high schools the rates are reported in 12 categories based on the school-level demographic and geographic characteristics:
- Low income, high minority, urban
- Low income, low minority, urban
- Low income, high minority, suburban
- Low income, low minority, suburban
- Low income, high minority, rural
- Low income, low minority, rural
- Higher income, high minority, urban
- Higher income, low minority, urban
- Higher income, high minority, suburban
- Higher income, low minority, suburban
- Higher income, high minority, rural
- Higher income, low minority, rural
These categories are defined by the aggregate characteristics of each high school, not by the characteristics of individual students.
For the first time, this report also provides high school-to-college transition rates for graduates from public charter and private high schools. It is important to note, however, that the sample sizes for charter and private high schools are relatively smaller than those for public non-charter schools. The results for charter and private schools are therefore subject to higher variance and uncertainty than the results for public non-charter schools. For this reason, we do not recommend comparing these categories, or using these results to draw conclusions about the differences between the school types.
For the purpose of this report, low income schools are defined as schools where at least 50 percent of the students are eligible for a free or reduced-price lunch. Minority schools are defined as schools where at least 40 percent of the students are black or Hispanic. Locale is defined by the NCES urban-centric locale code. Schools with a code from 11 to 13 are defined as urban. Schools with a code from 21 to 23 are defined as suburban. And those with a code from 31 to 43, covering both town and rural areas, are defined as rural.
This report presents postsecondary outcomes for high school graduating classes from 2010 through 2013. The tables and figures present:
- Total college-going rate for each of the 12 categories of public non-charter high schools as well as for public charter and private high schools, including:
- Enrollment in the first fall after high school graduation
- Enrollment in the first year after high school graduation
- Enrollment in the first two years after high school graduation
- Persistence from first to second year of college
For each enrollment outcome, the results are calculated for the most recent two graduating classes for which data are currently available. Thus, the first fall outcome has been calculated for the classes of 2013 and 2012, the first year outcome for the classes of 2012 and 2011, and the first two years’ outcome for the classes of 2011 and 2010. For the persistence outcome, the results are calculated for the class of 2011. Results are also broken down by the type of college attended: public and private institutions, two- and four-year institutions, as well as in-state and out-of-state institutions.
A complete explanation of definitions can be found in Appendix A.
Important Note On The Data
The data on high school graduates for this report were drawn from a voluntary sample of high schools participating in the StudentTracker for High SchoolsSM service (STHS) administered by the National Student Clearinghouse (The Clearinghouse). High schools participating in this service pay a small annual fee (typically $425) to receive an extensive set of analytic data reports, three times per year, detailing the postsecondary access and success outcomes for up to eight cohorts of their graduating classes.
This is not a nationally representative sample of schools or of high school graduates. Compared to all U.S. high schools, participating STHS schools tend to have greater representation among schools with more low income students, more minority enrollments, and more urban locales.
All types of high schools, including public non-charter, public charter, and private schools, can participate in the Clearinghouse STHS service. The sample includes schools from all 50 states and from the majority of the 100 largest districts in the U.S., with a total of more than 3.5 million high school graduates or more than one quarter of all high school graduates each year (for more detailed information about the sample, see Appendix A).
The data on college enrollments for this report, and for the STHS reports that the participating high schools receive, were drawn from the National Student Clearinghouse. The National Student Clearinghouse is the nation’s trusted source for education verification and student educational outcomes research.
Section 1: National Results
College Enrollment and Persistence Rates for Graduates from Public Non-Charter High Schools
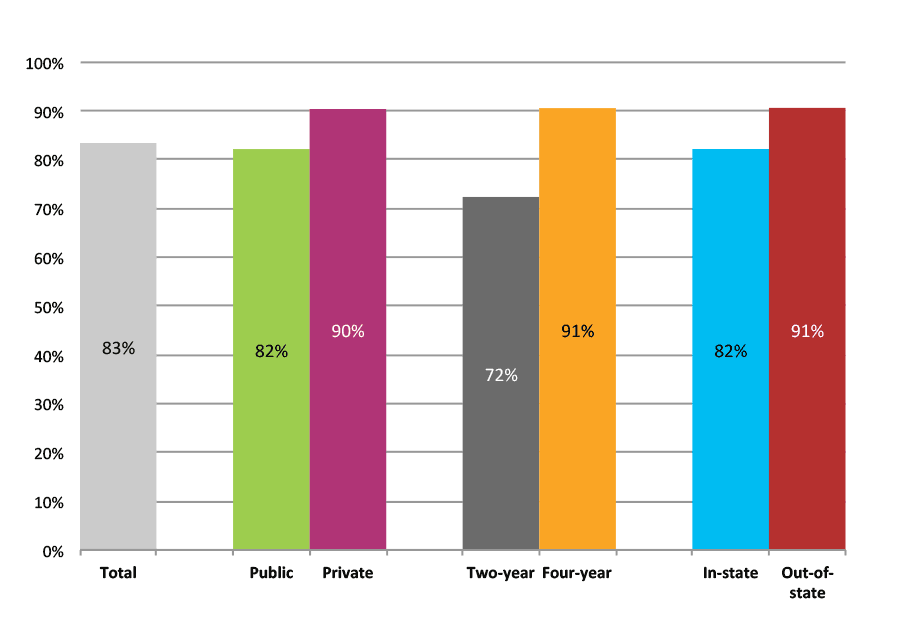
High schools are interested in finding out what percent of their graduates go to college. This percentage changes depending on the timing. Most high school graduates who are headed to college will enroll immediately, but there are also significant numbers who wait a year or longer. Figure A shows the rates of immediate college enrollment in the first fall after high school graduation for the high school graduating class of 2013. These are students who transition immediately to college with no gap after high school.
Students from higher income, low minority, suburban schools had the highest college enrollment rate. Seventy three percent of students who graduated from these high schools in 2013 enrolled in college immediately after high school graduation. In general, among the three school characteristics considered, the poverty level, measured by the proportion of students eligible for free or reduced price lunch, was the most consistent correlate to college enrollment rates. Students from high schools with a larger number of low income students (more than 50% eligible for free or reduced price lunch) had lower college enrollment rates than schools with mostly higher income students, regardless of the minority or geographic category that the school fell into. The highest immediate college-going rate across all six low income groups (58 percent) was still lower by three percentage points from the lowest college-going rate (61 percent) among students from higher income groups.
Figure A. College Enrollment Rates in the First Fall after High School Graduation, Class of 2013, Public Non-Charter Schools
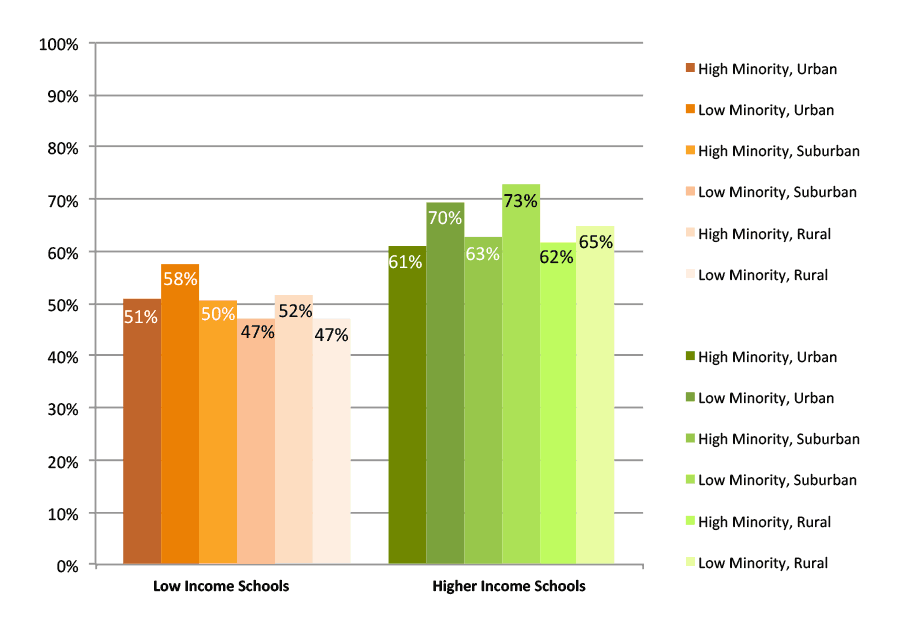
*This figure is based on data shown in Appendix C, Table 1.
Figure B shows the rates of immediate college enrollment in the first fall after high school graduation for the students graduating from high minority schools in 2013. The most obvious pattern again is the higher college enrollment rates among students from higher income schools. It is striking that — once income is controlled for — there was no difference between urban, suburban, and rural high minority schools. Just over half of graduates from low income schools enrolled in the first fall, regardless of locale. Among higher income schools, the rates were similarly uniform for each of the three locales, between 61 and 63 percent.
Figure B. College Enrollment Rates in the First Fall after High School Graduation, Class of 2013, Public Non-Charter, High Minority Schools
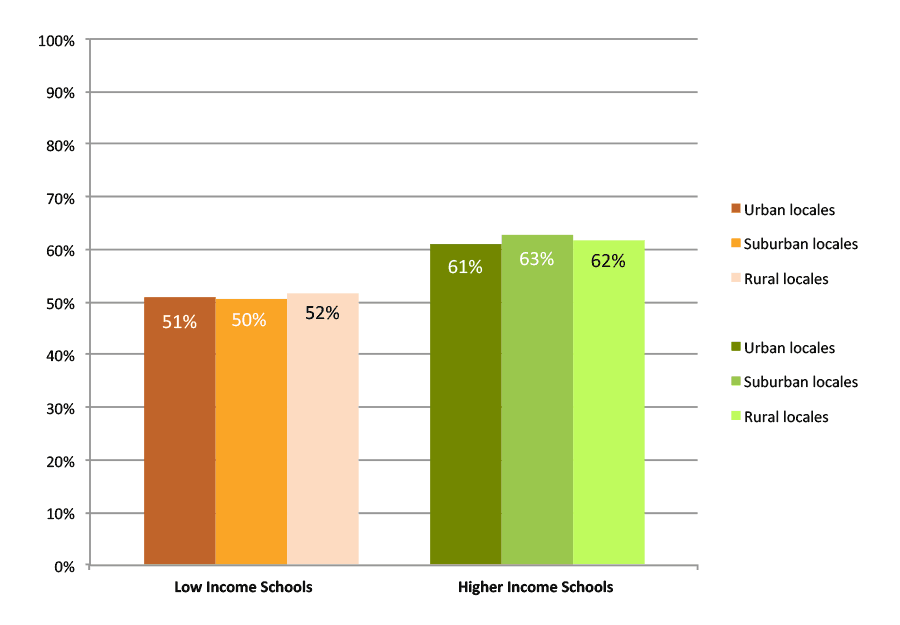
*This figure is based on data shown in Appendix C, Table 1.
High schools are also interested in the type of college their graduates are attending, whether a public or private college, or whether a two-year or a four-year college. When we examined first fall enrollments in private colleges as a share of total college enrollments, the results showed that students from higher income, low minority, suburban schools had the highest share: one in five first fall enrollments for these students were in private colleges and universities (see Appendix C, Table 1).
There were larger differences among students from low income and higher income high schools, however, when looking at enrollment rates by the institution level. The range for the first fall enrollment rates at four-year colleges and universities was 26 to 31 percent for the graduates from low income high schools and 33 to 51 percent for the graduates from higher income high schools (see Appendix C, Table 1).
Results show that while the rates of enrollment at two-year colleges are not higher for students from low income schools than for those from higher income schools, two-year colleges made up a much larger share of the total first fall enrollments for students graduating from low income high schools (regardless of the minority or geographic category that the school fell into) and from higher income, high minority high schools. Figure C shows enrollment at two-year institutions as a proportion of the total college-going rate. Less than one-third of all college enrollments of graduates of higher income, low minority schools, regardless of locale, occurred at two-year institutions. This percentage was much higher for students from low income schools. It was also similarly high for students from higher income, high minority schools.
Figure C. Enrollment in Two-Year Institutions as Proportion of Total College-Going Rate, First Fall after High School Graduation, Class of 2013, Public Non-Charter Schools
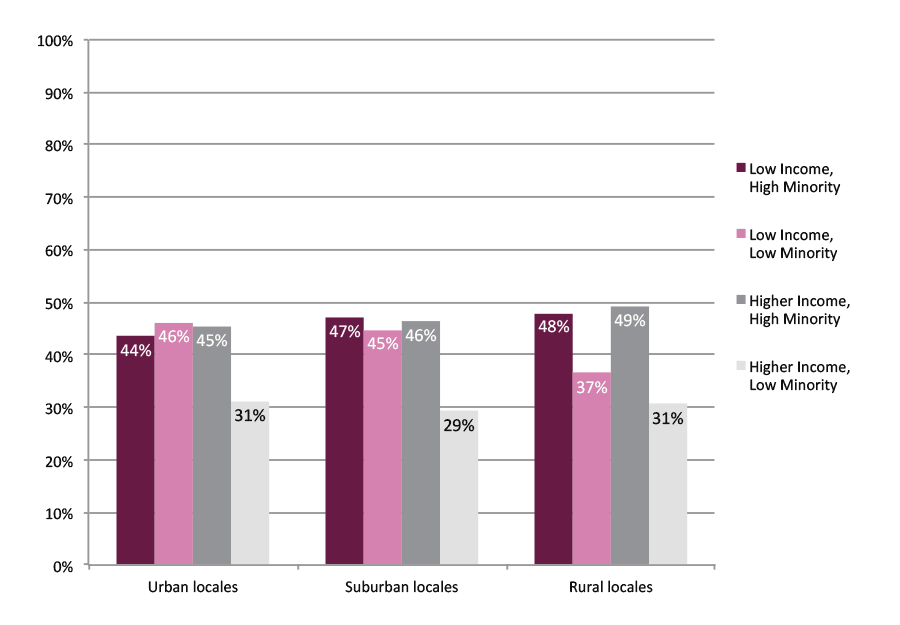
*This figure is based on data shown in Appendix C, Table 1.
Enrollments at out-of-state institutions as a proportion of all enrollments were higher for students from higher income high schools. Eleven to 23 percent of the college-going graduates from higher income schools enrolled at out-of-state institutions, compared to just nine to 13 percent of those from low income high schools (see Appendix C, Table 1).
Some students do not make it to college in the fall immediately after high school, but enroll in the following winter, spring, or even summer terms. Across all groups, enrollment rates increased markedly when we counted all enrollments in the first year after graduation, compared to the first fall enrollments (see Figure D below and Appendix C, Tables 2 and 3). These increases were similar among graduates from low income and higher income schools. The increases were driven mostly by students attending two-year institutions, which is not surprising as two-year institutions allow more flexibility in start times.
Figure D. Changes in Enrollment Rates from the First Fall to the First Year after High School Graduation, Class of 2012, Public Non-Charter, Urban Schools
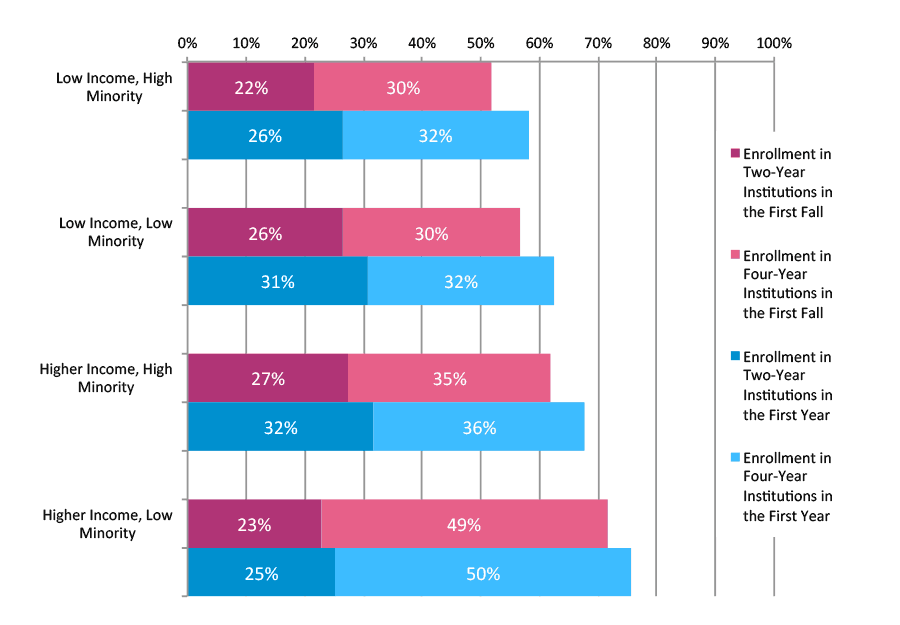
*This figure is based on data shown in Appendix C, Tables 2 and 3.
Similar to increases from the first fall to the first year, including college enrollments in the second year after high school graduation increased total college enrollment rates by an additional four to six percentage points, compared to the first year enrollments alone (see Appendix C, Tables 4 and 5). The pattern remained consistent in the sense that the majority of additional enrollments in the second year after high school graduation were in two-year institutions. These results show that while the incremental college-going rate dramatically decreases one year after high school graduation, students continue enrolling in colleges and universities beyond the first year. Even among low income schools, where the immediate college enrollment rate was only around 50 percent, at least two-thirds of graduates (65 percent) enrolled in college within two years after graduation.
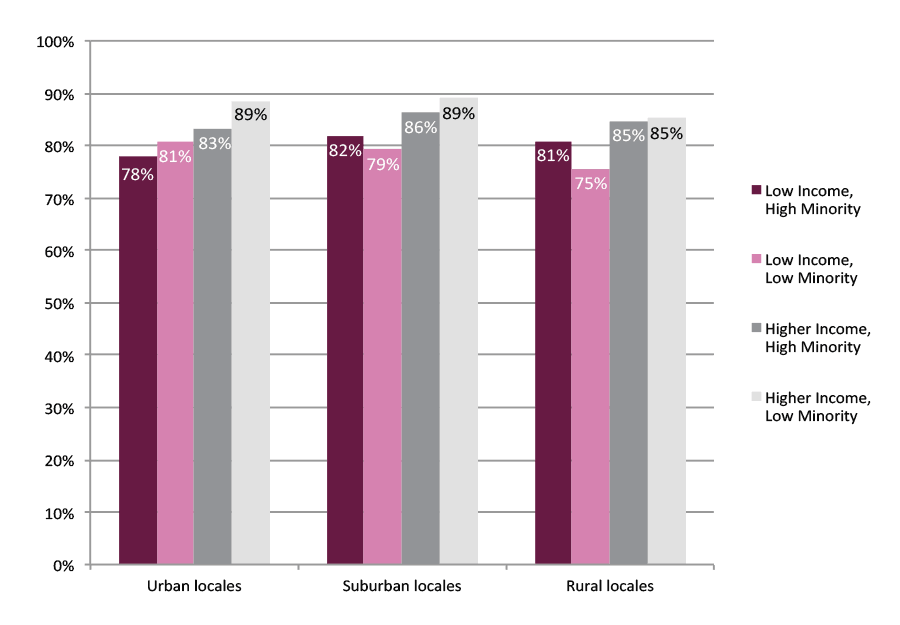
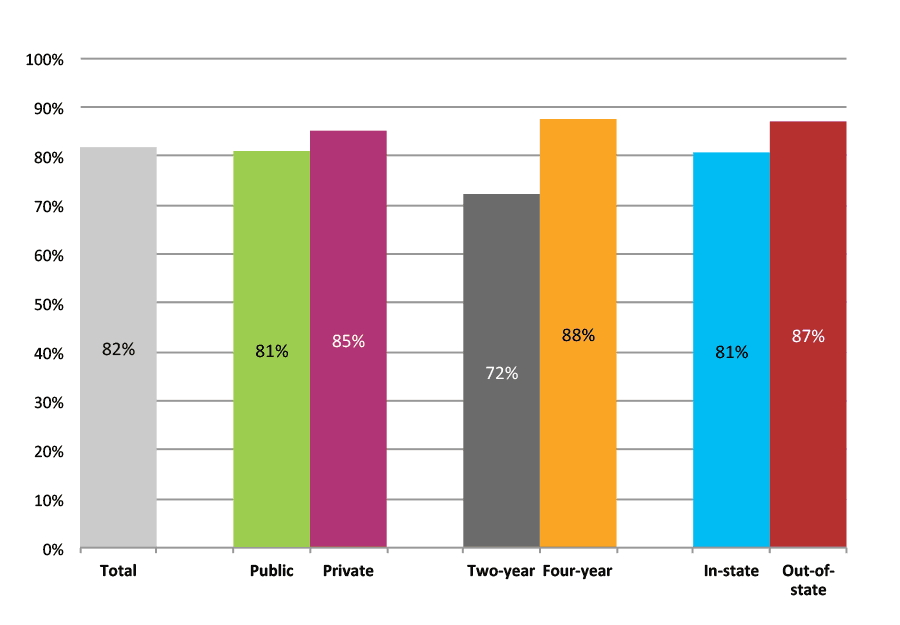
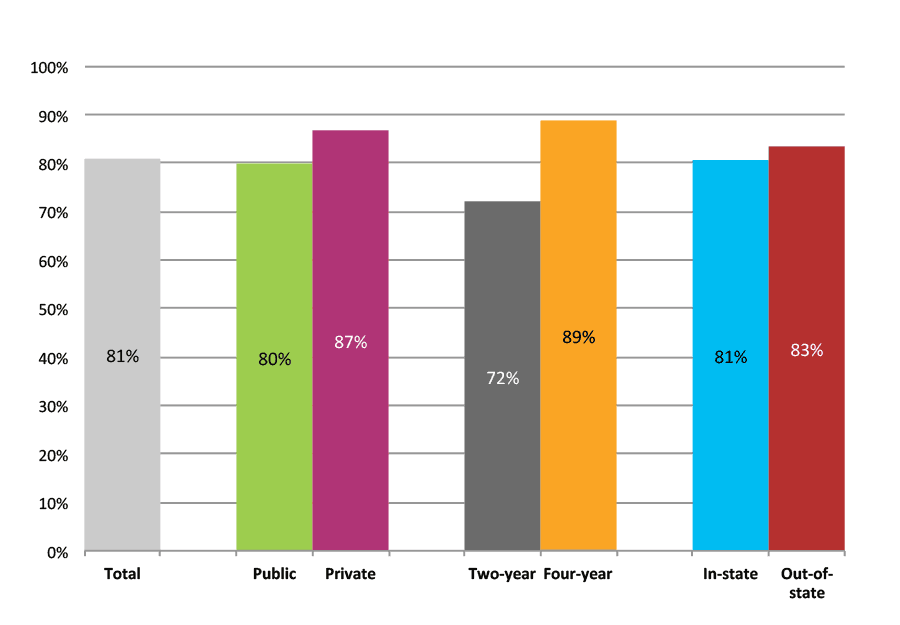
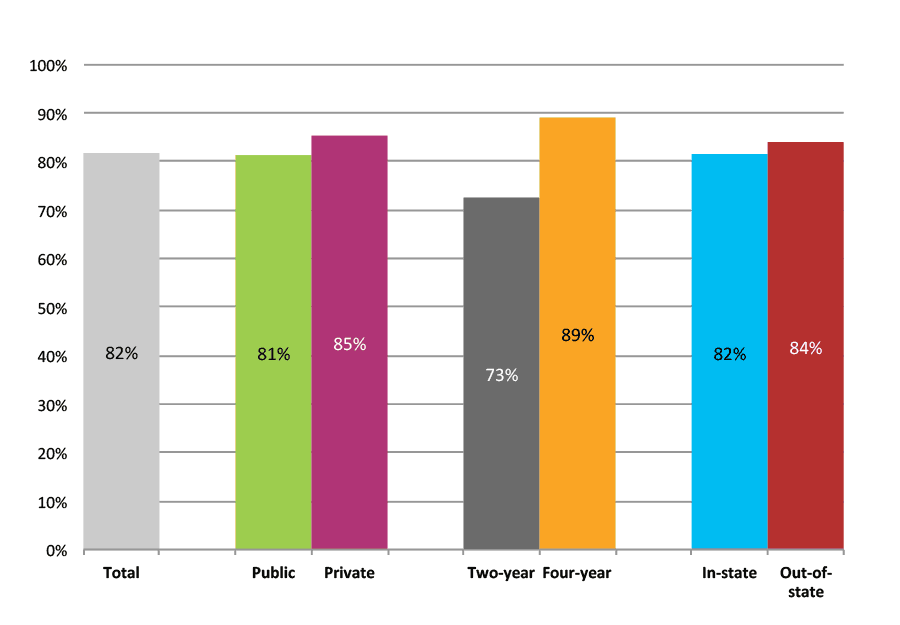
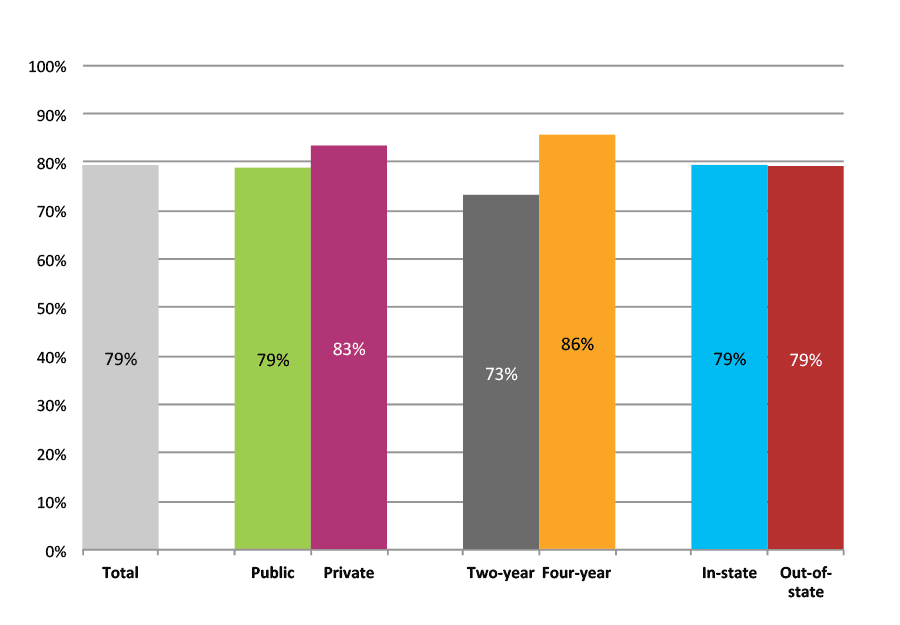
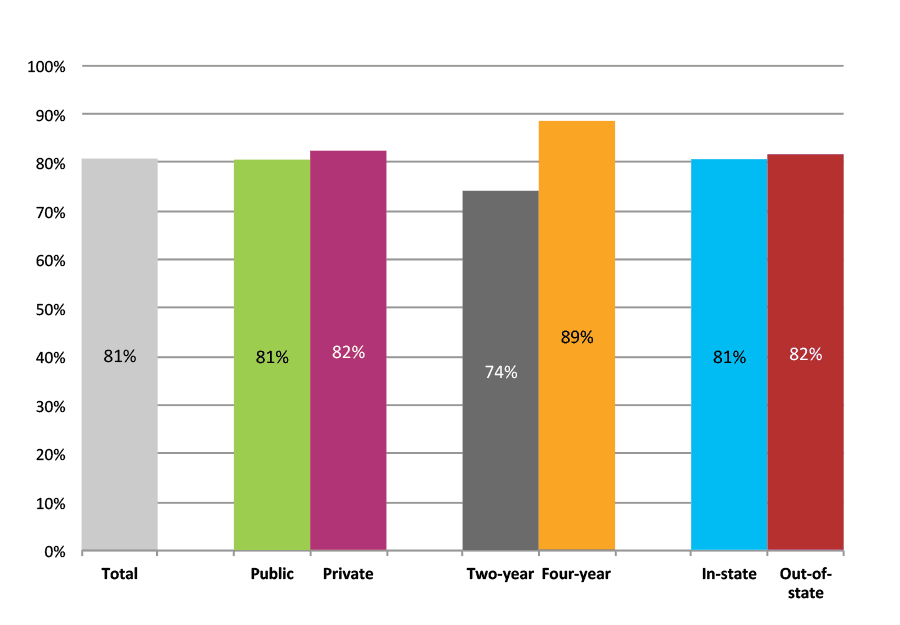
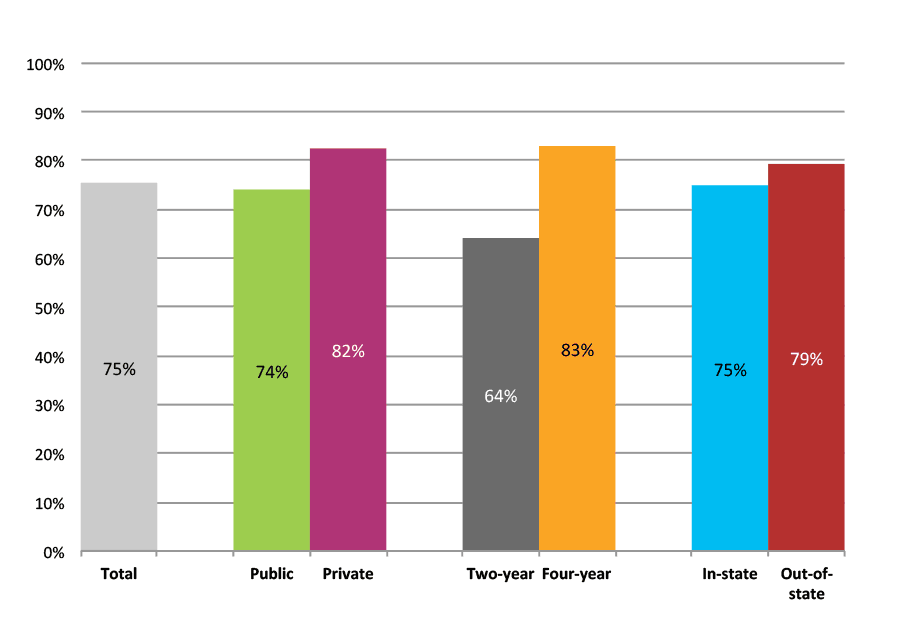
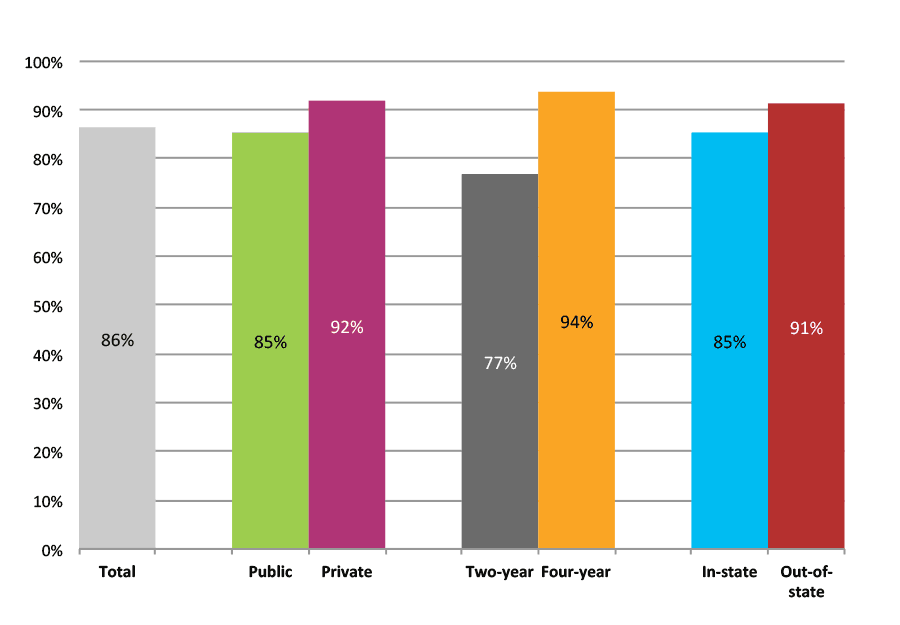
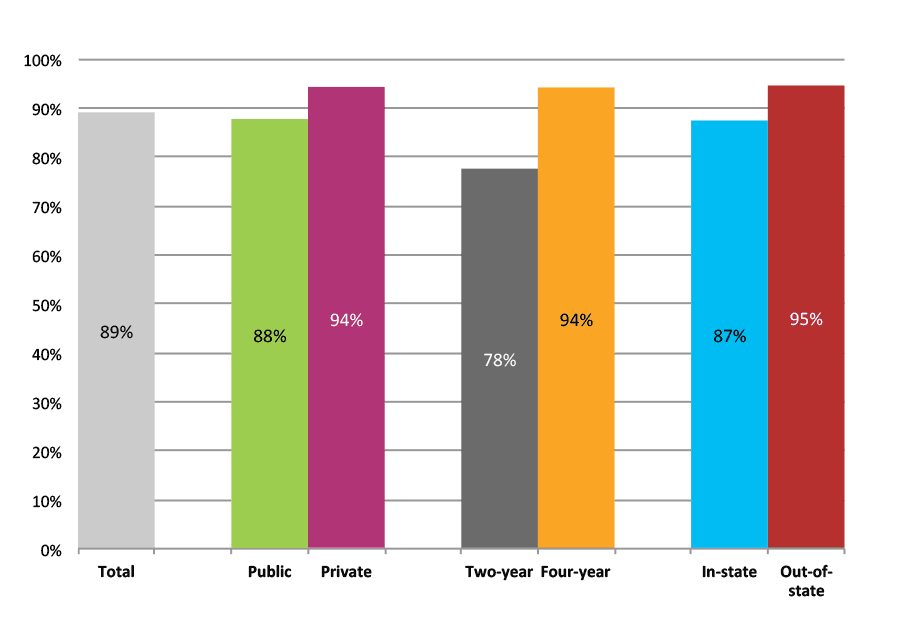
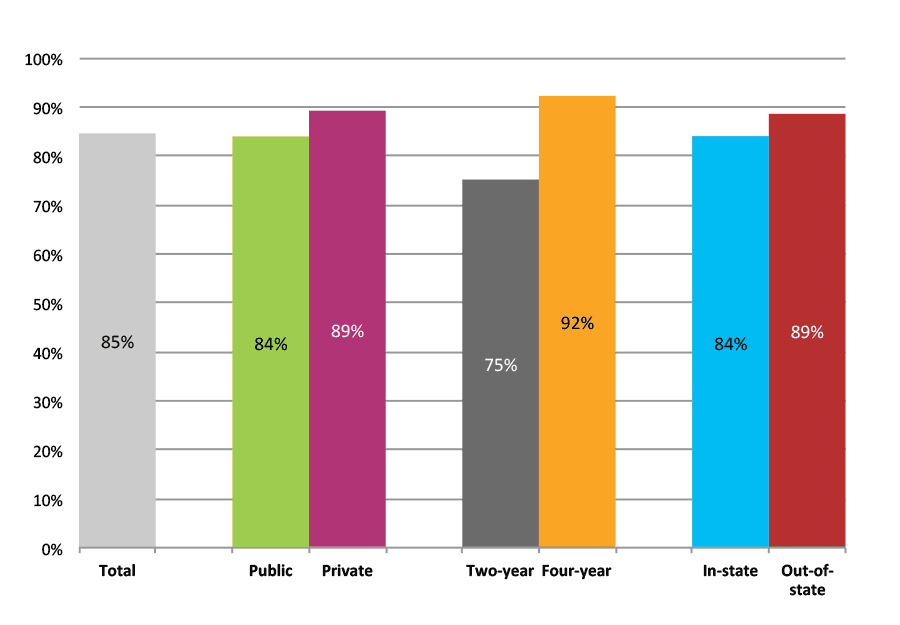
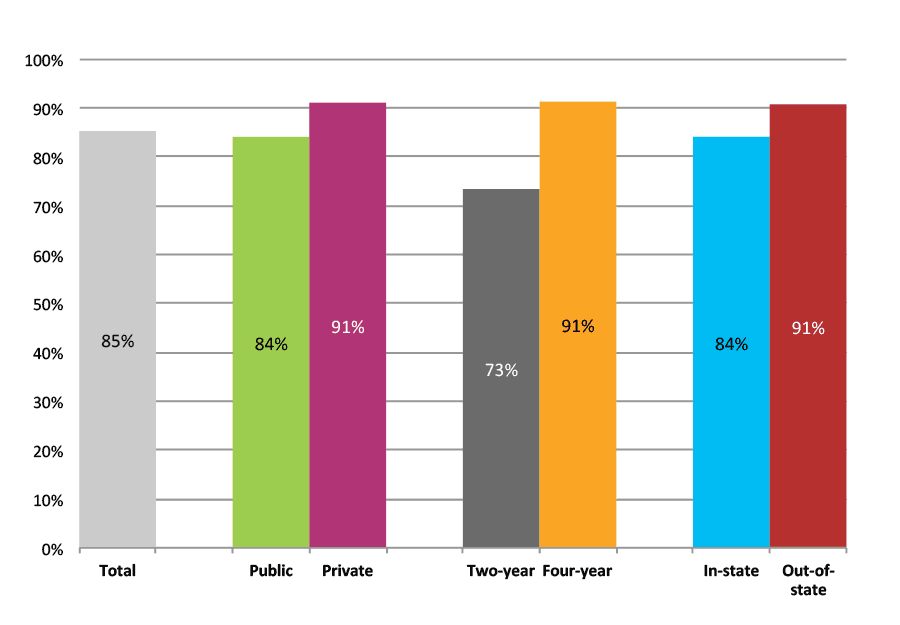
To examine how well a high school equips students to succeed in college we looked at the rates of persistence from the first to the second year of college, for the high school graduating class of 2011 (Figure E). This is the percentage of students enrolled in the first year after high school graduation who remained enrolled in postsecondary education in the second year. It includes students who may have transferred or re-enrolled at a different institution from where they started. While in general, persistence rates for graduates of all high schools were high (75 percent to 89 percent), some differences existed across groups. Students from higher income high schools had higher persistence rates than those from low income high schools. Regardless of high school type, persistence rates among students who enrolled in private colleges and universities were higher than those in public institutions. Persistence rates for all students were also higher in four-year institutions than in two-year institutions (see Appendix C, Table 7).
Figure E. Persistence Rates from First to Second Year of College for Class of 2011
*This figure is based on data shown in Appendix C, Table 7.
College Enrollment and Persistence Rates for Graduates from Public Charter High Schools
Among public charter schools that used STHS services (13 percent of all charter schools, enrolling 16 percent of charter school students), 60 percent of 2013 graduates enrolled in college in the fall term immediately after high school graduation. One-third of them had their first enrollment in a two-year institution and one in five enrolled in a private college or university. The first year college-going rate increased six percentage points when enrollments beyond the first fall were considered. Another six percent of students graduating from public charter high schools in 2013 enrolled in colleges and universities in the second year after high school graduation. College persistence from the first to the second year for students from public charter high schools was 82 percent.
Data coverage rates for public charter schools are low and we do not divide them into categories. These results may not be representative of all charter schools. They are intended only to provide reference points for schools that use the StudentTracker service, so they can compare their results to those of other schools that use StudentTracker.
We do not recommend comparing the overall public charter school results to those of public non-charter schools or private schools.
College Enrollment and Persistence Rates for Graduates from Private High Schools
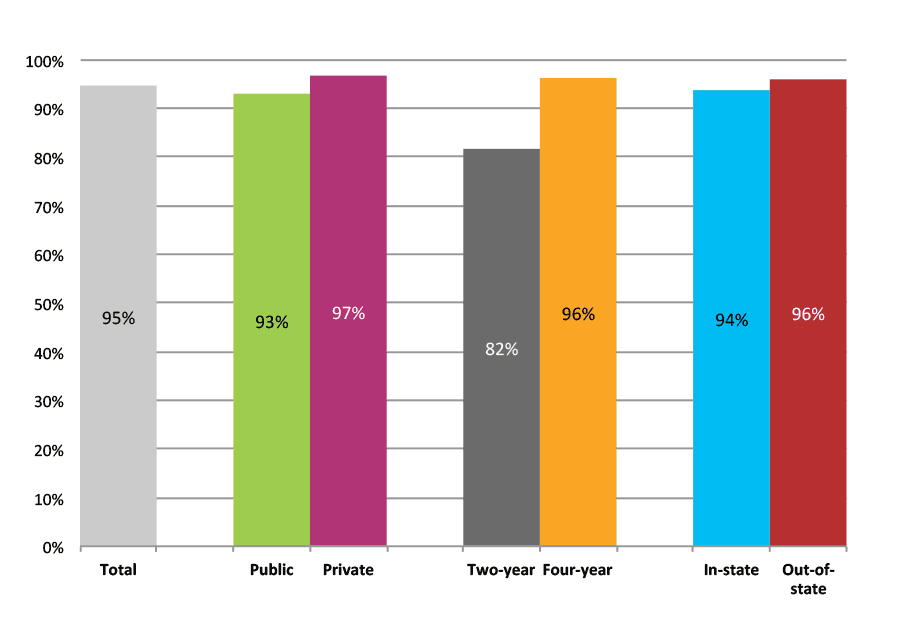
Among private schools that used the STHS service (three percent of all private schools, enrolling 10 percent of private school students), 86 percent of 2013 graduates enrolled in college in the fall term immediately after high school graduation. Only 10 percent had their first enrollment in a two-year institution and nearly half (43 percent) enrolled in a private college or university. Smaller increases in the college-going rate were found from the first fall to the first year (two percentage point increase) and from the first to the second year (three percentage point increase). College persistence from the first to the second year for students from private high schools was 95 percent.
Data coverage rates for private high schools are significantly lower than those for public non-charter and public charter schools. These results may not be representative of all private schools. They are intended only to provide reference points for those schools that use the StudentTracker service so they can compare their results to those of other schools that use StudentTracker.
We do not recommend comparing the overall private school results to those of public non-charter schools or charter schools.
Percentile Distributions for Enhanced Goal-Setting
This year’s report introduces, for the first time, an additional resource in the form of percentile distributions of school-level outcomes in each category. The percentile distributions show that, even among the lowest-performing categories of schools, there is often a wide range of outcomes, with some schools performing markedly above or below the average. The percentiles offer additional guidance to schools in setting goals and in contextualizing their results. The fact that there are schools in every category with college-going rates much higher than the average for the group should not detract from the overall results showing that college-going rates for students from low-income schools are lower on average than those from higher income schools.
The next section shows each of the college outcomes separately for each category of public non-charter high schools, as well as for charter and private schools. Outcomes are reported in two different ways: school percentile distributions and student-weighted totals (see details in Section 2).
Section 2: Results by High School Type
Guidance on How to Interpret the Outcomes in this Section
This section provides outcomes in two different ways: school percentile distributions and student-weighted totals.
Tables with student-weighted totals are designed to enable individual schools and districts to compare their own StudentTracker results directly to the national benchmarks. The totals are calculated by computing the mean among all schools in the category, weighted by the size of each school’s graduating class. By placing their own results into the context of these aggregate totals, practitioners can better understand the meaning of their students’ college access and persistence outcomes.
Tables with school percentile distributions are designed to enable individual schools and districts to identify the approximate percentile rank of their students’ college-going rate. These distributions are calculated by ranking schools on the outcome without consideration of school size or number of graduates. Thus, if a school’s college-going rate is the same as the rate at the 75th percentile, the school is said to have a college-going rate that is equal to or higher than that of 75 percent of all StudentTracker schools in that category.
Results for Public Non-Charter High Schools
Outcomes for Low Income, High Minority, Urban High Schools
Table 1a. College Enrollment Rates in the First Fall after High School Graduation for Classes 2012 and 2013, School Percentile Distribution
| N of schools | 25th percentile | 50th percentile | 75th percentile | |
| 2012 | 666 | 40% | 50% | 61% |
| 2013 | 521 | 38% | 49% | 60% |
Table 1b. College Enrollment Rates in the First Fall after High School Graduation for Classes 2012 and 2013, Student-Weighted Totals
| N of students | Total | Public | Private | Two-year | Four-year | In-state | Out-of-state | |
| 2012 | 131,395 | 52% | 44% | 8% | 22% | 30% | 45% | 7% |
| 2013 | 99,679 | 51% | 43% | 8% | 22% | 29% | 44% | 6% |
Figure 1b. College Enrollment Rates in the First Fall after High School Graduation for Classes 2012 and 2013, Student-Weighted Totals
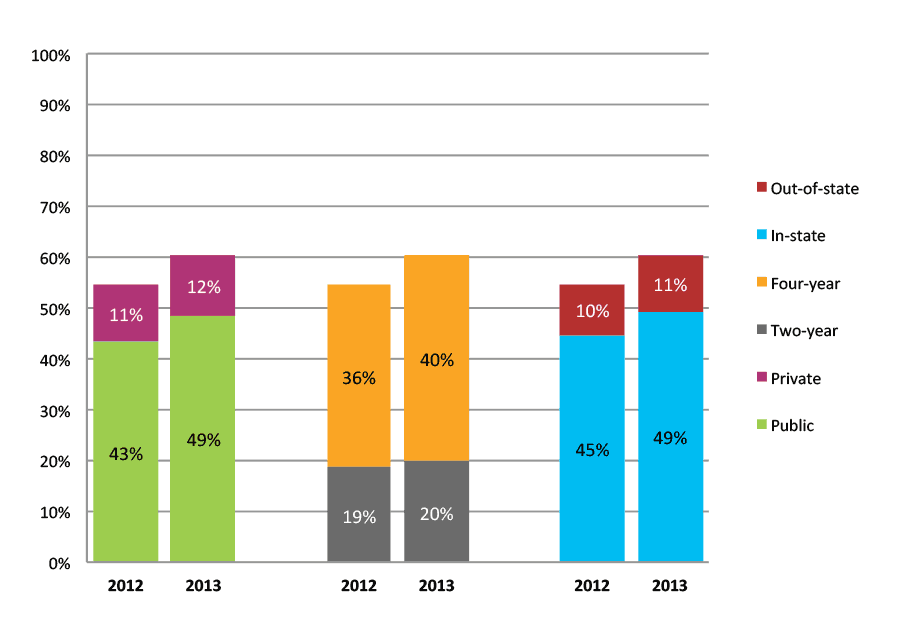
Table 2a. College Enrollment Rates in the First Year after High School Graduation for Classes 2011 and 2012, School Percentile Distribution
| N of schools | 25th percentile | 50th percentile | 75th percentile | |
| 2011 | 774 | 48% | 59% | 70% |
| 2012 | 666 | 46% | 58% | 68% |
Table 2b. College Enrollment Rates in the First Year after High School Graduation for Classes 2011 and 2012, Student-Weighted Totals
| N of students | Total | Public | Private | Two-year | Four-year | In-state | Out-of-state | |
| 2011 | 159,362 | 60% | 51% | 8% | 29% | 31% | 53% | 7% |
| 2012 | 131,395 | 58% | 49% | 9% | 26% | 32% | 51% | 7% |
Figure 2b. College Enrollment Rates in the First Year after High School Graduation for Classes 2011 and 2012, Student-Weighted Totals
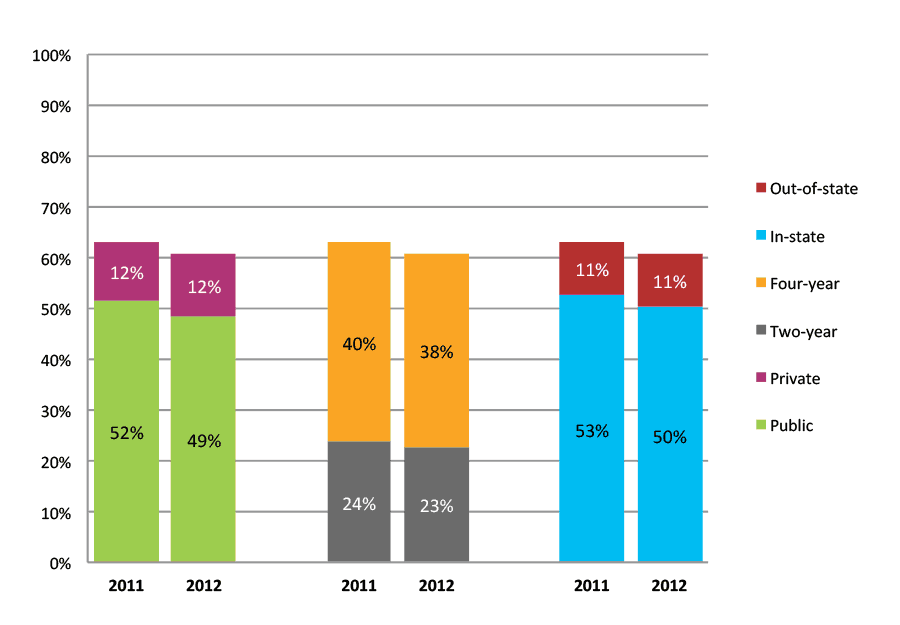
Table 3a. College Enrollment Rates in the First Two Years after High School Graduation for Classes 2010 and 2011, School Percentile Distribution
| N of schools | 25th percentile | 50th percentile | 75th percentile | |
| 2010 | 572 | 54% | 64% | 74% |
| 2011 | 774 | 54% | 65% | 75% |
Table 3b. College Enrollment Rates in the First Two Years after High School Graduation for Classes 2010 and 2011, Student-Weighted Totals
| N of students | Total | Public | Private | Two-year | Four-year | In-state | Out-of-state | |
| 2010 | 132,196 | 65% | 56% | 9% | 34% | 30% | 58% | 7% |
| 2011 | 159,362 | 65% | 56% | 9% | 33% | 32% | 58% | 8% |
Figure 3b. College Enrollment Rates in the First Two Years after High School Graduation for Classes 2010 and 2011, Student-Weighted Totals

Table 4a. Persistence Rates from First to Second Year of College for Class of 2011, School Percentile Distribution
| N of schools | 25th percentile | 50th percentile | 75th percentile | |
| 2011 | 774 | 67% | 76% | 83% |
Table 4b. Persistence Rates from First to Second Year of College for Class of 2011, Student-Weighted Totals
| Students enrolled in first year | Total | Public | Private | Two-year | Four-year | In-state | Out-of-state | |
| 2011 | 94,848 | 78% | 77% | 82% | 69% | 86% | 77% | 82% |
Figure 4b. Persistence Rates from First to Second Year of College for Class of 2011, Student-Weighted Totals
Outcomes for Low Income, Low Minority, Urban High Schools
Table 5a. College Enrollment Rates in the First Fall after High School Graduation for Classes 2012 and 2013, School Percentile Distribution
| N of schools | 25th percentile | 50th percentile | 75th percentile | |
| 2012 | 89 | 44% | 52% | 62% |
| 2013 | 68 | 45% | 53% | 63% |
Table 5b. College Enrollment Rates in the First Fall after High School Graduation for Classes 2012 and 2013, Student-Weighted Totals
| N of students | Total | Public | Private | Two-year | Four-year | In-state | Out-of-state | |
| 2012 | 23,383 | 57% | 48% | 8% | 26% | 30% | 51% | 6% |
| 2013 | 20,254 | 58% | 49% | 8% | 27% | 31% | 52% | 5% |
Figure 5b. College Enrollment Rates in the First Fall after High School Graduation for Classes 2012 and 2013, Student-Weighted Totals
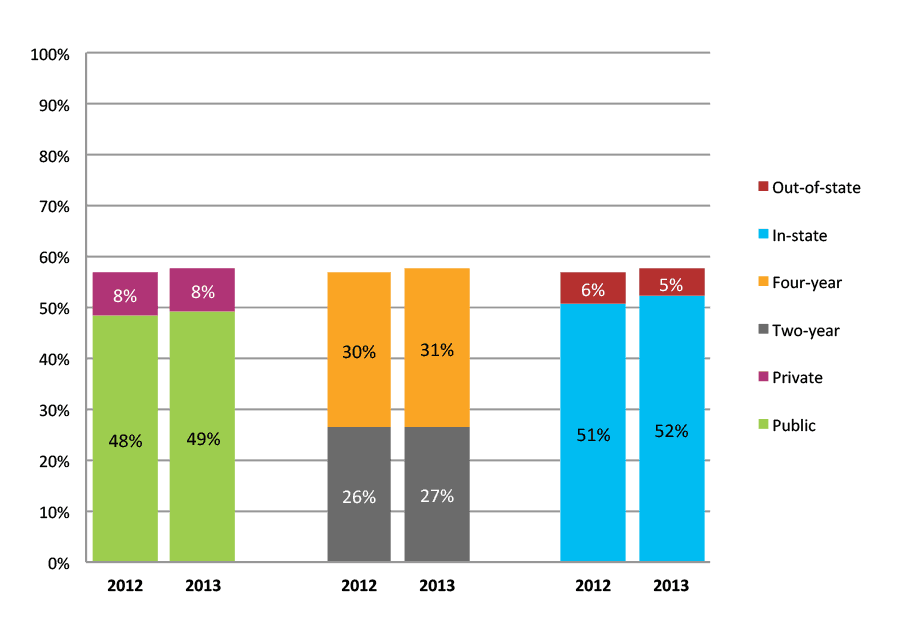
Table 6a. College Enrollment Rates in the First Year after High School Graduation for Classes 2011 and 2012, School Percentile Distribution
| N of schools | 25th percentile | 50th percentile | 75th percentile | |
| 2011 | 87 | 49% | 59% | 68% |
| 2012 | 89 | 50% | 58% | 69% |
Table 6b. College Enrollment Rates in the First Year after High School Graduation for Classes 2011 and 2012, Student-Weighted Totals
| N of students | Total | Public | Private | Two-year | Four-year | In-state | Out-of-state | |
| 2011 | 24,828 | 62% | 53% | 9% | 29% | 32% | 55% | 6% |
| 2012 | 23,383 | 62% | 53% | 9% | 31% | 32% | 56% | 6% |
Figure 6b. College Enrollment Rates in the First Year after High School Graduation for Classes 2011 and 2012, Student-Weighted Totals

Table 7a. College Enrollment Rates in the First Two Years after High School Graduation for Classes 2010 and 2011, School Percentile Distribution
| N of schools | 25th percentile | 50th percentile | 75th percentile | |
| 2010 | 77 | 56% | 67% | 79% |
| 2011 | 87 | 55% | 63% | 74% |
Table 7b. College Enrollment Rates in the First Two Years after High School Graduation for Classes 2010 and 2011, Student-Weighted Totals
| N of students | Total | Public | Private | Two-year | Four-year | In-state | Out-of-state | |
| 2010 | 20,275 | 70% | 59% | 11% | 35% | 35% | 62% | 7% |
| 2011 | 24,828 | 66% | 57% | 10% | 33% | 34% | 59% | 7% |
Figure 7b. College Enrollment Rates in the First Two Years after High School Graduation for Classes 2010 and 2011, Student-Weighted Totals
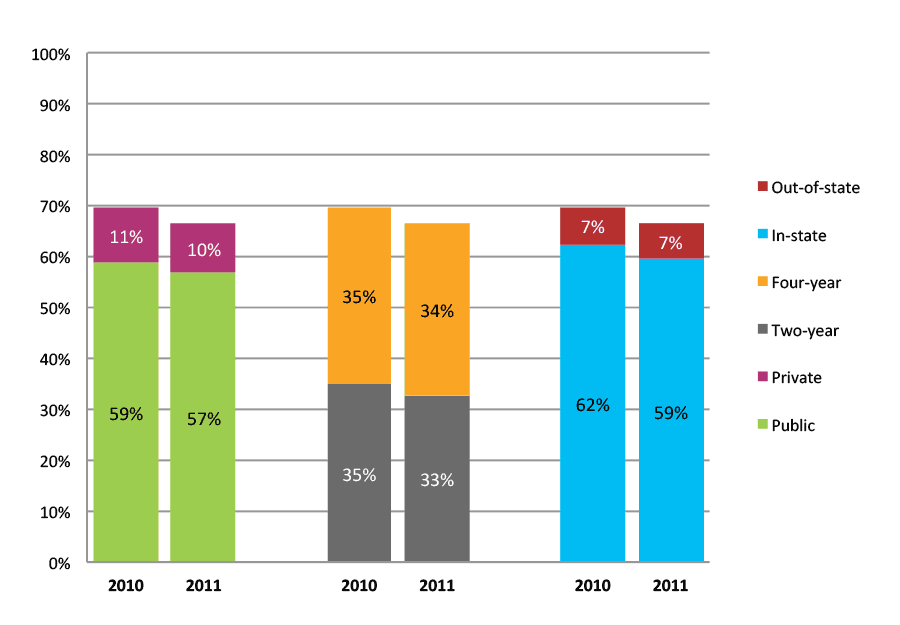
Table 8a. Persistence Rates from First to Second Year of College for Class of 2011, School Percentile Distribution
| N of schools | 25th percentile | 50th percentile | 75th percentile | |
| 2011 | 87 | 72% | 79% | 84% |
Table 8b. Persistence Rates from First to Second Year of College for Class of 2011, Student-Weighted Totals
| Students enrolled in first year | Total | Public | Private | Two-year | Four-year | In-state | Out-of-state | |
| 2011 | 15,320 | 81% | 80% | 87% | 72% | 89% | 81% | 83% |
Figure 8b. Persistence Rates from First to Second Year of College for Class of 2011, Student-Weighted Totals
Outcomes for Low Income, High Minority, Suburban High Schools
Table 9a. College Enrollment Rates in the First Fall after High School Graduation for Classes 2012 and 2013, School Percentile Distribution
| N of schools | 25th percentile | 50th percentile | 75th percentile | |
| 2012 | 196 | 45% | 52% | 60% |
| 2013 | 161 | 43% | 50% | 56% |
Table 9b. College Enrollment Rates in the First Fall after High School Graduation for Classes 2012 and 2013, Student-Weighted Totals
| N of students | Total | Public | Private | Two-year | Four-year | In-state | Out-of-state | |
| 2012 | 69,814 | 54% | 47% | 7% | 19% | 34% | 48% | 6% |
| 2013 | 45,454 | 50% | 44% | 7% | 24% | 27% | 44% | 6% |
Figure 9b. College Enrollment Rates in the First Fall after High School Graduation for Classes 2012 and 2013, Student-Weighted Totals
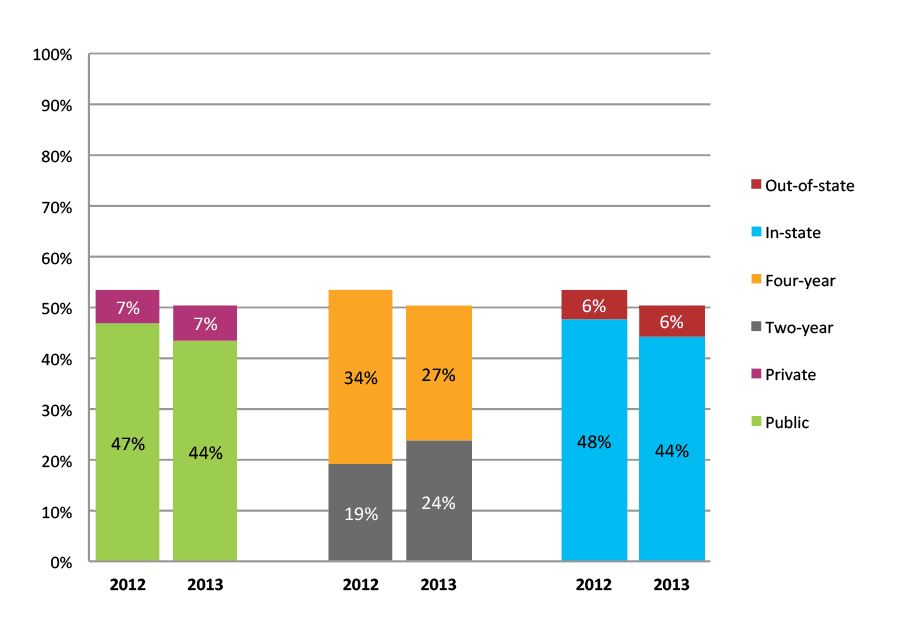
Table 10a. College Enrollment Rates in the First Year after High School Graduation for Classes 2011 and 2012, School Percentile Distribution
| N of schools | 25th percentile | 50th percentile | 75th percentile | |
| 2011 | 229 | 55% | 62% | 69% |
| 2012 | 196 | 53% | 58% | 67% |
Table 10b. College Enrollment Rates in the First Year after High School Graduation for Classes 2011 and 2012, Student-Weighted Totals
| N of students | Total | Public | Private | Two-year | Four-year | In-state | Out-of-state | |
| 2011 | 86,182 | 63% | 56% | 7% | 28% | 35% | 57% | 6% |
| 2012 | 69,814 | 60% | 53% | 7% | 23% | 37% | 54% | 7% |
Figure 10b. College Enrollment Rates in the First Year after High School Graduation for Classes 2011 and 2012, Student-Weighted Totals

Table 11a. College Enrollment Rates in the First Two Years after High School Graduation for Classes 2010 and 2011, School Percentile Distribution
| N of schools | 25th percentile | 50th percentile | 75th percentile | |
| 2010 | 192 | 61% | 68% | 75% |
| 2011 | 229 | 62% | 68% | 74% |
Table 11b. College Enrollment Rates in the First Two Years after High School Graduation for Classes 2010 and 2011, Student-Weighted Totals
| N of students | Total | Public | Private | Two-year | Four-year | In-state | Out-of-state | |
| 2010 | 69,869 | 68% | 60% | 8% | 32% | 36% | 62% | 6% |
| 2011 | 86,182 | 69% | 61% | 8% | 32% | 37% | 62% | 7% |
Figure 11b. College Enrollment Rates in the First Two Years after High School Graduation for Classes 2010 and 2011, Student-Weighted Totals

Table 12a. Persistence Rates from First to Second Year of College for Class of 2011, School Percentile Distribution
| N of schools | 25th percentile | 50th percentile | 75th percentile | |
| 2011 | 229 | 76% | 82% | 86% |
Table 12b. Persistence Rates from First to Second Year of College for Class of 2011, Student-Weighted Totals
| Students enrolled in first year | Total | Public | Private | Two-year | Four-year | In-state | Out-of-state | |
| 2011 | 54,331 | 82% | 81% | 85% | 73% | 89% | 82% | 84% |
Figure 12b. Persistence Rates from First to Second Year of College for Class of 2011, Student-Weighted Totals
Outcomes for Low Income, Low Minority, Suburban High Schools
Table 13a. College Enrollment Rates in the First Fall after High School Graduation for Classes 2012 and 2013, School Percentile Distribution
| N of schools | 25th percentile | 50th percentile | 75th percentile | |
| 2012 | 59 | 40% | 49% | 54% |
| 2013 | 51 | 36% | 47% | 56% |
Table 13b. College Enrollment Rates in the First Fall after High School Graduation for Classes 2012 and 2013, Student-Weighted Totals
| N of students | Total | Public | Private | Two-year | Four-year | In-state | Out-of-state | |
| 2012 | 13,526 | 49% | 42% | 7% | 22% | 27% | 43% | 6% |
| 2013 | 11,349 | 47% | 40% | 7% | 21% | 26% | 41% | 6% |
Figure 13b. College Enrollment Rates in the First Fall after High School Graduation for Classes 2012 and 2013, Student-Weighted Totals
Table 14a. College Enrollment Rates in the First Year after High School Graduation for Classes 2011 and 2012, School Percentile Distribution
| N of schools | 25th percentile | 50th percentile | 75th percentile | |
| 2011 | 56 | 48% | 57% | 63% |
| 2012 | 59 | 46% | 54% | 60% |
Table 14b. College Enrollment Rates in the First Year after High School Graduation for Classes 2011 and 2012, Student-Weighted Totals
| N of students | Total | Public | Private | Two-year | Four-year | In-state | Out-of-state | |
| 2011 | 11,582 | 60% | 53% | 7% | 30% | 29% | 54% | 6% |
| 2012 | 13,526 | 54% | 47% | 8% | 26% | 28% | 48% | 6% |
Figure 14b. College Enrollment Rates in the First Year after High School Graduation for Classes 2011 and 2012, Student-Weighted Totals
Table 15a. College Enrollment Rates in the First Two Years after High School Graduation for Classes 2010 and 2011, School Percentile Distribution
| N of schools | 25th percentile | 50th percentile | 75th percentile | |
| 2010 | 41 | 57% | 60% | 70% |
| 2011 | 56 | 53% | 61% | 69% |
Table 15b. College Enrollment Rates in the First Two Years after High School Graduation for Classes 2010 and 2011, Student-Weighted Totals
| N of students | Total | Public | Private | Two-year | Four-year | In-state | Out-of-state | |
| 2010 | 9,281 | 65% | 55% | 10% | 34% | 31% | 58% | 7% |
| 2011 | 11,582 | 64% | 57% | 7% | 34% | 31% | 58% | 6% |
Figure 15b. College Enrollment Rates in the First Two Years after High School Graduation for Classes 2010 and 2011, Student-Weighted Totals
Table 16a. Persistence Rates from First to Second Year of College for Class of 2011, School Percentile Distribution
| N of schools | 25th percentile | 50th percentile | 75th percentile | |
| 2011 | 56 | 70% | 75% | 82% |
Table 16b. Persistence Rates from First to Second Year of College for Class of 2011, Student-Weighted Totals
| Students enrolled in first year | Total | Public | Private | Two-year | Four-year | In-state | Out-of-state | |
| 2011 | 6,894 | 79% | 79% | 83% | 73% | 86% | 79% | 79% |
Figure 16b. Persistence Rates from First to Second Year of College for Class of 2011, Student-Weighted Totals
Outcomes for Low Income, High Minority, Rural High Schools
Table 17a. College Enrollment Rates in the First Fall after High School Graduation for Classes 2012 and 2013, School Percentile Distribution
| N of schools | 25th percentile | 50th percentile | 75th percentile | |
| 2012 | 82 | 47% | 54% | 60% |
| 2013 | 68 | 47% | 52% | 62% |
Table 17b. College Enrollment Rates in the First Fall after High School Graduation for Classes 2012 and 2013, Student-Weighted Totals
| N of students | Total | Public | Private | Two-year | Four-year | In-state | Out-of-state | |
| 2012 | 18,822 | 53% | 47% | 6% | 24% | 29% | 47% | 6% |
| 2013 | 15,563 | 52% | 46% | 6% | 25% | 27% | 47% | 5% |
Figure 17b. College Enrollment Rates in the First Fall after High School Graduation for Classes 2012 and 2013, Student-Weighted Totals
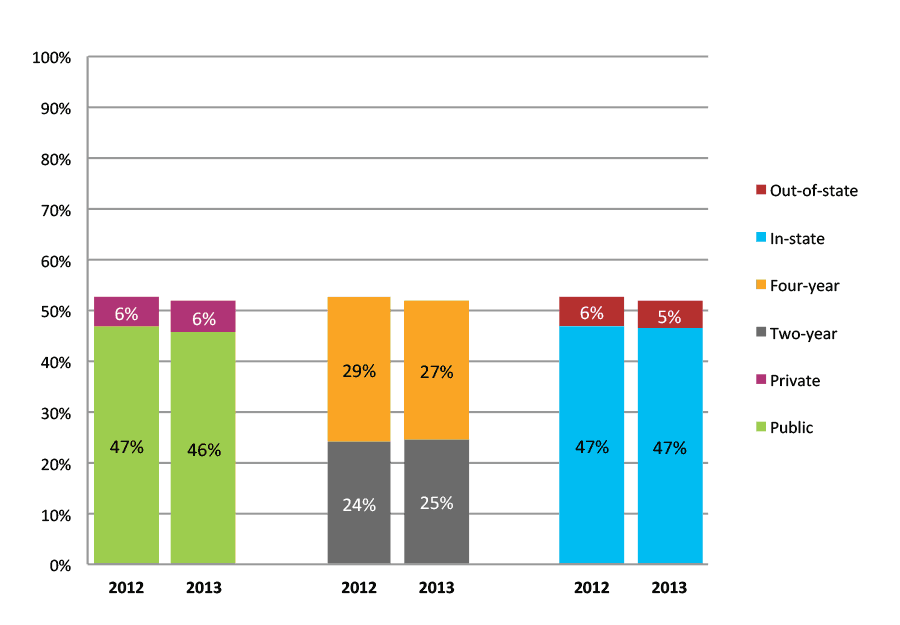
Table 18a. College Enrollment Rates in the First Year after High School Graduation for Classes 2011 and 2012, School Percentile Distribution
| N of schools | 25th percentile | 50th percentile | 75th percentile | |
| 2011 | 88 | 53% | 60% | 66% |
| 2012 | 82 | 53% | 59% | 65% |
Table 18b. College Enrollment Rates in the First Year after High School Graduation for Classes 2011 and 2012, Student-Weighted Totals
| N of students | Total | Public | Private | Two-year | Four-year | In-state | Out-of-state | |
| 2011 | 22,837 | 60% | 54% | 6% | 32% | 27% | 54% | 5% |
| 2012 | 18,822 | 59% | 52% | 7% | 29% | 30% | 53% | 6% |
Figure 18b. College Enrollment Rates in the First Year after High School Graduation for Classes 2011 and 2012, Student-Weighted Totals
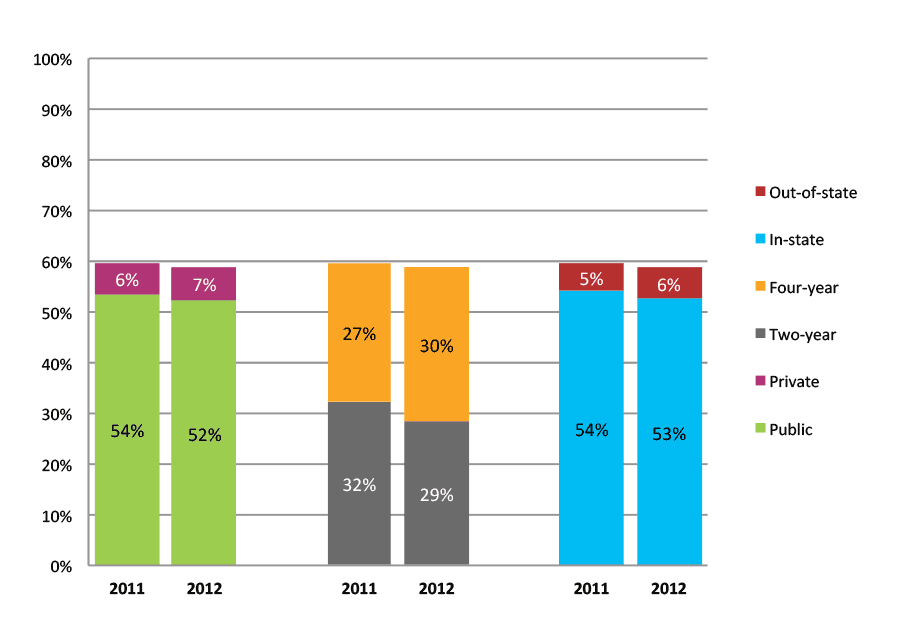
Table 19a. College Enrollment Rates in the First Two Years after High School Graduation for Classes 2010 and 2011, School Percentile Distribution
| N of schools | 25th percentile | 50th percentile | 75th percentile | |
| 2010 | 72 | 59% | 66% | 72% |
| 2011 | 88 | 59% | 66% | 72% |
Table 19b. College Enrollment Rates in the First Two Years after High School Graduation for Classes 2010 and 2011, Student-Weighted Totals
| N of students | Total | Public | Private | Two-year | Four-year | In-state | Out-of-state | |
| 2010 | 19,506 | 66% | 60% | 6% | 38% | 28% | 61% | 6% |
| 2011 | 22,837 | 66% | 59% | 7% | 37% | 29% | 59% | 6% |
Figure 19b. College Enrollment Rates in the First Two Years after High School Graduation for Classes 2010 and 2011, Student-Weighted Totals
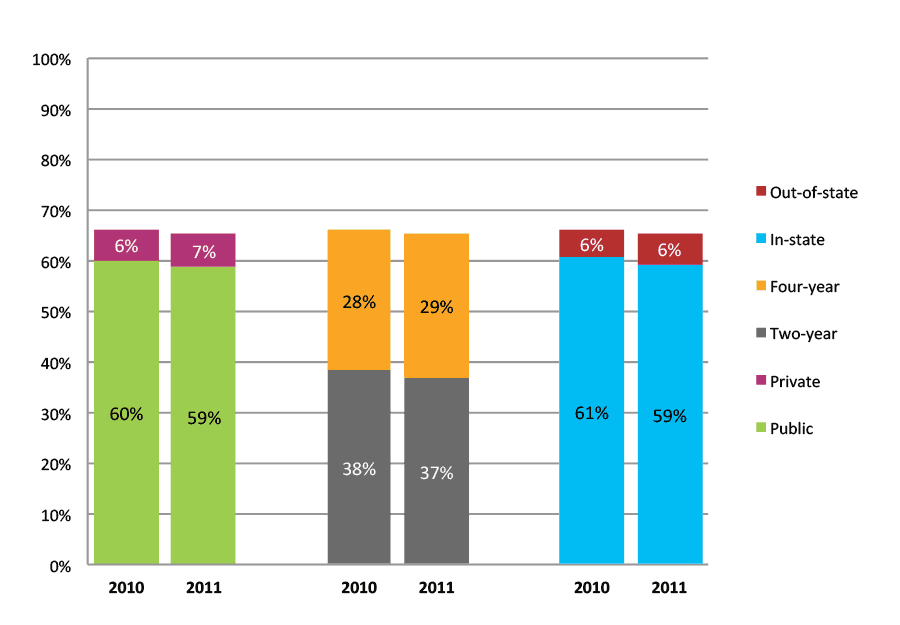
Table 20a. Persistence Rates from First to Second Year of College for Class of 2011, School Percentile Distribution
| N of schools | 25th percentile | 50th percentile | 75th percentile | |
| 2011 | 88 | 75% | 79% | 84% |
Table 20b. Persistence Rates from First to Second Year of College for Class of 2011, Student-Weighted Totals
| Students enrolled in first year | Total | Public | Private | Two-year | Four-year | In-state | Out-of-state | |
| 2011 | 13,610 | 81% | 81% | 82% | 74% | 89% | 81% | 82% |
Figure 20b. Persistence Rates from First to Second Year of College for Class of 2011, Student-Weighted Totals
Outcomes for Low Income, Low Minority, Rural High Schools
Table 21a. College Enrollment Rates in the First Fall after High School Graduation for Classes 2012 and 2013, School Percentile Distribution
| N of schools | 25th percentile | 50th percentile | 75th percentile | |
| 2012 | 369 | 31% | 44% | 55% |
| 2013 | 314 | 31% | 44% | 54% |
Table 21b. College Enrollment Rates in the First Fall after High School Graduation for Classes 2012 and 2013, Student-Weighted Totals
| N of students | Total | Public | Private | Two-year | Four-year | In-state | Out-of-state | |
| 2012 | 26,874 | 48% | 40% | 8% | 18% | 31% | 43% | 5% |
| 2013 | 23,757 | 47% | 40% | 8% | 17% | 30% | 42% | 5% |
Figure 21b. College Enrollment Rates in the First Fall after High School Graduation for Classes 2012 and 2013, Student-Weighted Totals
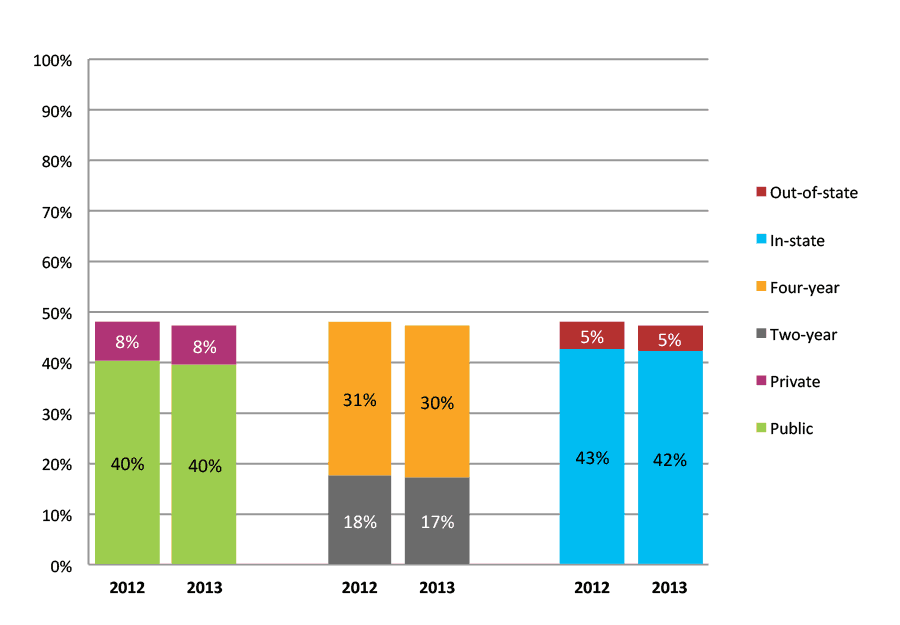
Table 22a. College Enrollment Rates in the First Year after High School Graduation for Classes 2011 and 2012, School Percentile Distribution
| N of schools | 25th percentile | 50th percentile | 75th percentile | |
| 2011 | 339 | 33% | 50% | 60% |
| 2012 | 369 | 33% | 49% | 60% |
Table 22b. College Enrollment Rates in the First Year after High School Graduation for Classes 2011 and 2012, Student-Weighted Totals
| N of students | Total | Public | Private | Two-year | Four-year | In-state | Out-of-state | |
| 2011 | 24,629 | 55% | 46% | 9% | 22% | 33% | 48% | 7% |
| 2012 | 26,874 | 52% | 44% | 8% | 20% | 32% | 46% | 6% |
Figure 22b. College Enrollment Rates in the First Year after High School Graduation for Classes 2011 and 2012, Student-Weighted Totals
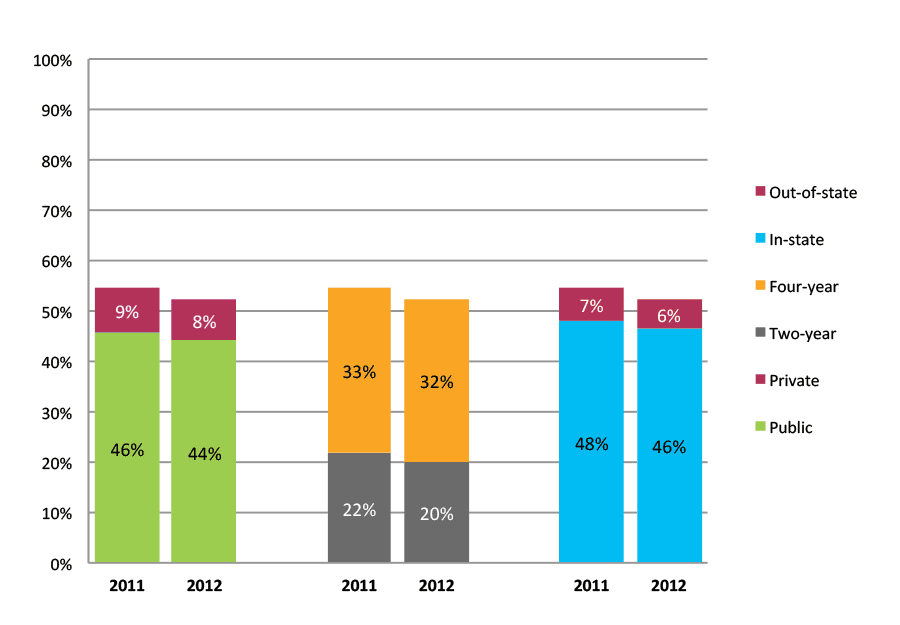
Table 23a. College Enrollment Rates in the First Two Years after High School Graduation for Classes 2010 and 2011, School Percentile Distribution
| N of schools | 25th percentile | 50th percentile | 75th percentile | |
| 2010 | 122 | 53% | 61% | 69% |
| 2011 | 339 | 40% | 55% | 64% |
Table 23b. College Enrollment Rates in the First Two Years after High School Graduation for Classes 2010 and 2011, Student-Weighted Totals
| N of students | Total | Public | Private | Two-year | Four-year | In-state | Out-of-state | |
| 2010 | 14,517 | 62% | 52% | 10% | 29% | 33% | 55% | 7% |
| 2011 | 24,629 | 59% | 50% | 10% | 25% | 35% | 52% | 8% |
Figure 23b. College Enrollment Rates in the First Two Years after High School Graduation for Classes 2010 and 2011, Student-Weighted Totals
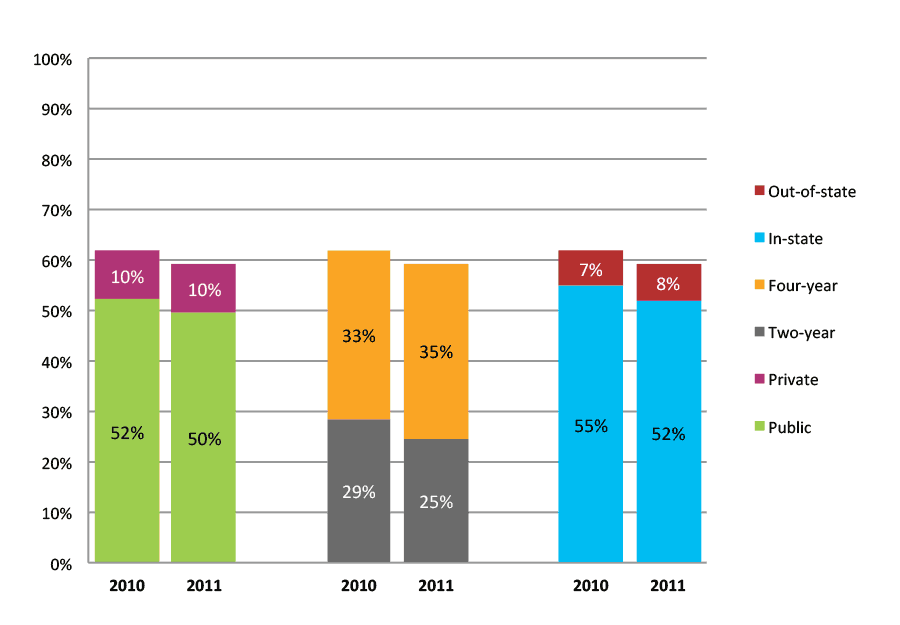
Table 24a. Persistence Rates from First to Second Year of College for Class of 2011, School Percentile Distribution
| N of schools | 25th percentile | 50th percentile | 75th percentile | |
| 2011 | 339 | 65% | 74% | 82% |
Table 24b. Persistence Rates from First to Second Year of College for Class of 2011, Student-Weighted Totals
| Students enrolled in first year | Total | Public | Private | Two-year | Four-year | In-state | Out-of-state | |
| 2011 | 13,444 | 75% | 74% | 82% | 64% | 83% | 75% | 79% |
Figure 24b. Persistence Rates from First to Second Year of College for Class of 2011, Student-Weighted Totals
Outcomes for Higher Income, High Minority, Urban High Schools
Table 25a. College Enrollment Rates in the First Fall after High School Graduation for Classes 2012 and 2013, School Percentile Distribution
| N of schools | 25th percentile | 50th percentile | 75th percentile | |
| 2012 | 234 | 53% | 63% | 71% |
| 2013 | 174 | 50% | 60% | 69% |
Table 25b. College Enrollment Rates in the First Fall after High School Graduation for Classes 2012 and 2013, Student-Weighted Totals
| N of students | Total | Public | Private | Two-year | Four-year | In-state | Out-of-state | |
| 2012 | 75,025 | 62% | 54% | 8% | 27% | 35% | 54% | 8% |
| 2013 | 59,733 | 61% | 53% | 8% | 28% | 33% | 53% | 8% |
Figure 25b. College Enrollment Rates in the First Fall after High School Graduation for Classes 2012 and 2013, Student-Weighted Totals
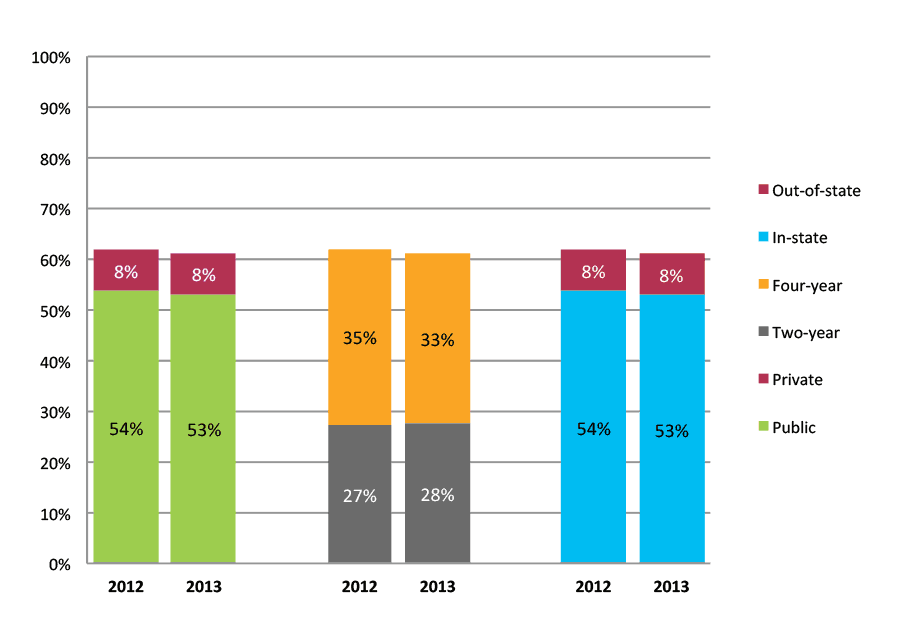
Table 26a. College Enrollment Rates in the First Year after High School Graduation for Classes 2011 and 2012, School Percentile Distribution
| N of schools | 25th percentile | 50th percentile | 75th percentile | |
| 2011 | 213 | 56% | 69% | 77% |
| 2012 | 234 | 59% | 69% | 76% |
Table 26b. College Enrollment Rates in the First Year after High School Graduation for Classes 2011 and 2012, Student-Weighted Totals
| N of students | Total | Public | Private | Two-year | Four-year | In-state | Out-of-state | |
| 2011 | 61,256 | 68% | 57% | 10% | 27% | 41% | 58% | 10% |
| 2012 | 75,025 | 68% | 59% | 9% | 32% | 36% | 59% | 9% |
Figure 26b. College Enrollment Rates in the First Year after High School Graduation for Classes 2011 and 2012, Student-Weighted Totals
Table 27a. College Enrollment Rates in the First Two Years after High School Graduation for Classes 2010 and 2011, School Percentile Distribution
| N of schools | 25th percentile | 50th percentile | 75th percentile | |
| 2010 | 218 | 67% | 75% | 83% |
| 2011 | 213 | 63% | 75% | 82% |
Table 27b. College Enrollment Rates in the First Two Years after High School Graduation for Classes 2010 and 2011, Student-Weighted Totals
| N of students | Total | Public | Private | Two-year | Four-year | In-state | Out-of-state | |
| 2010 | 56,313 | 75% | 63% | 12% | 28% | 47% | 64% | 11% |
| 2011 | 61,256 | 73% | 62% | 11% | 30% | 43% | 62% | 11% |
Figure 27b. College Enrollment Rates in the First Two Years after High School Graduation for Classes 2010 and 2011, Student-Weighted Totals
Table 28a. Persistence Rates from First to Second Year of College for Class of 2011, School Percentile Distribution
| N of schools | 25th percentile | 50th percentile | 75th percentile | |
| 2011 | 213 | 75% | 83% | 88% |
Table 28b. Persistence Rates from First to Second Year of College for Class of 2011, Student-Weighted Totals
| Students enrolled in first year | Total | Public | Private | Two-year | Four-year | In-state | Out-of-state | |
| 2011 | 41,514 | 83% | 82% | 90% | 72% | 91% | 82% | 91% |
Figure 28b. Persistence Rates from First to Second Year of College for Class of 2011, Student-Weighted Totals
Outcomes for Higher Income, Low Minority, Urban High Schools
Table 29a. College Enrollment Rates in the First Fall after High School Graduation for Classes 2012 and 2013, School Percentile Distribution
| N of schools | 25th percentile | 50th percentile | 75th percentile | |
| 2012 | 312 | 63% | 71% | 80% |
| 2013 | 242 | 60% | 69% | 78% |
Table 29b. College Enrollment Rates in the First Fall after High School Graduation for Classes 2012 and 2013, Student-Weighted Totals
| N of students | Total | Public | Private | Two-year | Four-year | In-state | Out-of-state | |
| 2012 | 117,076 | 72% | 59% | 13% | 23% | 49% | 57% | 15% |
| 2013 | 90,545 | 70% | 58% | 12% | 22% | 48% | 55% | 14% |
Figure 29b. College Enrollment Rates in the First Fall after High School Graduation for Classes 2012 and 2013, Student-Weighted Totals
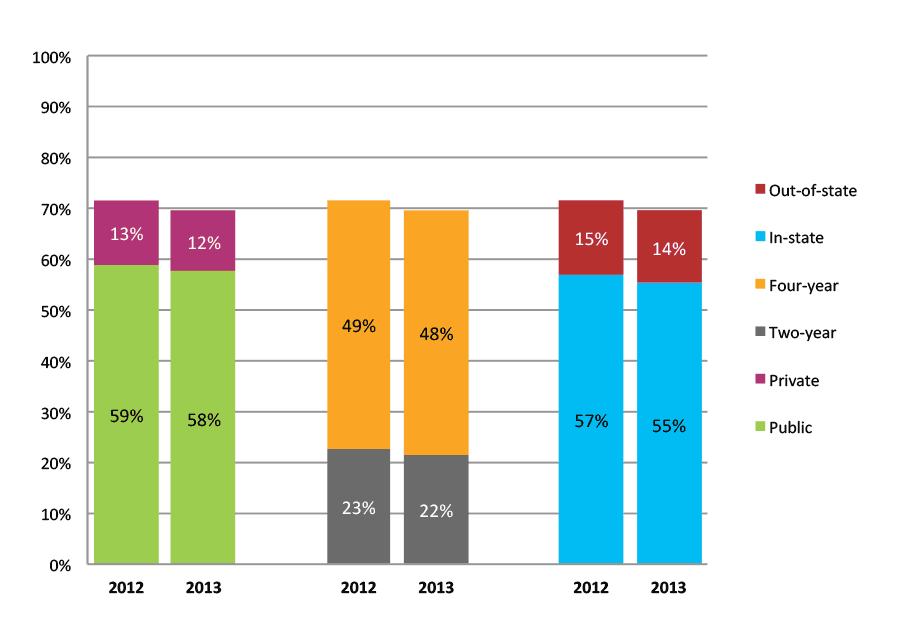
Table 30a. College Enrollment Rates in the First Year after High School Graduation for Classes 2011 and 2012, School Percentile Distribution
| N of schools | 25th percentile | 50th percentile | 75th percentile | |
| 2011 | 342 | 65% | 74% | 83% |
| 2012 | 312 | 67% | 75% | 83% |
Table 30b. College Enrollment Rates in the First Year after High School Graduation for Classes 2011 and 2012, Student-Weighted Totals
| N of students | Total | Public | Private | Two-year | Four-year | In-state | Out-of-state | |
| 2011 | 125,243 | 74% | 61% | 13% | 24% | 50% | 60% | 15% |
| 2012 | 117,076 | 76% | 62% | 13% | 25% | 50% | 61% | 15% |
Figure 30b. College Enrollment Rates in the First Year after High School Graduation for Classes 2011 and 2012, Student-Weighted Totals
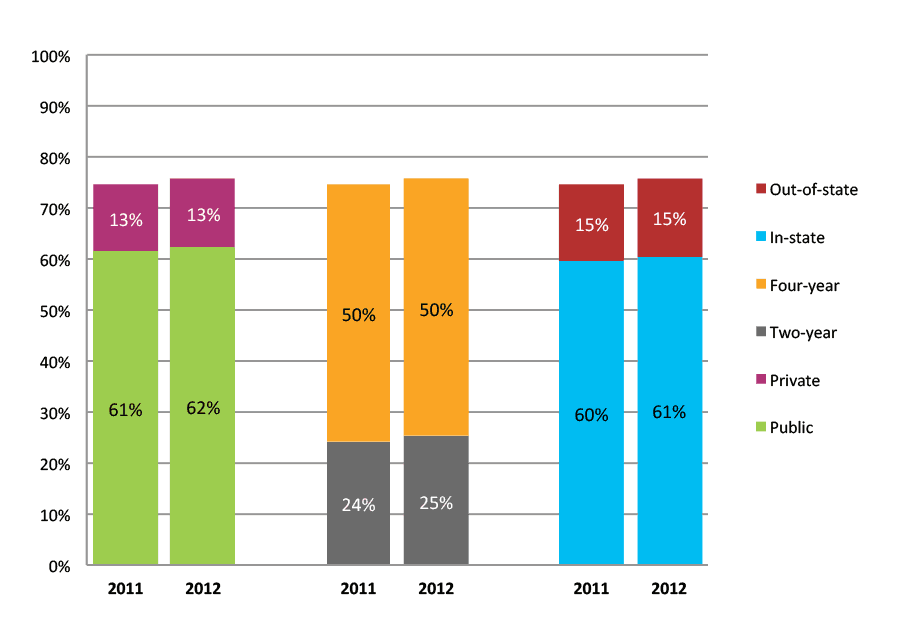
Table 31a. College Enrollment Rates in the First Two Years after High School Graduation for Classes 2010 and 2011, School Percentile Distribution
| N of schools | 25th percentile | 50th percentile | 75th percentile | |
| 2010 | 318 | 71% | 78% | 86% |
| 2011 | 342 | 71% | 79% | 87% |
Table 31b. College Enrollment Rates in the First Two Years after High School Graduation for Classes 2010 and 2011, Student-Weighted Totals
| N of students | Total | Public | Private | Two-year | Four-year | In-state | Out-of-state | |
| 2010 | 117,409 | 78% | 64% | 14% | 28% | 50% | 63% | 15% |
| 2011 | 125,243 | 79% | 65% | 14% | 27% | 52% | 63% | 16% |
Figure 31b. College Enrollment Rates in the First Two Years after High School Graduation for Classes 2010 and 2011, Student-Weighted Totals
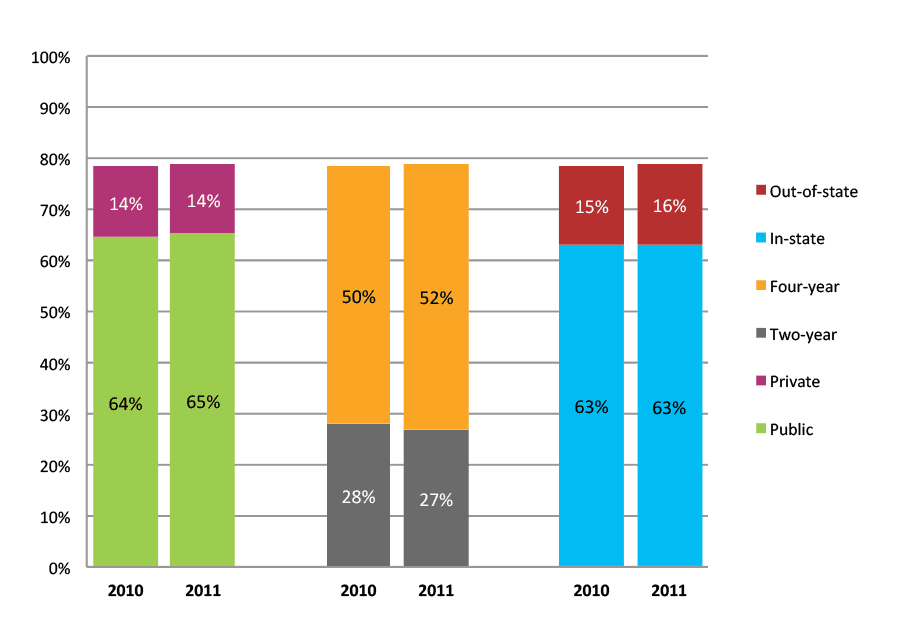
Table 32a. Persistence Rates from First to Second Year of College for Class of 2011, School Percentile Distribution
| N of schools | 25th percentile | 50th percentile | 75th percentile | |
| 2011 | 342 | 83% | 88% | 92% |
Table 32b. Persistence Rates from First to Second Year of College for Class of 2011, Student-Weighted Totals
| Students enrolled in first year | Total | Public | Private | Two-year | Four-year | In-state | Out-of-state | |
| 2011 | 93,203 | 89% | 88% | 94% | 78% | 94% | 87% | 93% |
Figure 32b. Persistence Rates from First to Second Year of College for Class of 2011, Student-Weighted Totals

Outcomes for Higher Income, High Minority, Suburban High Schools
Table 33a. College Enrollment Rates in the First Fall after High School Graduation for Classes 2012 and 2013, School Percentile Distribution
| N of schools | 25th percentile | 50th percentile | 75th percentile | |
| 2012 | 163 | 55% | 63% | 70% |
| 2013 | 131 | 54% | 62% | 69% |
Table 33b. College Enrollment Rates in the First Fall after High School Graduation for Classes 2012 and 2013, Student-Weighted Totals
| N of students | Total | Public | Private | Two-year | Four-year | In-state | Out-of-state | |
| 2012 | 66,487 | 63% | 55% | 9% | 28% | 35% | 54% | 10% |
| 2013 | 53,085 | 63% | 54% | 9% | 29% | 34% | 53% | 10% |
Figure 33b. College Enrollment Rates in the First Fall after High School Graduation for Classes 2012 and 2013, Student-Weighted Totals

Table 34a. College Enrollment Rates in the First Year after High School Graduation for Classes 2011 and 2012, School Percentile Distribution
| N of schools | 25th percentile | 50th percentile | 75th percentile | |
| 2011 | 133 | 64% | 71% | 75% |
| 2012 | 163 | 62% | 69% | 75% |
Table 34b. College Enrollment Rates in the First Year after High School Graduation for Classes 2011 and 2012, Student-Weighted Totals
| N of students | Total | Public | Private | Two-year | Four-year | In-state | Out-of-state | |
| 2011 | 53,613 | 70% | 58% | 11% | 30% | 40% | 57% | 13% |
| 2012 | 66,487 | 69% | 60% | 9% | 33% | 36% | 59% | 10% |
Figure 34b. College Enrollment Rates in the First Year after High School Graduation for Classes 2011 and 2012, Student-Weighted Totals
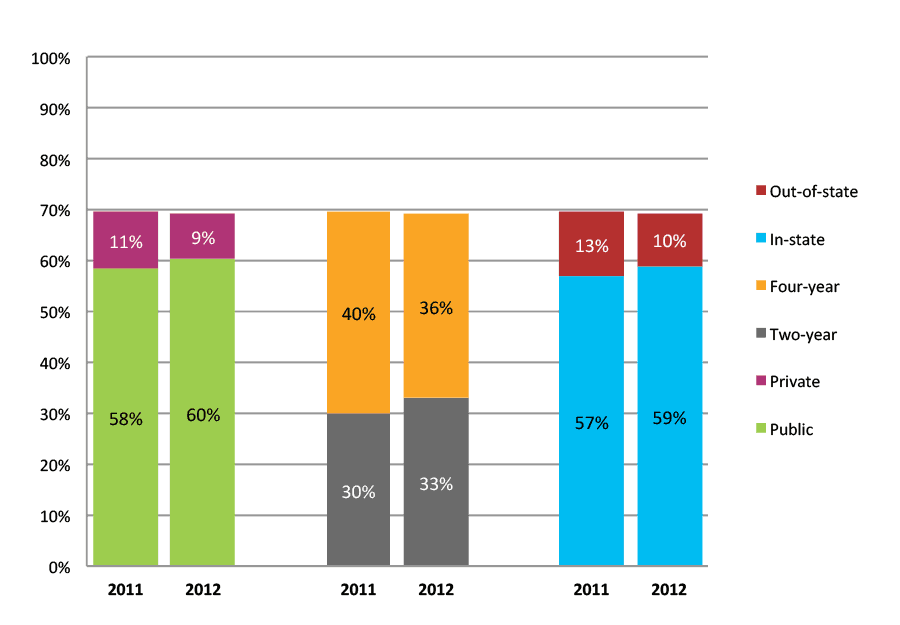
Table 35a. College Enrollment Rates in the First Two Years after High School Graduation for Classes 2010 and 2011, School Percentile Distribution
| N of schools | 25th percentile | 50th percentile | 75th percentile | |
| 2010 | 119 | 69% | 75% | 81% |
| 2011 | 133 | 69% | 75% | 80% |
Table 35b. College Enrollment Rates in the First Two Years after High School Graduation for Classes 2010 and 2011, Student-Weighted Totals
| N of students | Total | Public | Private | Two-year | Four-year | In-state | Out-of-state | |
| 2010 | 51,956 | 75% | 64% | 11% | 33% | 42% | 64% | 12% |
| 2011 | 53,613 | 74% | 63% | 12% | 34% | 41% | 61% | 14% |
Figure 35b. College Enrollment Rates in the First Two Years after High School Graduation for Classes 2010 and 2011, Student-Weighted Totals
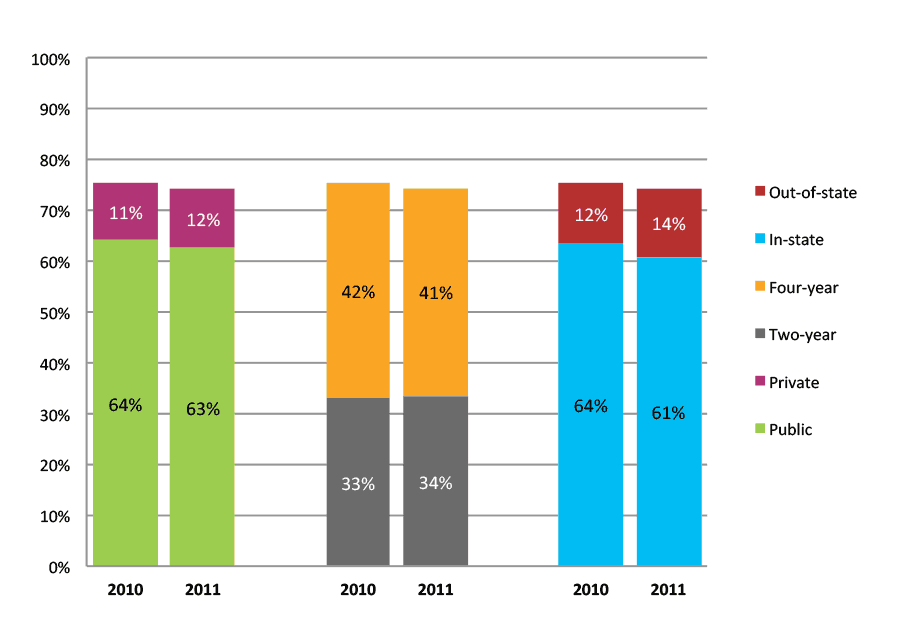
Table 36a. Persistence Rates from First to Second Year of College for Class of 2011, School Percentile Distribution
| N of schools | 25th percentile | 50th percentile | 75th percentile | |
| 2011 | 133 | 82% | 87% | 90% |
Table 36b. Persistence Rates from First to Second Year of College for Class of 2011, Student-Weighted Totals
| Students enrolled in first year | Total | Public | Private | Two-year | Four-year | In-state | Out-of-state | |
| 2011 | 37,267 | 86% | 85% | 92% | 77% | 94% | 85% | 91% |
Figure 36b. Persistence Rates from First to Second Year of College for Class of 2011, Student-Weighted Totals
Outcomes for Higher Income, Low Minority, Suburban High Schools
Table 37a. College Enrollment Rates in the First Fall after High School Graduation for Classes 2012 and 2013, School Percentile Distribution
| N of schools | 25th percentile | 50th percentile | 75th percentile | |
| 2012 | 510 | 65% | 74% | 82% |
| 2013 | 435 | 65% | 74% | 81% |
Table 37b. College Enrollment Rates in the First Fall after High School Graduation for Classes 2012 and 2013, Student-Weighted Totals
| N of students | Total | Public | Private | Two-year | Four-year | In-state | Out-of-state | |
| 2012 | 194,693 | 73% | 58% | 15% | 21% | 52% | 55% | 18% |
| 2013 | 165,182 | 73% | 58% | 15% | 21% | 51% | 56% | 17% |
Figure 37b. College Enrollment Rates in the First Fall after High School Graduation for Classes 2012 and 2013, Student-Weighted Totals
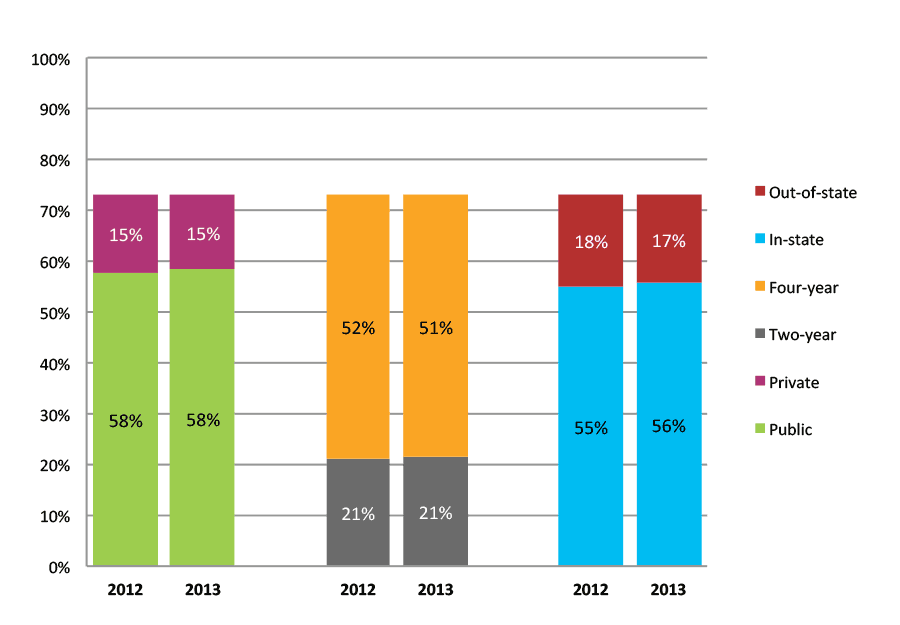
Table 38a. College Enrollment Rates in the First Year after High School Graduation for Classes 2011 and 2012, School Percentile Distribution
| N of schools | 25th percentile | 50th percentile | 75th percentile | |
| 2011 | 586 | 69% | 77% | 84% |
| 2012 | 510 | 70% | 78% | 84% |
Table 38b. College Enrollment Rates in the First Year after High School Graduation for Classes 2011 and 2012, Student-Weighted Totals
| N of students | Total | Public | Private | Two-year | Four-year | In-state | Out-of-state | |
| 2011 | 220,646 | 76% | 60% | 16% | 23% | 53% | 58% | 18% |
| 2012 | 194,693 | 77% | 61% | 16% | 23% | 54% | 58% | 19% |
Figure 38b. College Enrollment Rates in the First Year after High School Graduation for Classes 2011 and 2012, Student-Weighted Totals
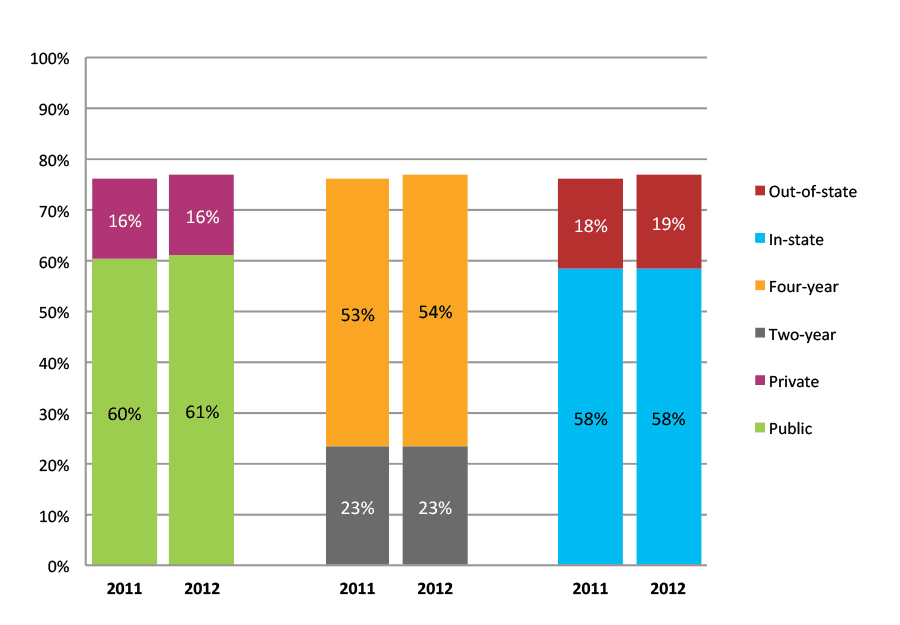
Table 39a. College Enrollment Rates in the First Two Years after High School Graduation for Classes 2010 and 2011, School Percentile Distribution
| N of schools | 25th percentile | 50th percentile | 75th percentile | |
| 2010 | 557 | 75% | 82% | 88% |
| 2011 | 586 | 74% | 81% | 88% |
Table 39b. College Enrollment Rates in the First Two Years after High School Graduation for Classes 2010 and 2011, Student-Weighted Totals
| N of students | Total | Public | Private | Two-year | Four-year | In-state | Out-of-state | |
| 2010 | 212,659 | 81% | 63% | 17% | 27% | 54% | 63% | 17% |
| 2011 | 220,646 | 80% | 64% | 16% | 26% | 55% | 62% | 19% |
Figure 39b. College Enrollment Rates in the First Two Years after High School Graduation for Classes 2010 and 2011, Student-Weighted Totals
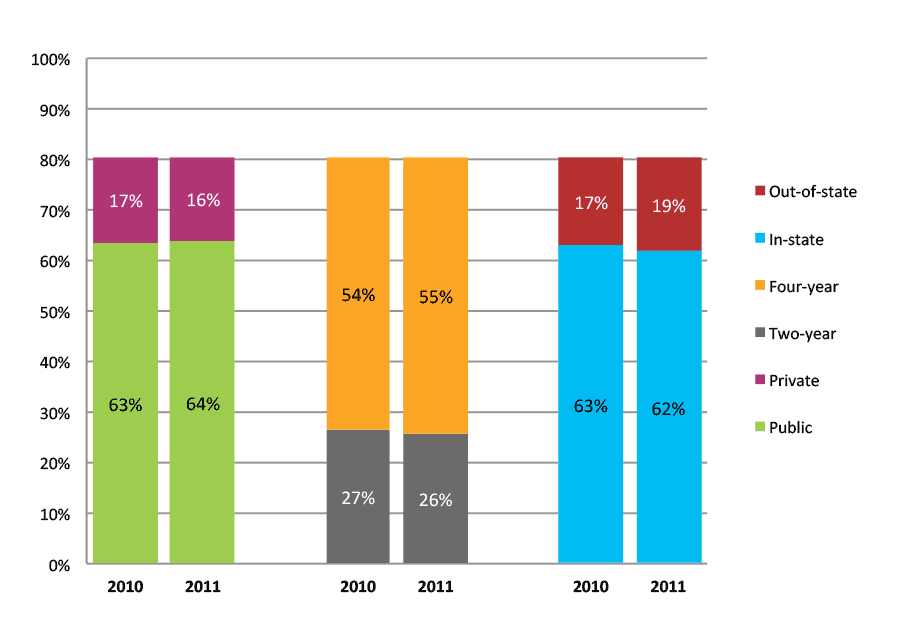
Table 40a. Persistence Rates from First to Second Year of College for Class of 2011, School Percentile Distribution
| N of schools | 25th percentile | 50th percentile | 75th percentile | |
| 2011 | 586 | 84% | 89% | 93% |
Table 40b. Persistence Rates from First to Second Year of College for Class of 2011, Student-Weighted Totals
| Students enrolled in first year | Total | Public | Private | Two-year | Four-year | In-state | Out-of-state | |
| 2011 | 167,724 | 89% | 88% | 94% | 78% | 94% | 87% | 95% |
Figure 40b. Persistence Rates from First to Second Year of College for Class of 2011, Student-Weighted Totals
Outcomes for Higher Income, High Minority, Rural High Schools
Table 41a. College Enrollment Rates in the First Fall after High School Graduation for Classes 2012 and 2013, School Percentile Distribution
| N of schools | 25th percentile | 50th percentile | 75th percentile | |
| 2012 | 59 | 52% | 60% | 71% |
| 2013 | 48 | 51% | 61% | 71% |
Table 41b. College Enrollment Rates in the First Fall after High School Graduation for Classes 2012 and 2013, Student-Weighted Totals
| N of students | Total | Public | Private | Two-year | Four-year | In-state | Out-of-state | |
| 2012 | 19,014 | 60% | 53% | 7% | 27% | 33% | 53% | 7% |
| 2013 | 13,821 | 62% | 55% | 6% | 30% | 31% | 55% | 7% |
Figure 41b. College Enrollment Rates in the First Fall after High School Graduation for Classes 2012 and 2013, Student-Weighted Totals
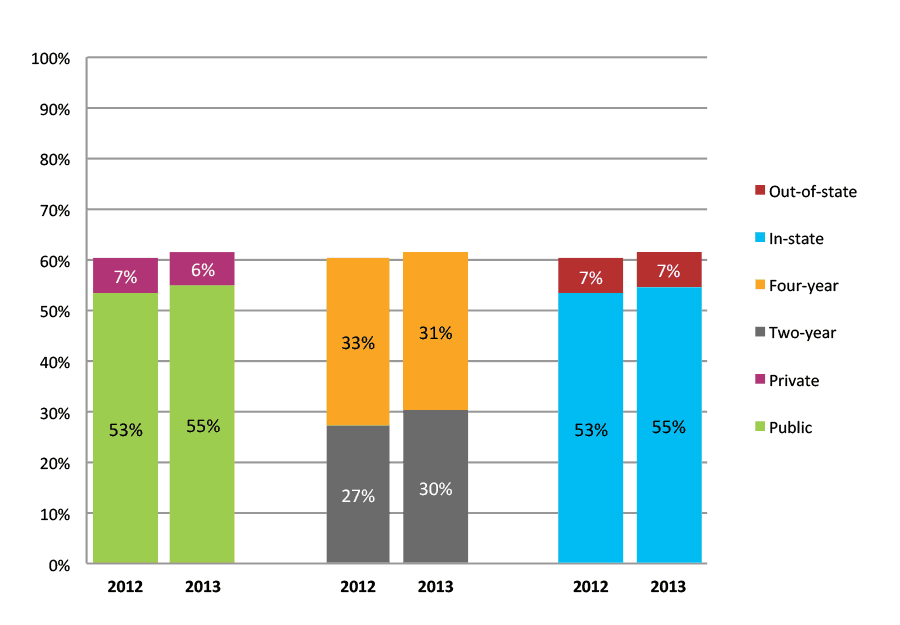
Table 42a. College Enrollment Rates in the First Year after High School Graduation for Classes 2011 and 2012, School Percentile Distribution
| N of schools | 25th percentile | 50th percentile | 75th percentile | |
| 2011 | 55 | 58% | 66% | 73% |
| 2012 | 59 | 60% | 67% | 75% |
Table 42b. College Enrollment Rates in the First Year after High School Graduation for Classes 2011 and 2012, Student-Weighted Totals
| N of students | Total | Public | Private | Two-year | Four-year | In-state | Out-of-state | |
| 2011 | 18,113 | 68% | 60% | 8% | 30% | 37% | 59% | 8% |
| 2012 | 19,014 | 66% | 59% | 7% | 32% | 34% | 59% | 8% |
Figure 42b. College Enrollment Rates in the First Year after High School Graduation for Classes 2011 and 2012, Student-Weighted Totals
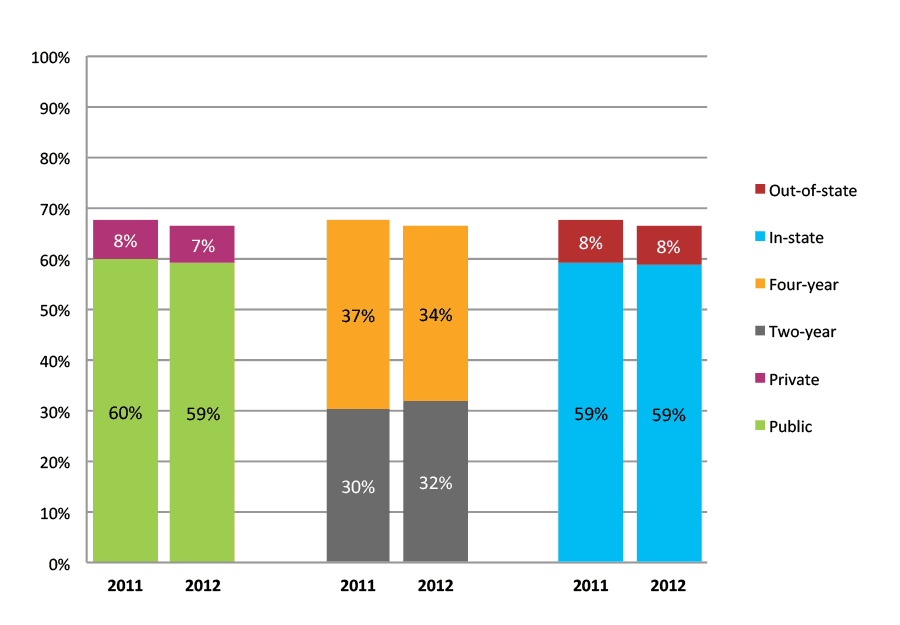
Table 43a. College Enrollment Rates in the First Two Years after High School Graduation for Classes 2010 and 2011, School Percentile Distribution
| N of schools | 25th percentile | 50th percentile | 75th percentile | |
| 2010 | 39 | 65% | 72% | 79% |
| 2011 | 55 | 65% | 72% | 78% |
Table 43b. College Enrollment Rates in the First Two Years after High School Graduation for Classes 2010 and 2011, Student-Weighted Totals
| N of students | Total | Public | Private | Two-year | Four-year | In-state | Out-of-state | |
| 2010 | 12,037 | 73% | 63% | 10% | 34% | 38% | 64% | 9% |
| 2011 | 18,113 | 73% | 64% | 9% | 34% | 39% | 64% | 9% |
Figure 43b. College Enrollment Rates in the First Two Years after High School Graduation for Classes 2010 and 2011, Student-Weighted Totals
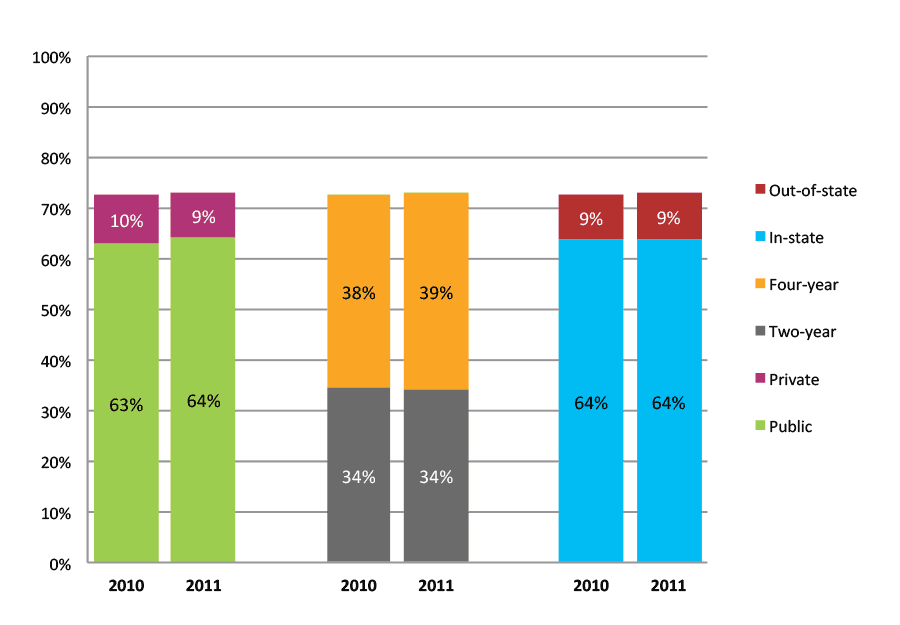
Table 44a. Persistence Rates from First to Second Year of College for Class of 2011, School Percentile Distribution
| N of schools | 25th percentile | 50th percentile | 75th percentile | |
| 2011 | 55 | 81% | 85% | 88% |
Table 44b. Persistence Rates from First to Second Year of College for Class of 2011, Student-Weighted Totals
| Students enrolled in first year | Total | Public | Private | Two-year | Four-year | In-state | Out-of-state | |
| 2011 | 12,270 | 85% | 84% | 89% | 75% | 92% | 84% | 89% |
Figure 44b. Persistence Rates from First to Second Year of College for Class of 2011, Student-Weighted Totals
Outcomes for Higher Income, Low Minority, Rural High Schools
Table 45a. College Enrollment Rates in the First Fall after High School Graduation for Classes 2012 and 2013, School Percentile Distribution
| N of schools | 25th percentile | 50th percentile | 75th percentile | |
| 2012 | 759 | 53% | 63% | 72% |
| 2013 | 540 | 52% | 62% | 71% |
Table 45b. College Enrollment Rates in the First Fall after High School Graduation for Classes 2012 and 2013, Student-Weighted Totals
| N of students | Total | Public | Private | Two-year | Four-year | In-state | Out-of-state | |
| 2012 | 129,815 | 65% | 54% | 12% | 21% | 45% | 53% | 12% |
| 2013 | 104,523 | 65% | 53% | 12% | 20% | 45% | 53% | 12% |
Figure 45b. College Enrollment Rates in the First Fall after High School Graduation for Classes 2012 and 2013, Student-Weighted Totals
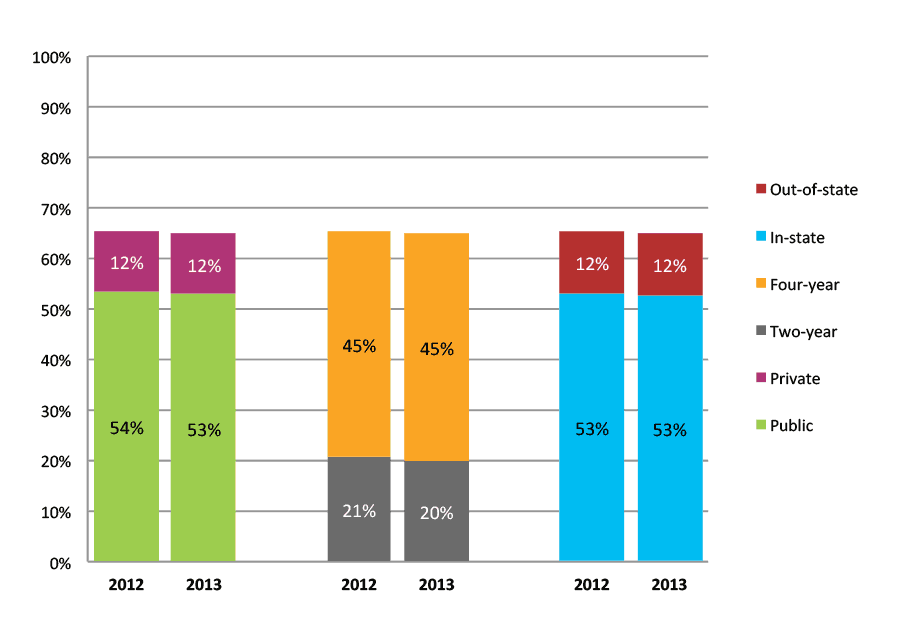
Table 46a. College Enrollment Rates in the First Year after High School Graduation for Classes 2011 and 2012, School Percentile Distribution
| N of schools | 25th percentile | 50th percentile | 75th percentile | |
| 2011 | 757 | 57% | 67% | 75% |
| 2012 | 759 | 58% | 67% | 76% |
Table 46b. College Enrollment Rates in the First Year after High School Graduation for Classes 2011 and 2012, Student-Weighted Totals
| N of students | Total | Public | Private | Two-year | Four-year | In-state | Out-of-state | |
| 2011 | 145,159 | 69% | 57% | 12% | 23% | 46% | 56% | 12% |
| 2012 | 129,815 | 69% | 57% | 12% | 23% | 46% | 56% | 13% |
Figure 46b. College Enrollment Rates in the First Year after High School Graduation for Classes 2011 and 2012, Student-Weighted Totals
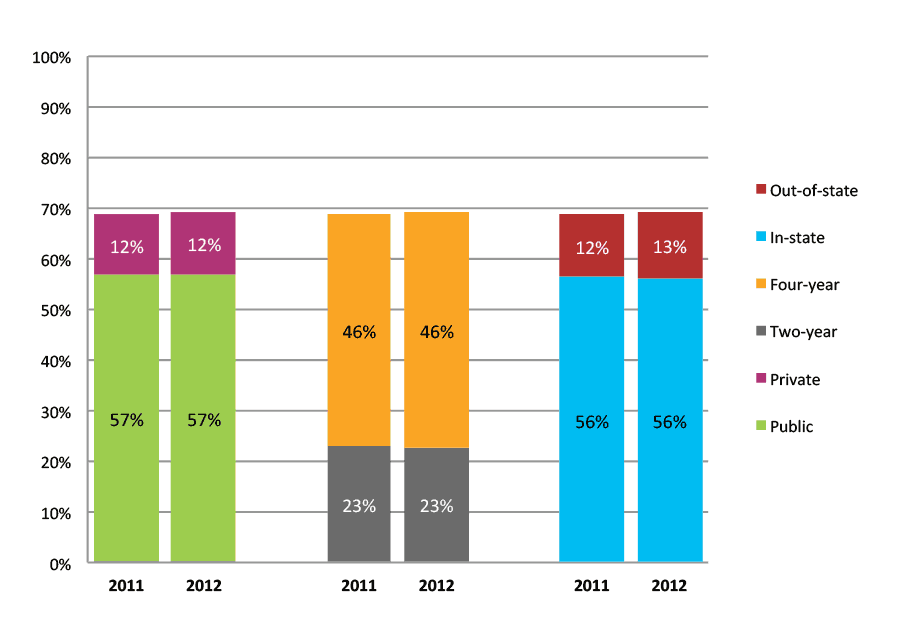
Table 47a. College Enrollment Rates in the First Two Years after High School Graduation for Classes 2010 and 2011, School Percentile Distribution
| N of schools | 25th percentile | 50th percentile | 75th percentile | |
| 2010 | 611 | 66% | 73% | 81% |
| 2011 | 757 | 62% | 71% | 79% |
Table 47b. College Enrollment Rates in the First Two Years after High School Graduation for Classes 2010 and 2011, Student-Weighted Totals
| N of students | Total | Public | Private | Two-year | Four-year | In-state | Out-of-state | |
| 2010 | 122,274 | 75% | 61% | 14% | 29% | 46% | 62% | 13% |
| 2011 | 145,159 | 73% | 61% | 12% | 26% | 47% | 60% | 13% |
Figure 47b. College Enrollment Rates in the First Two Years after High School Graduation for Classes 2010 and 2011, Student-Weighted Totals
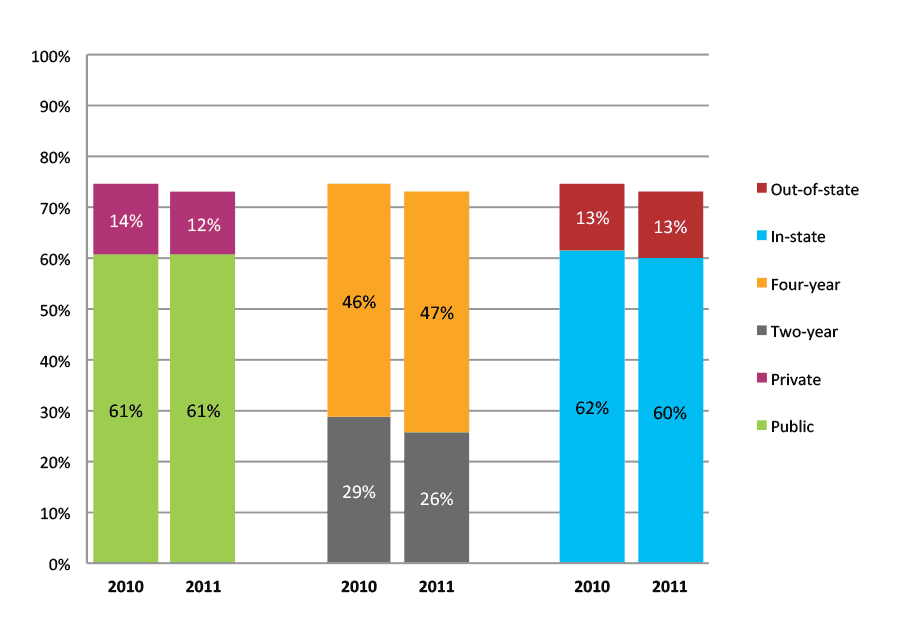
Table 48a. Persistence Rates from First to Second Year of College for Class of 2011, School Percentile Distribution
| N of schools | 25th percentile | 50th percentile | 75th percentile | |
| 2011 | 757 | 79% | 84% | 88% |
Table 48b. Persistence Rates from First to Second Year of College for Class of 2011, Student-Weighted Totals
| Students enrolled in first year | Total | Public | Private | Two-year | Four-year | In-state | Out-of-state | |
| 2011 | 99,671 | 85% | 84% | 91% | 73% | 91% | 84% | 91% |
Figure 48b. Persistence Rates from First to Second Year of College for Class of 2011, Student-Weighted Totals
Results for Public Charter High Schools
Outcomes for All Charter Schools
Table 1a. College Enrollment Rates in the First Fall after High School Graduation for Classes 2012 and 2013, School Percentile Distribution
| N of schools | 25th percentile | 50th percentile | 75th percentile | |
| 2012 | 324 | 41% | 60% | 76% |
| 2013 | 222 | 38% | 62% | 79% |
Table 1b.College Enrollment Rates in the First Fall after High School Graduation for Classes 2012 and 2013, Student-Weighted Totals
| N of students | Total | Public | Private | Two-year | Four-year | In-state | Out-of-state | |
| 2012 | 26,343 | 55% | 43% | 11% | 19% | 36% | 45% | 10% |
| 2013 | 16,290 | 60% | 49% | 12% | 20% | 40% | 49% | 11% |
Figure 1b. College Enrollment Rates in the First Fall after High School Graduation for Classes 2012 and 2013, Student-Weighted Totals
Table 2a. College Enrollment Rates in the First Year after High School Graduation for Classes 2011 and 2012, School Percentile Distribution
| N of schools | 25th percentile | 50th percentile | 75th percentile | |
| 2011 | 303 | 50% | 67% | 84% |
| 2012 | 324 | 50% | 67% | 81% |
Table 2b. College Enrollment Rates in the First Year after High School Graduation for Classes 2011 and 2012, Student-Weighted Totals
| N of students | Total | Public | Private | Two-year | Four-year | In-state | Out-of-state | |
| 2011 | 23,386 | 63% | 52% | 12% | 24% | 40% | 53% | 11% |
| 2012 | 26,343 | 61% | 49% | 12% | 23% | 38% | 50% | 11% |
Figure 2b. College Enrollment Rates in the First Year after High School Graduation for Classes 2011 and 2012, Student-Weighted Totals
Table 3a. College Enrollment Rates in the First Two Years after High School Graduation for Classes 2010 and 2011, School Percentile Distribution
| N of schools | 25th percentile | 50th percentile | 75th percentile | |
| 2010 | 149 | 60% | 76% | 84% |
| 2011 | 303 | 56% | 75% | 87% |
Table 3b. College Enrollment Rates in the First Two Years after High School Graduation for Classes 2010 and 2011, Student-Weighted Totals
| N of students | Total | Public | Private | Two-year | Four-year | In-state | Out-of-state | |
| 2010 | 12,645 | 72% | 58% | 14% | 27% | 45% | 59% | 13% |
| 2011 | 23,386 | 69% | 56% | 13% | 28% | 41% | 57% | 12% |
Figure 3b. College Enrollment Rates in the First Two Years after High School Graduation for Classes 2010 and 2011, Student-Weighted Totals
Table 4a. Persistence Rates from First to Second Year of College for Class of 2011, School Percentile Distribution
| N of schools | 25th percentile | 50th percentile | 75th percentile | |
| 2011 | 303 | 72% | 81% | 89% |
Table 4b. Persistence Rates from First to Second Year of College for Class of 2011, Student-Weighted Totals
| Students enrolled in first year | Total | Public | Private | Two-year | Four-year | In-state | Out-of-state | |
| 2011 | 14,773 | 82% | 81% | 85% | 72% | 88% | 81% | 87% |
Figure 4b. Persistence Rates from First to Second Year of College for Class of 2011, Student-Weighted Totals
Results for Private High Schools
Outcomes for All Private Schools
Table 1a. College Enrollment Rates in the First Fall after High School Graduation for Classes 2012 and 2013, School Percentile Distribution
| N of schools | 25th percentile | 50th percentile | 75th percentile | |
| 2012 | 293 | 74% | 85% | 91% |
| 2013 | 197 | 78% | 87% | 91% |
Table 1b. College Enrollment Rates in the First Fall after High School Graduation for Classes 2012 and 2013, Student-Weighted Totals
| N of students | Total | Public | Private | Two-year | Four-year | In-state | Out-of-state | |
| 2012 | 37,005 | 85% | 47% | 37% | 9% | 75% | 50% | 35% |
| 2013 | 25,051 | 86% | 49% | 37% | 9% | 77% | 52% | 34% |
Figure 1b. College Enrollment Rates in the First Fall after High School Graduation for Classes 2012 and 2013, Student-Weighted Totals

Table 2a. College Enrollment Rates in the First Year after High School Graduation for Classes 2011 and 2012, School Percentile Distribution
| N of schools | 25th percentile | 50th percentile | 75th percentile | |
| 2011 | 326 | 80% | 88% | 92% |
| 2012 | 293 | 78% | 87% | 93% |
Table 2b. College Enrollment Rates in the First Year after High School Graduation for Classes 2011 and 2012, Student-Weighted Totals
| N of students | Total | Public | Private | Two-year | Four-year | In-state | Out-of-state | |
| 2011 | 42,268 | 87% | 48% | 38% | 9% | 77% | 50% | 37% |
| 2012 | 37,005 | 87% | 49% | 38% | 9% | 77% | 51% | 36% |
Figure 2b. College Enrollment Rates in the First Year after High School Graduation for Classes 2011 and 2012, Student-Weighted Totals
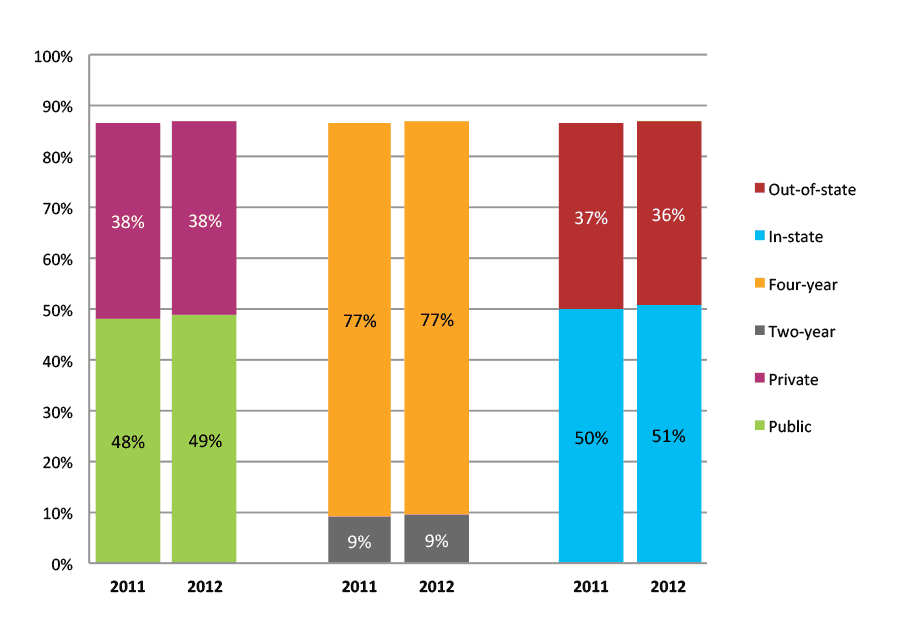
Table 3a. College Enrollment Rates in the First Two Years after High School Graduation for Classes 2010 and 2011, School Percentile Distribution
| N of schools | 25th percentile | 50th percentile | 75th percentile | |
| 2011 | 326 | 86% | 91% | 95% |
Table 3b. College Enrollment Rates in the First Two Years after High School Graduation for Classes 2010 and 2011, Student-Weighted Totals
| N of students | Total | Public | Private | Two-year | Four-year | In-state | Out-of-state | |
| 2011 | 42,268 | 90% | 50% | 40% | 10% | 80% | 51% | 39% |
Figure 3b. College Enrollment Rates in the First Two Years after High School Graduation for Classes 2010 and 2011, Student-Weighted Totals
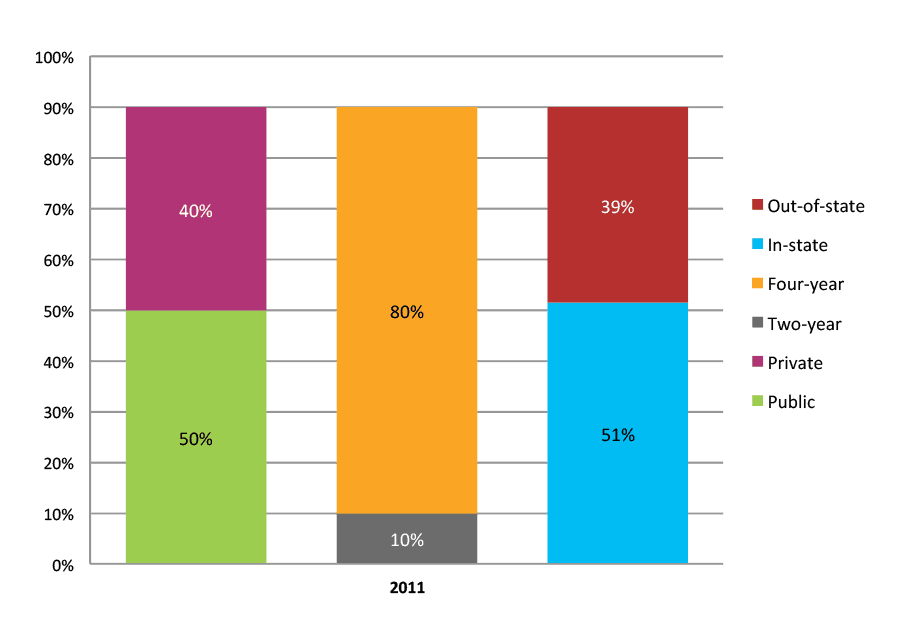
Table 4a. Persistence Rates from First to Second Year of College for Class of 2011, School Percentile Distribution
| N of schools | 25th percentile | 50th percentile | 75th percentile | |
| 2011 | 326 | 92% | 95% | 97% |
Table 4b. Persistence Rates from First to Second Year of College for Class of 2011, Student-Weighted Totals
| Students enrolled in first year | Total | Public | Private | Two-year | Four-year | In-state | Out-of-state | |
| 2011 | 36,638 | 95% | 93% | 97% | 82% | 96% | 94% | 96% |
Figure 4b. Persistence Rates from First to Second Year of College for Class of 2011, Student-Weighted Totals
References
Aud, S., Wilkinson-Flicker, S., Kristapovich, P., Rathbun, A., Wang, X., & Zhang, J. (2013). The Condition of Education 2013 (NCES 2013-037). U.S. Department of Education, National Center for Education Statistics. Washington, DC. Retrieved from http://nces.ed.gov/pubsearch.
Bell, A. D., Rowan-Kenyon, H.T., & Perna, L.W. (2009). College knowledge of 9th and 11th grade students: Variation by school and state context. The Journal of Higher Education 80(6), 663-685.
Black, S.E., Lincove J.A., Cullinane, J., & Veron R. (2014). Can you leave high school behind? Retrieved from National Bureau of Economic Research website http://www.nber.org/papers/w19842
Hill, L. D. (2008). School strategies and the “college‐linking” process: Reconsidering the effects of high schools on college enrollment. Sociology of Education 81(1), 53-76.
Hossler, D, Schmit, J. & Vesper, N. (1999). Going to college: How social, economic, and educational factors influence the decisions students make. Baltimore, MD: The Johns Hopkins University Press.
Hurwitz, M., Smith, J.I., Howell, J., & Pender, M. (2012). The role of high schools in students’ postsecondary choices. (Advocacy & Policy Center Research Brief). New York, NY: The College Board.
McDonough, P M. (1997). Choosing colleges: How social class and schools structure opportunity. Albany, NY: State University of New York Press.
Prescott, B. T., & Bransberger, P. (2012). Knocking at the college door: Projections of high school graduates (8th ed.). Boulder, CO: Western Interstate Commission for Higher Education.
Roderick, M., Coca, V., & Nagaoka, J. (2011). Potholes on the road to college: High school effects in shaping urban students’ participation in college application, four-year college enrollment, and college match. Sociology of Education 84(3), 178-211.
Wolniak, G. C., & Engberg, M. E. (2010). Academic achievement in the first year of college: Evidence of pervasive effects of high school context. Research in Higher Education, 51, 451-467.
Appendix A: Methodological Notes
This report contains college enrollment and persistence outcomes for high school graduating classes 2010 through 2013. The results presented in the report center on the following outcomes:
- College enrollment in the
- first fall after high school graduation;
- first year after high school graduation; and
- first two years after high school graduation.
- Persistence from the first to the second year of college.
The outcomes are presented by type of college attended, including public and private institutions, two-year and four-year institutions, and in-state and out-of-state institutions. These characteristics are defined by IPEDS Institutional Characteristics data as of 2011. In-state designations are defined relative to the state in which the high school is located, not the residency of individual students.
The high school dataset used for this report is based on a voluntary sample and is not a nationally representative sample of schools or of high school graduates. High school diploma data are submitted to the National Student Clearinghouse (the Clearinghouse) by schools and districts that participate in the StudentTracker for High Schools (STHS) service. High schools participating in this service pay a small fee (typically $425) to receive a packet of reports with postsecondary access and success outcomes for their graduating classes. In general, the participating schools tend to have greater representation among schools with lower income, higher minority enrollments and urban locales.
This report is based on the data submitted to the Clearinghouse on graduating classes 2010 through 2013. Table A1 below shows the number of participating high schools and high school graduates included in this report compared to the total number of U.S. high schools and high school graduates. All types of high schools, including public non-charter, public charter, and private schools, participate in the Clearinghouse STHS service.
Table A1. Number of Public Non-Charter High Schools and Public Non-Charter High School Graduates Included in the Report
| Academic Year1 | Number of Participating High Schools | Percent of All U.S. Public High Schools2 | Percent of U.S. Grade 12 Enrollment Represented3 | Total N (Number of graduates in participating high schools) |
| 2009-2010 | 2,936 | 17.6% | 29.0% | 838,292 |
| 2010-2011 | 3,659 | 22.0% | 33.4% | 953,450 |
| 2011-2012 | 3,498 | 21.0% | 31.1% | 885,924 |
| 2012-2013 | 2,753 | 16.5% | 25.4% | 702,945 |
1 Academic year is defined as the period between September 1-August 31.
2 The total number of schools used in the denominator of this calculation was obtained from NCES’ Elementary and Secondary Information System (ELSi). The public school information is available from the Common Core of Data only through 2011-12. The number of public non-charter schools for 2012-13 is an estimate, equal to the number from 2011-12.
3 The numbers used in both the denominator and numerator of this calculation were obtained from NCES’ Elementary and Secondary Information System (ELSi). Grade 12 enrollment information is available from the Common Core of Data through 2011-12. The numbers for 2012-13 are estimates, equal to the numbers from 2011-12.
Table A2. Number of Public Charter High Schools and Public Charter High School Graduates Included in the Report
| Academic Year1 | Number of Participating High Schools | Percent of All U.S. Public High Schools2 | Percent of U.S. Grade 12 Enrollment Represented3 | Total N (Number of graduates in participating high schools) |
| 2010-2011 | 303 | 19.9% | 26.6% | 23,386 |
| 2011-2012 | 324 | 19.3% | 24.6% | 26,343 |
| 2012-2013 | 222 | 13.2% | 16.4% | 16,290 |
1 Academic year is defined as the period between September 1-August 31.
2 The total number of schools used in the denominator of this calculation was obtained from NCES’ Elementary and Secondary Information System (ELSi). The public school information is available from the Common Core of Data only through 2011-12. The number of public non-charter schools for 2012-13 is an estimate, equal to the number from 2011-12
3 The numbers used in both the denominator and numerator of this calculation were obtained from NCES’ Elementary and Secondary Information System (ELSi). Grade 12 enrollment information is available from the Common Core of Data through 2011-12. The numbers for 2012-13 are estimates, equal to the numbers from 2011-12.
Table A3. Number of Private High Schools and Private High School Graduates Included in the Report
| Academic Year1 | Number of Participating High Schools | Percent of All U.S. Private High Schools2 | Percent of U.S. Grade 12 Enrollment Represented3 | Total N (Number of graduates in participating high schools) |
| 2010-2011 | 326 | 5.3% | 15.8% | 42,268 |
| 2011-2012 | 293 | 5.0% | 14.9% | 37,005 |
| 2012-2013 | 197 | 3.3% | 10.4% | 25,051 |
1 Academic year is defined as the period between September 1-August 31.
2 The total number of schools used in the denominator of this calculation was obtained from NCES’ Elementary and Secondary Information System (ELSi). The public school information is available from the Common Core of Data only through 2011-12. The number of public non-charter schools for 2012-13 is an estimate, equal to the number from 2011-12
3 The numbers used in both the denominator and numerator of this calculation were obtained from NCES’ Elementary and Secondary Information System (ELSi). Grade 12 enrollment information is available from the Common Core of Data through 2011-12. The numbers for 2012-13 are estimates, equal to the numbers from 2011-12.
Definitions of Public Non-Charter High School Categories
We used the Common Core of Data (CCD) to construct the sampling frame of schools. The CCD is the Department of Education’s primary database on public elementary and secondary education in the United States. From the CCD, we created a sample frame that contains all regular public schools with a 12th grade.
In order to enable public non-charter high schools to compare their own outcomes with those of similar high schools, the outcomes in this report are presented on the basis of school-level characteristics: low income and higher income, high minority and low minority, urban and rural. Membership in these categories for each academic year is based on CCD data for the corresponding year with one exception: for the academic year of 2012-2013, the categories are based on the information from the same source for 2011-2012.
Low income schools are defined as schools where at least 50 percent of the entire student population (not just graduating seniors) is eligible for free or reduced price lunch. Minority schools are defined as those schools where at least 40 percent of the students are black or Hispanic. Locale is defined by the NCES urban-centric locale code. Schools with a code from 11 to 13 are defined as urban. Schools with a code from 21 to 23 are defined as suburban. And those with a code 31 to 43, covering both town and rural areas, are defined as rural.
Combinations of these characteristics result in 12 groups of high schools. Thus, the outcomes are presented for the following categories of high schools:
- Low income, high minority, urban
- Low income, low minority, urban
- Low income, high minority, suburban
- Low income, low minority, suburban
- Low income, high minority, rural
- Low income, low minority, rural
- Higher income, high minority, urban
- Higher income, low minority, urban
- Higher income, high minority, suburban
- Higher income, low minority, suburban
- Higher income, high minority, rural
- Higher income, low minority, rural
Table A4. Number of Public Non-Charter High Schools and Public Non-Charter High School Graduates Included in the Report by High School Category
| Group | Academic Year | Number of Participating High Schools | Percent of U.S. Grade 12 Enrollment Represented | Number of States Represented | Total N (Number of graduates in sample) |
| Low Income High Minority Urban | 2009-10 | 570 | 49.6% | 32 | 132,196 |
| 2010-11 | 774 | 52.6% | 36 | 159,362 | |
| 2011-12 | 666 | 50.9% | 34 | 131,395 | |
| 2012-13 | 521 | 40.1% | 32 | 99,679 | |
| Low Income High Minority Suburban | 2009-10 | 192 | 41.9% | 27 | 69,869 |
| 2010-11 | 229 | 45.3% | 29 | 86,182 | |
| 2011-12 | 196 | 43.8% | 29 | 69,814 | |
| 2012-13 | 161 | 37.2% | 28 | 45,454 | |
| Low Income Low Minority Urban | 2009-10 | 77 | 51.6% | 22 | 20,275 |
| 2010-11 | 87 | 51.2% | 25 | 24,828 | |
| 2011-12 | 89 | 50.3% | 24 | 23,383 | |
| 2012-13 | 68 | 39.5% | 21 | 20,254 | |
| Low Income Low Minority Suburban | 2009-10 | 41 | 30.2% | 17 | 9,281 |
| 2010-11 | 56 | 32.5% | 20 | 11,582 | |
| 2011-12 | 59 | 31.9% | 16 | 13,526 | |
| 2012-13 | 51 | 27.5% | 13 | 11,349 | |
| Low Income High Minority Rural | 2009-10 | 72 | 14.5% | 18 | 19,506 |
| 2010-11 | 88 | 15.8% | 21 | 22,837 | |
| 2011-12 | 82 | 13.6% | 23 | 18,822 | |
| 2012-13 | 68 | 11.7% | 21 | 15,563 | |
| Low Income Low Minority Rural | 2009-10 | 122 | 9.0% | 27 | 14,517 |
| 2010-11 | 339 | 14.0% | 36 | 24,629 | |
| 2011-12 | 369 | 14.3% | 29 | 26,874 | |
| 2012-13 | 314 | 12.6% | 28 | 23,757 | |
| Higher Income High Minority Urban | 2009-10 | 218 | 36.4% | 20 | 56,313 |
| 2010-11 | 213 | 52.4% | 23 | 61,256 | |
| 2011-12 | 234 | 43.8% | 24 | 75,025 | |
| 2012-13 | 174 | 35.0% | 19 | 59,733 | |
| Higher Income High Minority Suburban | 2009-10 | 119 | 36.8% | 19 | 51,956 |
| 2010-11 | 133 | 41.8% | 23 | 53,613 | |
| 2011-12 | 163 | 39.8% | 21 | 66,487 | |
| 2012-13 | 131 | 31.9% | 19 | 53,085 | |
| Higher Income Low Minority Urban | 2009-10 | 318 | 42.3% | 40 | 117,409 |
| 2010-11 | 342 | 48.7% | 41 | 125,243 | |
| 2011-12 | 312 | 47.8% | 42 | 117,076 | |
| 2012-13 | 242 | 37.7% | 39 | 90,545 | |
| Higher Income Low Minority Suburban | 2009-10 | 557 | 30.4% | 40 | 212,659 |
| 2010-11 | 586 | 32.9% | 42 | 220,646 | |
| 2011-12 | 510 | 30.1% | 43 | 194,693 | |
| 2012-13 | 435 | 25.7% | 40 | 165,182 | |
| Higher Income High Minority Rural | 2009-10 | 39 | 20.7% | 14 | 12,037 |
| 2010-11 | 55 | 27.3% | 18 | 18,113 | |
| 2011-12 | 59 | 23.0% | 17 | 19,014 | |
| 2012-13 | 48 | 17.8% | 14 | 13,821 | |
| Higher Income Low Minority Rural | 2009-10 | 611 | 15.7% | 46 | 122,274 |
| 2010-11 | 757 | 19.7% | 46 | 145,159 | |
| 2011-12 | 759 | 18.0% | 47 | 129,815 | |
| 2012-13 | 540 | 14.5% | 44 | 104,523 |
The numbers used in both the denominator and numerator of this calculation were obtained from NCES’ Elementary and Secondary Information System (ELSi). The denominator is the number of grade 12 enrollments for all schools in a particular category of high schools. The numerator is the number of grade 12 enrollments for participating public high schools in the category. Grade 12 enrollment information is available from the Common Core of Data only through 2011-12. The numbers for 2012-13 are estimates, equal to the numbers from 2011-12.
Postsecondary Enrollments Data
College enrollment and persistence outcomes are determined by matching the graduate files received from high schools each year to the postsecondary enrollment data held by the National Student Clearinghouse. The National Student Clearinghouse is a unique and trusted source for higher education enrollment and degree verification. Currently, Clearinghouse data include more than 3,600 postsecondary institutions and 96 percent of U.S. postsecondary enrollments (for detailed coverage of postsecondary enrollments see Appendix B). Because the database is comprised of student-level data, researchers can use it to link concurrent as well as consecutive enrollments of individual students at multiple institutions — a capability that distinguishes the Clearinghouse data from national databases built with institution-level data.
In order to preserve comparability to the reports that schools and districts receive on their graduates’ college access and persistence rates through the Clearinghouse’s StudentTracker service, results have not been adjusted to account for a student’s enrollment outcome not being captured due to noncoverage by Clearinghouse data.
Definitions of Outcomes
College enrollment in the first fall after high school graduation: Percentage of high school students who enrolled in a two- or four-year postsecondary institution in the fall semester immediately following graduation. The fall semester immediately following graduation is defined as any enrollment that occurs between August 15 and October 31.
College enrollment in the first year after high school graduation: Percentage of high school students who enrolled in a two- or four-year postsecondary institution in the academic year immediately following graduation. The first year after high school includes any enrollment that occurs between August 15 of the graduation year and August 14 of the following year.
College enrollment in the first two years after high school graduation: Percentage of high school students who enrolled in a two- or four-year postsecondary institution in the first two years following graduation. The first two years after high school includes any enrollment that occurs between August 15 of the graduation year and August 14 of the second year.
Persistence from first to second year of college: Percentage of students enrolled in the first year after high school graduation who remained enrolled in postsecondary education in the second year. This is the percentage of students who re-enrolled at any postsecondary institution, not necessarily the same one they started in. Thus, it is different from the typical measure of retention at the same institution.
Appendix B: Postsecondary Coverage Tables
National Student Clearinghouse Coverage of Postsecondary Enrollments by Institution Type (Title IV, Degree-Granting Institutions)
| Institution Type | Fall 2010 (%) | Fall 2011 (%) | Fall 2012 (%) | Fall 2013 (%) |
| National | 92.97 | 93.79 | 94.19 | 95.49 |
| Four-Year Public | 99.30 | 99.51 | 98.98 | 99.24 |
| Four-Year Private | 84.81 | 86.06 | 86.59 | 90.28 |
| Two-Year Public | 97.28 | 97.72 | 98.67 | 99.21 |
| Two-Year Private | 12.85 | 21.11 | 26.61 | 28.87 |
Appendix C: Tables for Section 1: National Results
Table 1. Rates of College Enrollment in the First Fall after High School Graduation for Class of 2013
| Low Income Schools | Higher Income Schools | All Charter Schools | All Private Schools | |||||||||||
| Urban Schools | Suburban Schools | Rural Schools | Urban Schools | Suburban Schools | Rural Schools | |||||||||
| High Minority Schools | Low Minority Schools | High Minority Schools | Low Minority Schools | High Minority Schools | Low Minority Schools | High Minority Schools | Low Minority Schools | High Minority Schools | Low Minority Schools | High Minority Schools | Low Minority Schools | |||
| Total N | 99,679 | 20,254 | 45,454 | 11,349 | 15,563 | 23,757 | 59,733 | 90,545 | 53,085 | 165,182 | 13,821 | 104,523 | 16,290 | 25,051 |
| Total | 51% | 58% | 50% | 47% | 52% | 47% | 61% | 70% | 63% | 73% | 62% | 65% | 60% | 86% |
| Public | 43% | 49% | 44% | 40% | 46% | 40% | 53% | 58% | 54% | 58% | 55% | 53% | 49% | 49% |
| Private | 8% | 8% | 7% | 7% | 6% | 8% | 8% | 12% | 9% | 15% | 6% | 12% | 12% | 37% |
| Two-year | 22% | 27% | 24% | 21% | 25% | 17% | 28% | 22% | 29% | 21% | 30% | 20% | 20% | 9% |
| Four-year | 29% | 31% | 27% | 26% | 27% | 30% | 33% | 48% | 34% | 51% | 31% | 45% | 40% | 77% |
| In-state | 44% | 52% | 44% | 41% | 47% | 42% | 53% | 55% | 53% | 56% | 55% | 53% | 49% | 52% |
| Out-of-state | 6% | 5% | 6% | 6% | 5% | 5% | 8% | 14% | 10% | 17% | 7% | 12% | 11% | 34% |
Data from this appendix table are displayed in the report in Figures A, B, and C.
Table 2. Rates of College Enrollment in the First Fall after High School Graduation for Class of 2012
| Low Income Schools | Higher Income Schools | All Charter Schools | All Private Schools | |||||||||||
| Urban Schools | Suburban Schools | Rural Schools | Urban Schools | Suburban Schools | Rural Schools | |||||||||
| High Minority Schools | Low Minority Schools | High Minority Schools | Low Minority Schools | High Minority Schools | Low Minority Schools | High Minority Schools | Low Minority Schools | High Minority Schools | Low Minority Schools | High Minority Schools | Low Minority Schools | |||
| Total N | 131,395 | 23,383 | 69,814 | 13,526 | 18,822 | 26,874 | 75,025 | 117,076 | 66,487 | 194,693 | 19,014 | 129,815 | 26,343 | 37,005 |
| Total | 52% | 57% | 54% | 49% | 53% | 48% | 62% | 72% | 63% | 73% | 60% | 65% | 55% | 85% |
| Public | 44% | 48% | 47% | 42% | 47% | 40% | 54% | 59% | 55% | 58% | 53% | 54% | 43% | 47% |
| Private | 8% | 8% | 7% | 7% | 6% | 8% | 8% | 13% | 9% | 15% | 7% | 12% | 11% | 37% |
| Two-year | 22% | 26% | 19% | 22% | 24% | 18% | 27% | 23% | 28% | 21% | 27% | 21% | 19% | 9% |
| Four-year | 30% | 30% | 34% | 27% | 29% | 31% | 35% | 49% | 35% | 52% | 33% | 45% | 36% | 75% |
| In-state | 45% | 51% | 48% | 43% | 47% | 43% | 54% | 57% | 54% | 55% | 53% | 53% | 45% | 50% |
| Out-of-state | 7% | 6% | 6% | 6% | 6% | 5% | 8% | 15% | 10% | 18% | 7% | 12% | 10% | 35% |
Data from this appendix table are displayed in the report in Figure D.
Table 3. Rates of College Enrollment in the First Year after High School Graduation for Class of 2012
| Low Income Schools | Higher Income Schools | All Charter Schools | All Private Schools | |||||||||||
| Urban Schools | Suburban Schools | Rural Schools | Urban Schools | Suburban Schools | Rural Schools | |||||||||
| High Minority Schools | Low Minority Schools | High Minority Schools | Low Minority Schools | High Minority Schools | Low Minority Schools | High Minority Schools | Low Minority Schools | High Minority Schools | Low Minority Schools | High Minority Schools | Low Minority Schools | |||
| Total N | 131,395 | 23,383 | 69,814 | 13,526 | 18,822 | 26,874 | 75,025 | 117,076 | 66,487 | 194,693 | 19,014 | 129,815 | 26,343 | 37,005 |
| Total | 58% | 62% | 60% | 54% | 59% | 52% | 68% | 76% | 69% | 77% | 66% | 69% | 61% | 87% |
| Public | 49% | 53% | 53% | 47% | 52% | 44% | 59% | 62% | 60% | 61% | 59% | 57% | 49% | 49% |
| Private | 9% | 9% | 7% | 8% | 7% | 8% | 9% | 13% | 9% | 16% | 7% | 12% | 12% | 38% |
| Two-year | 26% | 31% | 23% | 26% | 29% | 20% | 32% | 25% | 33% | 23% | 32% | 23% | 23% | 9% |
| Four-year | 32% | 32% | 37% | 28% | 30% | 32% | 36% | 50% | 36% | 54% | 34% | 46% | 38% | 77% |
| In-state | 51% | 56% | 54% | 48% | 53% | 46% | 59% | 61% | 59% | 58% | 59% | 56% | 50% | 51% |
| Out-of-state | 7% | 6% | 7% | 6% | 6% | 6% | 9% | 15% | 10% | 19% | 8% | 13% | 11% | 36% |
Data from this appendix table are displayed in the report in Figure D.
Table 4. Rates of College Enrollment in the First Year after High School Graduation for Class of 2011
| Low Income Schools | Higher Income Schools | All Charter Schools | All Private Schools | |||||||||||
| Urban Schools | Suburban Schools | Rural Schools | Urban Schools | Suburban Schools | Rural Schools | |||||||||
| High Minority Schools | Low Minority Schools | High Minority Schools | Low Minority Schools | High Minority Schools | Low Minority Schools | High Minority Schools | Low Minority Schools | High Minority Schools | Low Minority Schools | High Minority Schools | Low Minority Schools | |||
| Total N | 159,362 | 24,828 | 86,182 | 11,582 | 22,837 | 24,629 | 61,256 | 125,243 | 53,613 | 220,646 | 18,113 | 145,159 | 23,386 | 42,268 |
| Total | 60% | 62% | 63% | 60% | 60% | 55% | 68% | 74% | 70% | 76% | 68% | 69% | 63% | 87% |
| Public | 51% | 53% | 56% | 53% | 54% | 46% | 57% | 61% | 58% | 60% | 60% | 57% | 52% | 48% |
| Private | 8% | 9% | 7% | 7% | 6% | 9% | 10% | 13% | 11% | 16% | 8% | 12% | 12% | 38% |
| Two-year | 29% | 29% | 28% | 30% | 32% | 22% | 27% | 24% | 30% | 23% | 30% | 23% | 24% | 9% |
| Four-year | 31% | 32% | 35% | 29% | 27% | 33% | 41% | 50% | 40% | 53% | 37% | 46% | 40% | 77% |
| In-state | 53% | 55% | 57% | 54% | 54% | 48% | 58% | 60% | 57% | 58% | 59% | 56% | 53% | 50% |
| Out-of-state | 7% | 6% | 6% | 6% | 5% | 7% | 10% | 15% | 13% | 18% | 8% | 12% | 11% | 37% |
Table 5. Rates of College Enrollment in the First Two Years after High School Graduation for Class of 2011
| Low Income Schools | Higher Income Schools | All Charter Schools | All Private Schools | |||||||||||
| Urban Schools | Suburban Schools | Rural Schools | Urban Schools | Suburban Schools | Rural Schools | |||||||||
| High Minority Schools | Low Minority Schools | High Minority Schools | Low Minority Schools | High Minority Schools | Low Minority Schools | High Minority Schools | Low Minority Schools | High Minority Schools | Low Minority Schools | High Minority Schools | Low Minority Schools | |||
| Total N | 159,362 | 24,828 | 86,182 | 11,582 | 22,837 | 24,629 | 61,256 | 125,243 | 53,613 | 220,646 | 18,113 | 145,159 | 23,386 | 42,268 |
| Total | 65% | 66% | 69% | 64% | 66% | 59% | 73% | 79% | 74% | 80% | 73% | 73% | 69% | 90% |
| Public | 56% | 57% | 61% | 57% | 59% | 50% | 62% | 65% | 63% | 64% | 64% | 61% | 56% | 50% |
| Private | 9% | 10% | 8% | 7% | 7% | 10% | 11% | 14% | 12% | 16% | 9% | 12% | 13% | 40% |
| Two-year | 33% | 33% | 32% | 34% | 37% | 25% | 30% | 27% | 34% | 26% | 34% | 26% | 28% | 10% |
| Four-year | 32% | 34% | 37% | 31% | 29% | 35% | 43% | 52% | 41% | 55% | 39% | 47% | 41% | 80% |
| In-state | 58% | 59% | 62% | 58% | 59% | 52% | 62% | 63% | 61% | 62% | 64% | 60% | 57% | 51% |
| Out-of-state | 8% | 7% | 7% | 6% | 6% | 8% | 11% | 16% | 14% | 19% | 9% | 13% | 12% | 39% |
Table 6. Rates of College Enrollment in the First Two Years after High School Graduation for Class of 2010
| Low Income Schools | Higher Income Schools | |||||||||||
| Urban Schools | Suburban Schools | Rural Schools | Urban Schools | Suburban Schools | Rural Schools | |||||||
| High Minority Schools | Low Minority Schools | High Minority Schools | Low Minority Schools | High Minority Schools | Low Minority Schools | High Minority Schools | Low Minority Schools | High Minority Schools | Low Minority Schools | High Minority Schools | Low Minority Schools | |
| Total N | 132,196 | 20,275 | 69,869 | 9,281 | 19,506 | 14,517 | 56,313 | 117,409 | 51,956 | 212,659 | 12,037 | 122,274 |
| Total | 65% | 70% | 68% | 65% | 66% | 62% | 75% | 78% | 75% | 81% | 73% | 75% |
| Public | 56% | 59% | 60% | 55% | 60% | 52% | 63% | 64% | 64% | 63% | 63% | 61% |
| Private | 9% | 11% | 8% | 10% | 6% | 10% | 12% | 14% | 11% | 17% | 10% | 14% |
| Two-year | 34% | 35% | 32% | 34% | 38% | 29% | 28% | 28% | 33% | 27% | 34% | 29% |
| Four-year | 30% | 35% | 36% | 31% | 28% | 33% | 47% | 50% | 42% | 54% | 38% | 46% |
| In-state | 58% | 62% | 62% | 58% | 61% | 55% | 64% | 63% | 64% | 63% | 64% | 62% |
| Out-of-state | 7% | 7% | 6% | 7% | 6% | 7% | 11% | 15% | 12% | 17% | 9% | 13% |
Table 7. Persistence Rates from First to Second Year of College for Class of 2011
| Low Income Schools | Higher Income Schools | All Charter Schools | All Private Schools | |||||||||||
| Urban Schools | Suburban Schools | Rural Schools | Urban Schools | Suburban Schools | Rural Schools | |||||||||
| High Minority Schools | Low Minority Schools | High Minority Schools | Low Minority Schools | High Minority Schools | Low Minority Schools | High Minority Schools | Low Minority Schools | High Minority Schools | Low Minority Schools | High Minority Schools | Low Minority Schools | |||
| Total N | 94,848 | 15,320 | 54,331 | 6,894 | 13,610 | 13,444 | 41,514 | 93,203 | 37,267 | 167,724 | 12,270 | 99,671 | 14,773 | 36,638 |
| Total | 78% | 81% | 82% | 79% | 81% | 75% | 83% | 89% | 86% | 89% | 85% | 85% | 82% | 95% |
| Public | 77% | 80% | 81% | 79% | 81% | 74% | 82% | 88% | 85% | 88% | 84% | 84% | 81% | 93% |
| Private | 82% | 87% | 85% | 83% | 82% | 82% | 90% | 94% | 92% | 94% | 89% | 91% | 85% | 97% |
| Two-year | 69% | 72% | 73% | 73% | 74% | 64% | 72% | 78% | 77% | 78% | 75% | 73% | 72% | 82% |
| Four-year | 86% | 89% | 89% | 86% | 89% | 83% | 91% | 94% | 94% | 94% | 92% | 91% | 88% | 96% |
| In-state | 77% | 81% | 82% | 79% | 81% | 75% | 82% | 87% | 85% | 87% | 84% | 84% | 81% | 94% |
| Out-of-state | 82% | 83% | 84% | 79% | 82% | 79% | 91% | 93% | 91% | 95% | 89% | 91% | 87% | 96% |
Data from this appendix table are displayed in the report in Figure E.
Table 8. Persistence Rates from First to Second Year of College for Class of 2010
| Low Income Schools | Higher Income Schools | |||||||||||
| Urban Schools | Suburban Schools | Rural Schools | Urban Schools | Suburban Schools | Rural Schools | |||||||
| High Minority Schools | Low Minority Schools | High Minority Schools | Low Minority Schools | High Minority Schools | Low Minority Schools | High Minority Schools | Low Minority Schools | High Minority Schools | Low Minority Schools | High Minority Schools | Low Minority Schools | |
| Total N | 76,990 | 13,060 | 43,268 | 5,528 | 11,796 | 8,193 | 39,119 | 86,735 | 36,492 | 163,083 | 8,034 | 85,994 |
| Total | 79% | 83% | 83% | 79% | 80% | 77% | 85% | 88% | 87% | 89% | 84% | 86% |
| Public | 79% | 82% | 82% | 77% | 80% | 76% | 84% | 87% | 86% | 88% | 83% | 84% |
| Private | 82% | 88% | 87% | 86% | 83% | 84% | 91% | 93% | 93% | 95% | 89% | 92% |
| Two-year | 71% | 75% | 75% | 71% | 74% | 67% | 76% | 77% | 78% | 78% | 74% | 74% |
| Four-year | 88% | 91% | 89% | 86% | 89% | 85% | 90% | 94% | 93% | 95% | 92% | 92% |
| In-state | 79% | 83% | 82% | 78% | 80% | 77% | 84% | 87% | 86% | 88% | 83% | 84% |
| Out-of-state | 83% | 86% | 85% | 83% | 80% | 80% | 91% | 93% | 91% | 95% | 88% | 91% |