Yearly Success and Progress Rates – 2016 (PDF)
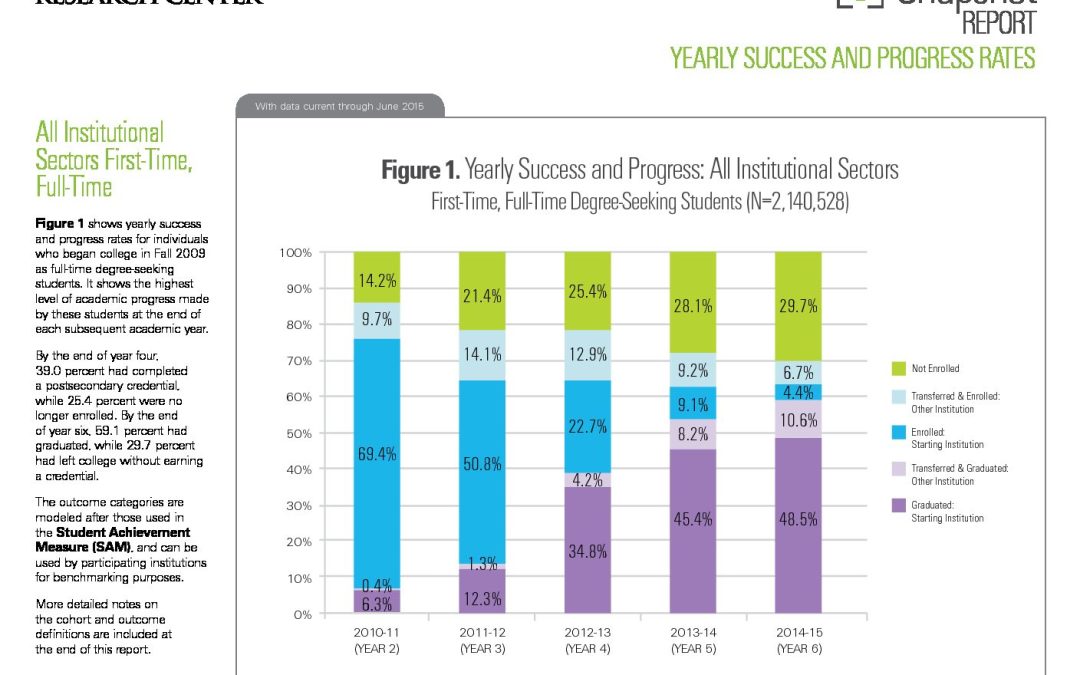
The data shows yearly success and progress rates for individuals who began college in Fall 2009 as full-time degree-seeking students. It shows the highest level of academic progress made by…

The data shows yearly success and progress rates for individuals who began college in Fall 2009 as full-time degree-seeking students. It shows the highest level of academic progress made by…
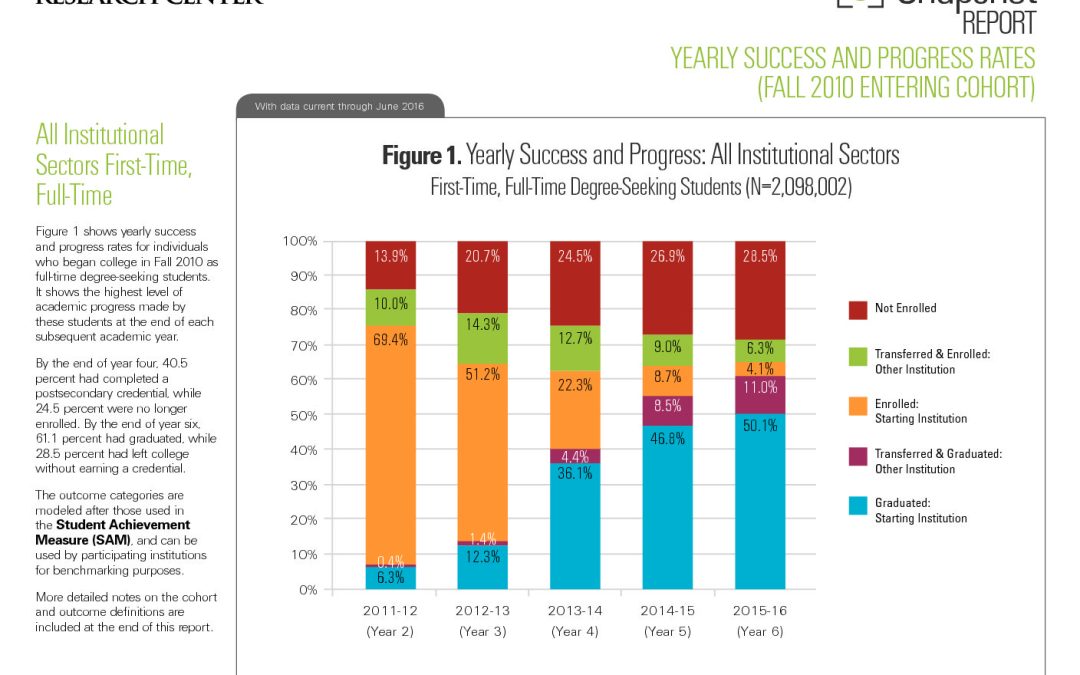
Shows yearly success and progress rates for individuals who began college in Fall 2010 as full-time degree-seeking students. It shows the highest level of academic progress made by these students…
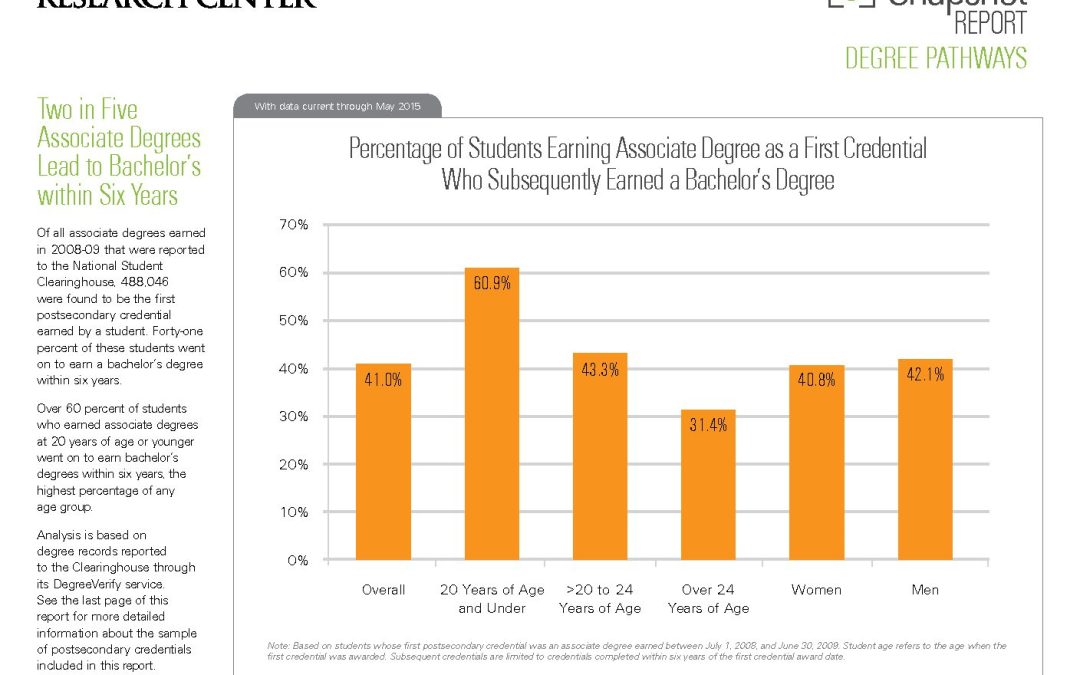
Of all associate degrees earned in 2008-09 that were reported to the National Student Clearinghouse, 488,046 were found to be the first postsecondary credential earned by a student. Forty-one percent…
The Yearly Success and Progress Rates report goes beyond traditional student outcome measures by showing year-by-year rates of retention, persistence, transfer, completion, and stop-out. The report is designed to help…
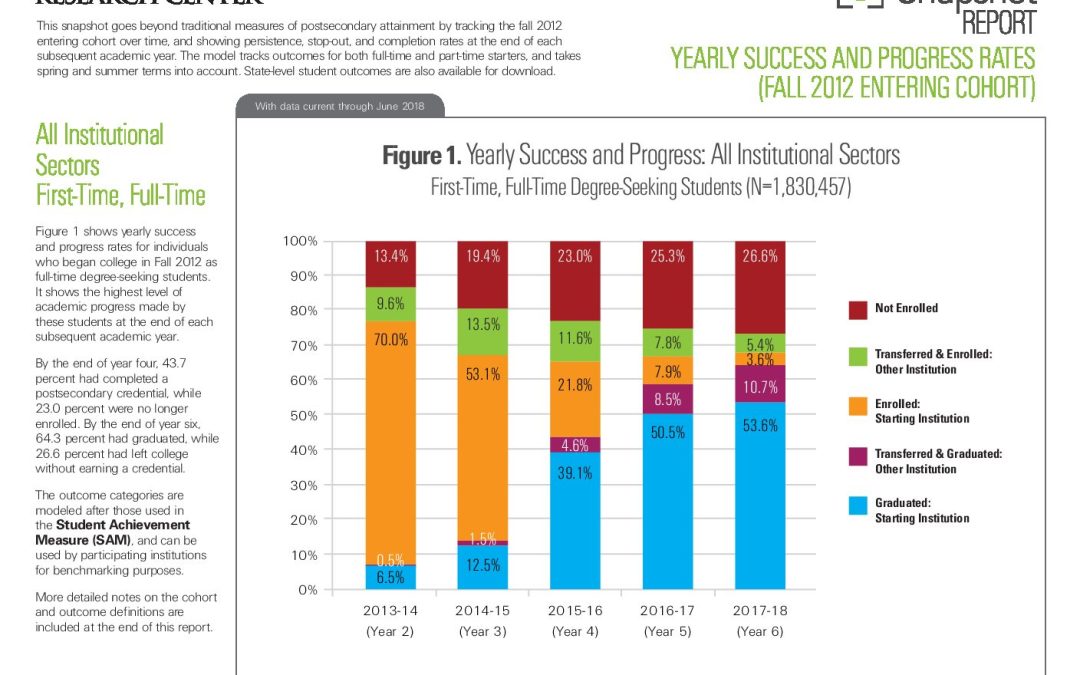
This snapshot goes beyond traditional measures of postsecondary attainment by tracking the fall 2012 entering cohort over time, and showing persistence, stop-out, and completion rates at the end of each…

…students at the national level are available (Aud et al., 2013). Many schools and districts also have access to timely reports on the college access and persistence rates of their…
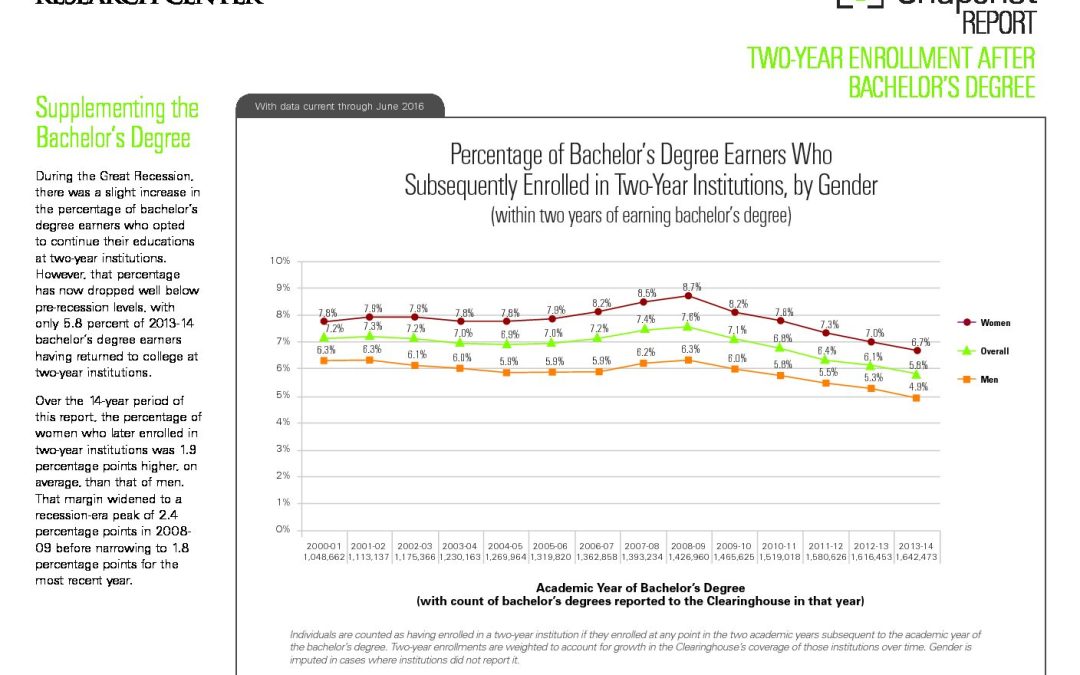
During the Great Recession, there was a slight increase in the percentage of bachelor’s degree earners who opted to continue their educations at two-year institutions. However, that percentage has now…
As a supplement to Completing College: A National View of Student Attainment Rates, the National Student Clearinghouse Research Center’s fourth publication in the Signature Report series, this report focuses on…
This paper is part of the larger series Envisioning the National Postsecondary Data Infrastructure in the 21st Century. In August 2015, the Institute for Higher Education Policy (IHEP) first convened…
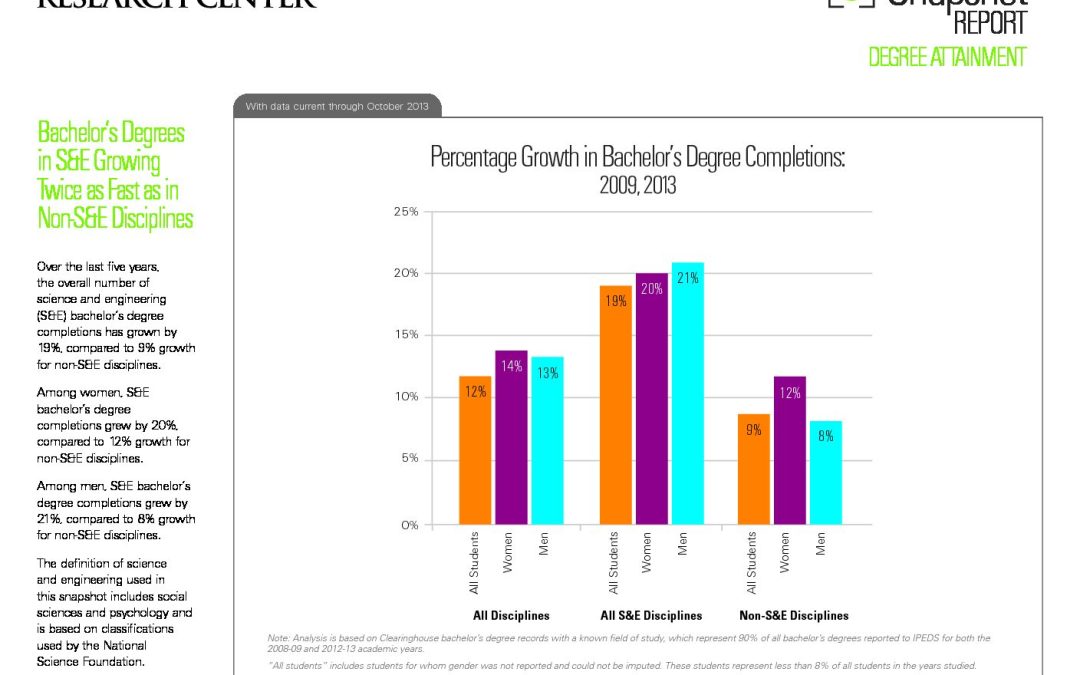
…bachelor’s degree completions has grown by 19%, compared to 9% growth for non-S&E disciplines. Among women, S&E bachelor’s degree completions grew by 20%, compared to 12% growth for non-S&E disciplines….
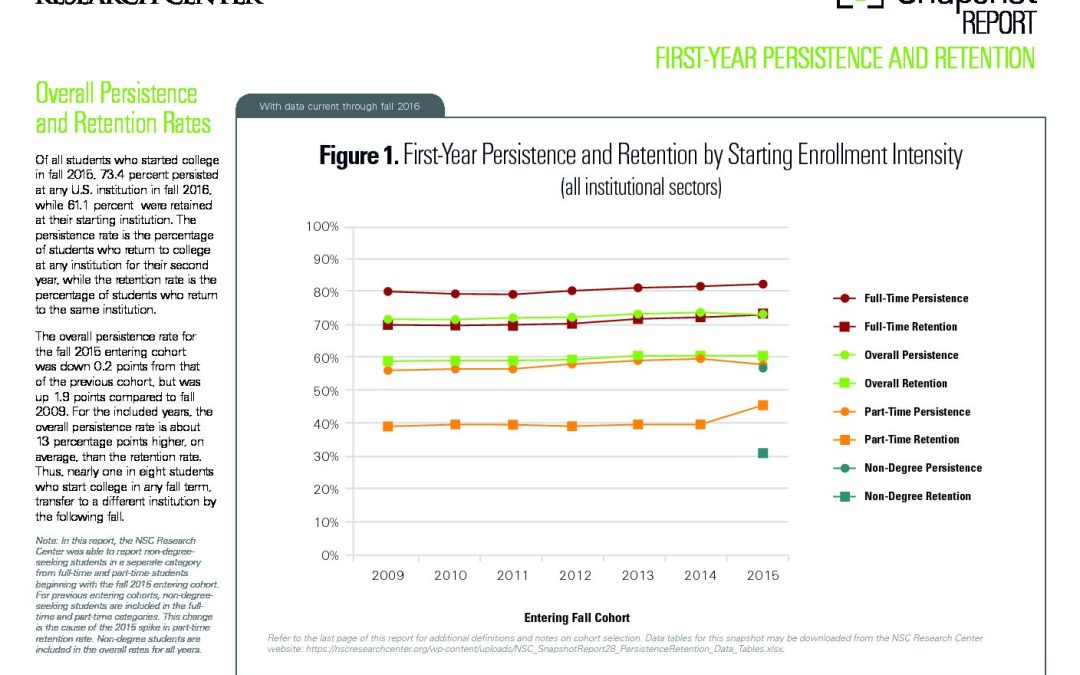
Of all students who started college in fall 2015, 73.4 percent persisted at any U.S. institution in fall 2016, while 61.1 percent were retained at their starting institution. The persistence…
This supplement to our Signature Report 12 provides six-year completion rates, including degree and certificate completion, disaggregated by race and ethnicity for students who began postsecondary education in fall 2010….