UDE-2020_FIGURES_TABLES


…considered enrolled at two-year institutions if they had at least one full-time or part-time enrollment at a two-year institution prior to the four-year completion date. Note: The state shown is…
This second report on transfer and mobility examines multiple transfer pathways for the cohort of students who started postsecondary education in 2008.
…students who started postsecondary education in fall 2011. It analyzes student enrollment patterns across different institutions and across state boundaries, including, for the first time, disaggregations by race and ethnicity….
…college degree or certificate. Among the study’s findings: Nationally, 12 percent of students who started at four-year public institutions completed at an institution other than the starting institution. In 20…
This report examines six-year and eight-year college student success outcomes, focusing primarily on degree and certificate completion of a cohort of first-time-in-college, degree-seeking students who started their postsecondary education at…
As the eighth in the Completing College report series, the 2019 edition presents both the national six-year completion outcomes for the 2013 entering student cohort and the national eight-year results…
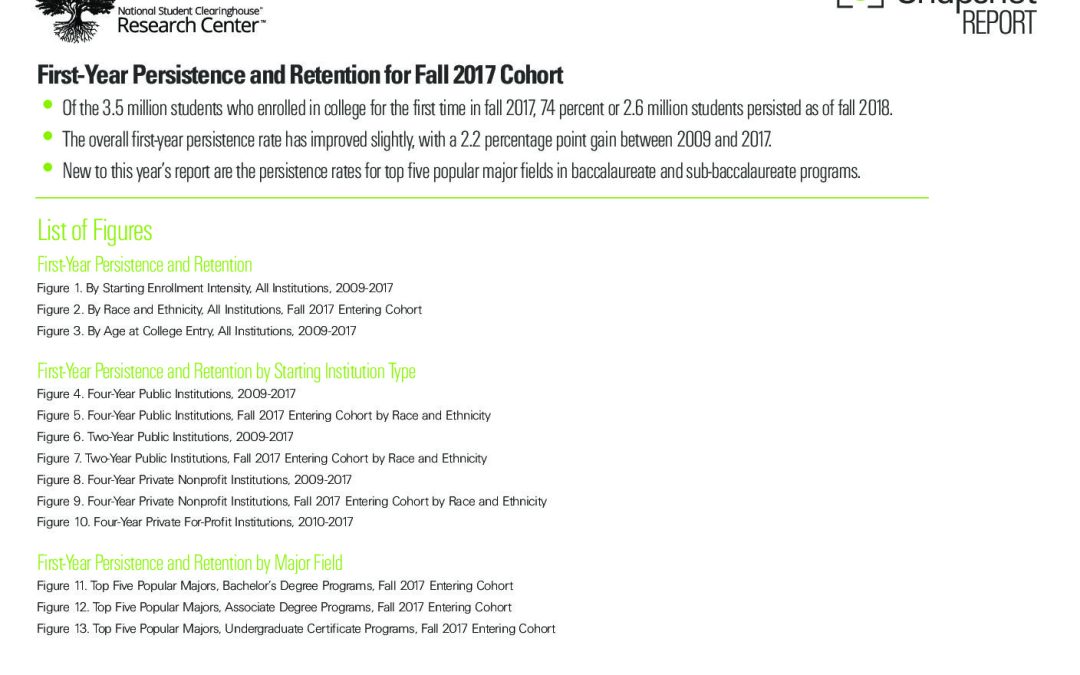
Of the 3.5 million students who enrolled in college for the first time in fall 2017, 74 percent or 2.6 million students persisted as of fall 2018. The overall first-year…
In 2018-19, the most recent academic year for which data are available, approximately 3.7 million students graduated with an undergraduate credential. The 3.7 million overall degree earner numbers are seven…
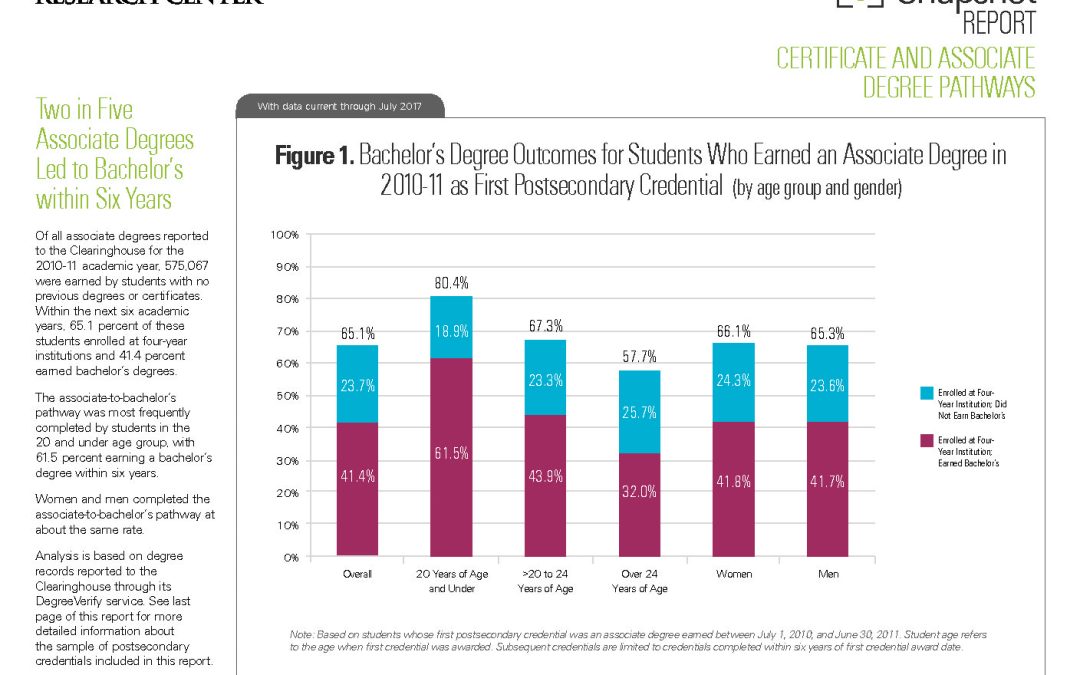
Of all associate degrees reported to the Clearinghouse for the 2010-11 academic year, 575,067 were earned by students with no previous degrees or certificates. Within the next six academic years,…
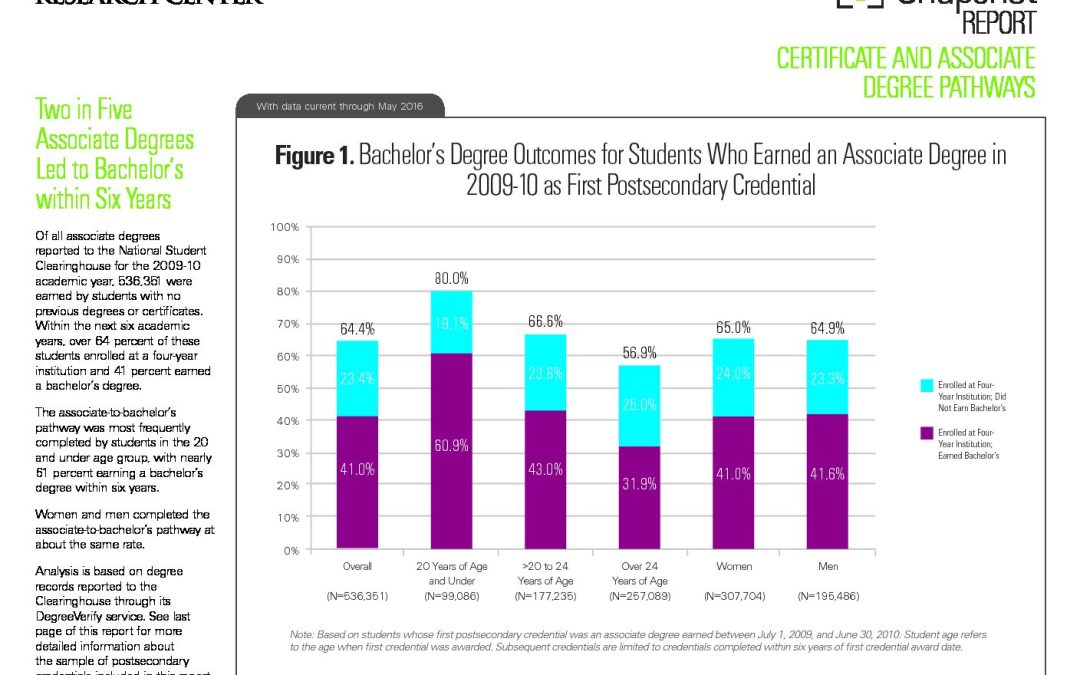
Of all associate degrees reported to the National Student Clearinghouse for the 2009-10 academic year, 536,351 were earned by students with no previous degrees or certificates. Within the next six…
As the twelfth in the Completing College series, this report updates the six-year college completion rates nationally and by state, by tracking the enrollment and completion outcomes for the fall…
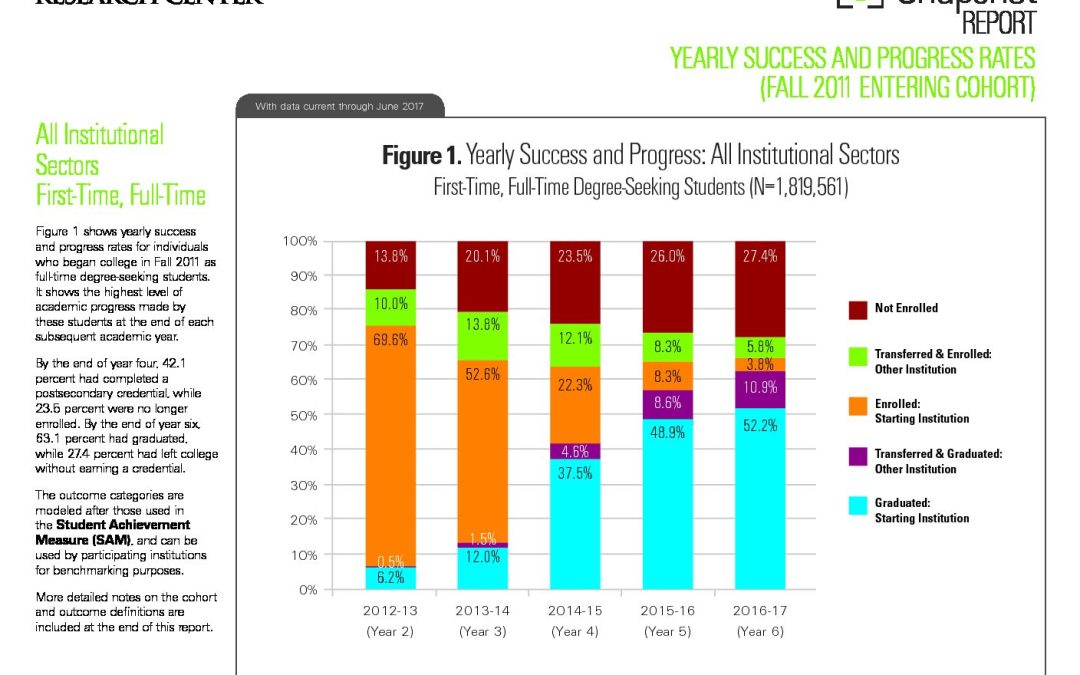
Shows yearly success and progress rates for individuals who began college in Fall 2011 as full-time degree-seeking students. It shows the highest level of academic progress made by these students…