

Completing College – National – 2015
This fourth annual report on national college completion rates offers a look at the six-year outcomes for students who began postsecondary education in fall 2009, the cohort that entered college as the Great Recession was ending. It looks at the various pathways students took toward degree completion, as well as the completion rates through May 2015 for the different student types who followed each pathway. The report also provides discussion comparing the fall 2009 cohort’s outcomes to those of the fall 2008 cohort (analyzed in our third annual completions report, Signature Report 8).
Suggested Citation: Shapiro, D., Dundar, A., Wakhungu, P.K., Yuan, X., Nathan, A. & Hwang, Y. (2015, November). Completing College: A National View of Student Attainment Rates – Fall 2009 Cohort (Signature Report No. 10). Herndon, VA: National Student Clearinghouse Research Center.
Table of Contents
- About This Report
- Executive Summary
- Introduction
- Results
- Overall Six-Year Outcomes
- Students Who Started at Four-Year Public Institutions
- Students Who Started at Two-Year Public Institutions
- Students Who Started at Four-Year Private Nonprofit Institutions
- Students Who Started at Four-Year Private For-Profit Institutions
- Completion across State Lines
- Supplemental Feature: Eight‐Year Outcomes for Fall 2007 Cohort
- Discussion of Results for the 2009 Cohort and Changes from the 2008 Cohort
- Acceleration of the Decline in Overall Completion Rates
- Declines in Completion Rates across Ages and Enrollment Intensities
- Completion Rates for Students Who Started at Four-Year Public Institutions
- Continued Decline in Completion Rates for Students Who Started at Two-Year Public Institutions, Including Completions at Four-Year Institutions
- Completion Rates at Four-Year Private Nonprofit Institutions Reverse Their Gains of Previous Year
- Completion Rates for Students Who Started at Four-Year For-Profit Institutions Continue Steep Declines
- Eight-Year Outcomes for Fall 2007 National Cohort
- Implications for Policy
- References
- Appendix A: Methodological Notes
- Appendix B: Coverage Tables
- Appendix C: Results Tables
About This Report
AUTHORS
National Student Clearinghouse Research Center
- Doug Shapiro
- Afet Dundar
Project on Academic Success, Indiana University
- Phoebe Khasiala
- WakhunguXin Yuan
- Angel Nathan
- Youngsik Hwang
ACKNOWLEDGEMENTS
The authors gratefully acknowledge the contributions of Victor Borden, director of Project on Academic Success and Professor of Higher Education and Student Affairs at Indiana University; and Don Hossler, Emeritus Professor of Educational Leadership and Policy Studies at Indiana University Bloomington. Their efforts, comments, and suggestions were extremely important to the development of the report. Of course, any remaining errors or omissions are solely the responsibility of the authors.
SPONSOR
This report was supported by a grant from the Lumina Foundation. Lumina Foundation, an Indianapolis-based private foundation, is committed to enrolling and graduating more students from college — especially 21st century students: low-income students, students of color, first-generation students and adult learners. Lumina’s goal is to increase the percentage of Americans who hold high-quality degrees and credentials to 60 percent by 2025. Lumina pursues this goal in three ways: by identifying and supporting effective practice, through public policy advocacy, and by using our communications and convening power to build public will for change. For more information, log on to www.luminafoundation.org.
Executive Summary
This Signature Report focuses on the six-year outcomes for students who began postsecondary education in fall 2009. These students were part of the surge of increased enrollments that accompanied the Great Recession, arriving on campus at a time when institutions were already dealing with reduced public budget support (Barr & Turner, 2013; Mangan, 2009). One result was that institutions were forced to increase tuition just as students and their families found themselves with diminished financial resources, leading to questions about growing levels of student debt and whether this might affect rates of degree completion (Long, 2013).
In our previous national college completions report, published in November 2014, we studied the cohort of students who entered college in fall 2008, at the peak of the recession. That report first identified how the dramatic change in the cohort’s size and composition affected its college completion rates. Compared to fall 2007, the 2008 cohort was 12 percent larger, with a higher number of older students and a higher share of students enrolled less than full-time. Cost considerations appeared to combine with these shifts, resulting in an overall jump in the percentage of students choosing to enroll in community colleges. Six years later, the overall completions rate for the 2008 cohort had fallen by one percentage point, from 56.1 percent to 55.0 percent.
The official end of the Great Recession is considered to be June 2009 (National Bureau of Economic Research, 2010). However, its effects on employment, wages, and family finances have lingered, impacting students and their colleges and universities through 2009, and well beyond. This year’s completions report clearly shows the continuing effects of recession on the fall 2009 cohort:
- The overall size was larger still: at over 2.9 million, there were 8 percent more students in 2009 than in fall 2008.
- There was an even higher growth in the number of older students (over age 24 at first entry): 24 percent more than in fall 2008.
- The share of the cohort enrolling at less than full-time status increased by another half of a percentage point.
- The share of the cohort enrolling in community colleges grew an additional 1.3 percentage points.
The continuation of each of these trends clearly points to an expectation that completion rates would decline further as well, which is precisely what we observed.
MAJOR FINDINGS AND IMPLICATIONS
Acceleration of the Decline in Overall Completion Rates
The overall national six-year completion rate for the fall 2009 cohort was 52.9 percent, a decline of 2.1 percentage points from the fall 2008 cohort, or twice the rate of decline that we observed in last year’s report when we compared the 2007 cohort to the 2008 cohort. Combined with a small decrease in the percent of students who were still enrolled in their sixth year without having earned a degree (less than one percentage point), the rate at which students were no longer enrolled in the final year of the study period increased 2.7 percentage points, from 30.3 percent for the fall 2008 cohort to 33.0 percent for the fall 2009 cohort. Despite the fall 2009 cohort’s lower rate of completion, the total number of graduates it produced six years later still increased (by about 71,000 students) because the fall 2009 cohort was much larger than that of fall 2008. The number of students from the 2009 starting cohort who left college without a credential or continuing enrollment in the sixth year also grew, by 153,000 students.
Examining the results by age and enrollment intensity reveals that all student populations experienced declines in their attainment rates. Nonetheless, some groups had larger declines than others. In particular, older students and exclusively full-time students experienced some of the largest drops in completion rates.
Declines in Completion Rates across Ages and Enrollment Intensities
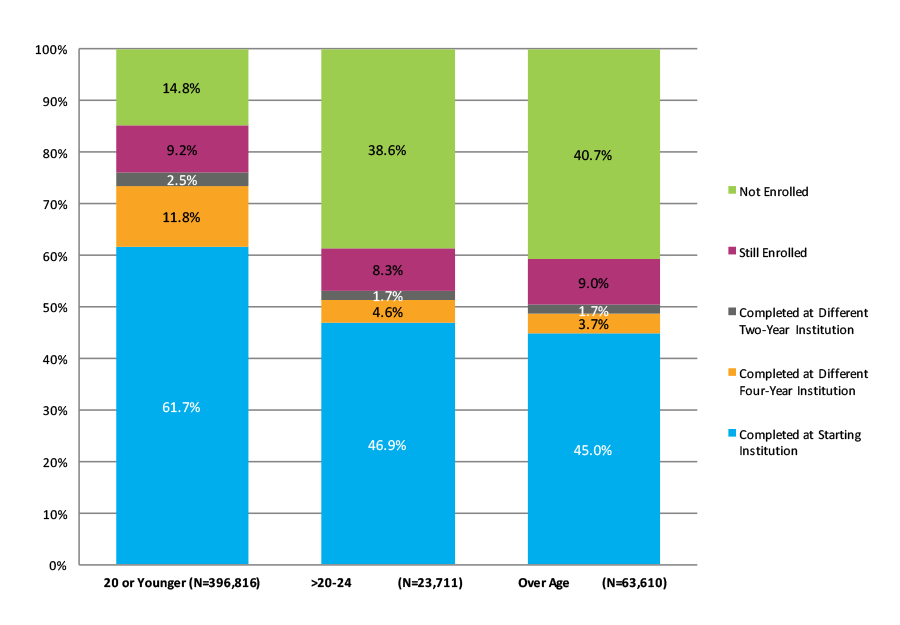
We examined postsecondary outcomes for students in three age groups: those who began postsecondary education immediately after high school (age 20 or younger), those who delayed entering college for a few years (over age 20 through 24), and adult learners (over age 24). Compared to the fall 2008 cohort results, the decline in completion rates was largest for the delayed entry group, which fell 4.7 percentage points (from 38.3 to 33.6 percent). Adult learners experienced a decrease of 2.9 percentage points (from 42.1 to 39.2 percent) compared to a decrease of only 0.75 percentage points for the traditional-age group (from 59.3 to 58.6 percent).
Both of the older age groups also showed declines within each of the three enrollment intensity categories. The largest declines were among exclusively full-time students, who showed decreases of 9.2 percentage points in the delayed entry group and 7.2 percentage points among adult learners. These patterns were consistent when we examined the results for men and women separately. Within each gender group, the decline in the completion rate among exclusively full-time students was larger than the declines for part-time or mixed enrollment students. The same was also true among traditional-age students, by far the cohort’s largest age group, where the completion rate for those enrolled exclusively full time fell 1.1 percentage points, a steeper decline than for part-time or mixed enrollees.
Completion Rates Declined in Four-Year Institutions
Completion rates declined in both public and private four-year institutions. For students who started at four-year public institutions, the completion rate for the fall 2009 cohort decreased 1.7 percentage points compared to that of fall 2008 cohort (61.2 percent vs. 62.9 percent). Most of this decline occurred in the rate at which students graduated from their starting institution (1.4 percentage points lower), while the rate at which students transferred and completed elsewhere remained relatively unchanged. As was true for the cohort overall, students in the delayed entry group had the largest decline in completion rates at public four-year institutions (from 50.7 percent to 43.1 percent), followed by adult learners (from 45.9 percent to 42.6 percent). Traditional-age students in this sector, meanwhile, had a less than one percentage point decrease.
The completion rate for students who started in four-year private nonprofit institutions in fall 2009 decreased 2.1 percentage points compared to the fall 2008 cohort, from 73.6 percent to 71.5 percent. This also represents a decline from the 72.1 percent rate recorded two years ago for the fall 2007 cohort, after having increased for the fall 2008 cohort. Disaggregating the results by age shows that the decline in the overall completion rate for this sector can almost exclusively be explained by the lower completion rate among older students (declines of 8.7 percentage points for the delayed entry group and 5.0 percentage points among adult learners). By contrast, completion rates for traditional-age students declined by only 0.6 percentage points.
The size of the cohort for this sector increased 4.3 percent from fall 2008 to fall 2009. However, the increase was significantly larger among older students: the delayed entry group increased by 35.3 percent and adult learners by 19.3 percent. The increase in the number of traditional-age students was very small, less than one percent.
The dramatic decline in the six-year completion rate for those who started at four-year for-profit institutions in 2008 continued for this cohort. In last year’s report, we found a 3.9 percentage point decrease in completions for the fall 2008 cohort compared to that of the previous year (from 42.3 to 38.4 percent). The completion rate dropped even further this year, to 32.8 percent for the fall 2009 cohort. The percentage who stopped out or dropped out without a degree or certificate increased from 49.9 percent for the fall 2008 cohort to over half of the fall 2009 cohort: 56.1 percent.
The size of the cohort for the for-profit sector also continued the upward trend we observed in the previous year’s report, although at a somewhat slower rate. While the growth in the cohort from fall 2007 to fall 2008 was 35 percent, it was only 20 percent from fall 2008 to fall 2009. An examination of cohort sizes by age groups shows that most of the increase in the cohort size in 2009 occurred among delayed entry students (20 percent) and adult learners (23 percent), rather than among traditional-age students (7 percent).
Decline in Completion Rates for Students Who Started at Two-Year Public Institutions Continued, Including Completions at Four-Year Institutions
The total completion rate for two-year starters, regardless of whether the completion occurred at a two-year or four-year institution, declined one percentage point, from 39.1 percent for the fall 2008 cohort to 38.1 percent for 2009 students. The decline was almost entirely among students completing at transfer institutions (0.9 percentage point drop).
In addition to examining the overall completion rates of students who started at two-year public institutions, we also looked specifically at their completions at four-year institutions. This rate also continued its decline, falling another percentage point for the 2009 cohort after the one-point decline we observed for 2008 students when compared to 2007. In total, 15.1 percent of two-year starters had completed a degree at a four-year institution by the end of the study period, down from 16.2 percent for the fall 2008 cohort. This decline occurred mostly in the completion rate of students who received their degree from a four-year institution without first obtaining a two-year degree.
Eight-Year Outcomes for Fall 2007 National Cohort
This report’s supplemental feature examined eight-year outcomes for the fall 2007 cohort, following their enrollment patterns through spring 2015. With the two extra years, a total of 45.0 percent of the 2007 cohort completed at their starting institution and an additional 16.8 percent completed at a different institution, for a combined completion rate of 61.8 percent nationally. This represents a 5.8 percentage point increase in total completions compared to the six‐year rate.
Results show that students who required the two extra years to complete their first degree were slightly more likely to do so at a different institution than at the institution where they started: the completion rate increased 2.1 percentage points at the starting institution and 3.7 percentage points at a different institution. Among students with mixed enrollment, the eight-year total completion rate showed a marked increase over the six-year completion rate for the same cohort (51.8 percent and 43.2 percent, respectively). For exclusively part-time students, the eight-year completion rate was only three percentage points higher than the six-year completion rate (24.8 percent and 21.8 percent, respectively).
Examining the increases in the completion rate from six years to eight years by age revealed larger increases for traditional-age and delayed entry students than for adult learners. The eight-year completion rate had about an 11 percent increase over the six-year rate for traditional-age students, a 12 percent increase for delayed entry students, and only a 7 percent increase for adult learners.
IMPLICATIONS FOR POLICY
The results show that the Great Recession continued to affect student attainment rates even for the cohort that entered college after the nominal end of the recession. While the fall 2008 cohort reflected an increase in enrollments mostly in community colleges and for-profit institutions, the fall 2009 cohort had enrollment surges in all types of schools. As the number of high school graduates neared its peak, all institution types saw larger enrollment increases among older students than traditional-age students. Unlike the previous year’s report, however, this year we found declines not only in the overall national completion rate, but for every institution type and all student subgroups. The report continues to illustrate the value of disaggregating results for different types of students in different types of institutions. Using student-level data to do so enables a deeper understanding of the change in outcomes for the 2009 cohort, including often dramatically different attainment rates for students by gender, age, and enrollment behaviors.
These results should not be taken as an indication that the considerable efforts to drive improvement in student outcomes at the institutional, state, and federal levels have been ineffective. Indeed, one might easily conclude that without them the declines could have been even worse for particular types of students or institutions, given the demographic and economic forces at play. In this spirit, we hope that the report helps practitioners and policymakers alike identify where opportunities for improvement may be greatest.
This report’s findings do, however, reiterate the need for developing measures that capture the complexity of students’ postsecondary pathways. We have long known that these pathways increasingly involve student mobility across institutional and state lines, part‐time and mixed enrollment, a gender gap that varies by age, and entry into postsecondary institutions at a variety of different ages and life circumstances. Developing new measures of student success outcomes is essential if we are to inform and improve public and institutional policies in ways that acknowledge and respond to today’s student pathways.
Introduction
This Signature Report focuses on the six-year outcomes for students who began postsecondary education in fall 2009. These students entered college at the tail end of the Great Recession; a time when institutions were dealing with declined public budget support and explicit increases in enrollment (Barr & Turner, 2013; Mangan, 2009). Among other effects of the economic recession were tuition increases to counterbalance reductions in government budget allocations and decreased income due to unemployment (Long, 2013).
Conventional wisdom is that postsecondary enrollments rise in hard economic times. Increased layoffs can certainly send greater numbers of adult learners to colleges and universities for retraining or advanced credentials. At the same time, however, it was common for the housing crisis and the broader effects of the recession to strain family finances, leaving many with fewer resources to invest in the education of traditional-age students. (Dundar et. al., 2011). It is with this background that this report aims to examine the various pathways taken by students within the fall 2009 cohort and their persistence and completion rates through May 2015. In addition, the report compares the outcomes of the 2009 cohort to those of the fall 2008 cohort, which were examined in the previous year’s report (Shapiro et al, 2014). Given the national focus on the college completion agenda, this report’s findings have practical implications for families, students, policymakers, institutions, and other stakeholders.
THE COLLEGE COMPLETION AGENDA AND PERFORMANCE-BASED FUNDING
College completion is the focus of a national agenda. Many states have also set various goals to increase graduation rates. In support of this call, a wide range of organizations across the U.S. have launched initiatives to increase the number of adults in the U.S. who have a postsecondary credential. The College Board, for example, is working toward increasing the percentage of college-educated adults from the current 39 percent level to 55 percent by 2025 (College Board, 2010; Lee, et al., 2011). At the same time, the Bill and Melinda Gates Foundation (2015) seeks to double the number of low-income students who achieve a postsecondary credential by age 26. The Lumina Foundation’s Goal 2025 aims to “increase the percentage of Americans with high-quality degrees and credentials from the enduring rate of 39 percent to 60 percent by the year 2025” (Lumina Foundation for Education, 2009, p. 1) and also made a $4 million dollar commitment in 2013 to accelerate college completion in local communities (Sander, 2013). The initiatives of most organizations that have responded to the call to increase college completions are focused on improving completion outcomes, particularly among low-income and underrepresented students. According to Witham et al. (2015), states need to eliminate disparities within ethnic groups and across states in college attendance and completion rates and also involve faculty and institutional practitioners, who may have competing interest with the state and the knowledge to improve student outcomes to achieve the completion agenda.
One of the recommended strategies to increase degree completion is the embrace of performance-based funding policies. Many states have adopted these policies and several are considering them. While performance funding may lead colleges and universities to change their policies and practices, it is uncertain whether it actually improves student outcomes. (Dougherty et al. 2014; Friedel et al. 2013; National Conference of State Legislatures 2014; Walters, 2012). The results are not yet clear because determining the impact of performance-based funding programs is difficult and graduation rate increases may instead be due to various other factors, such as strategies to improve student outcomes (Dougherty et al. 2014). Rutherford & Rabovsky’s (2014) study, for example, showed that performance funding policies did not improve student outcomes and that they may actually contribute to lower performance over time. Hillman, Tandberg and Gross’s (2014) study, also revealed that performance-based funding programs did not systematically increase degree completions within the state of Pennsylvania. Sanford and Hunter (2011) found no significant improvement in completion rates in states using performance-based funding models compared to similar institutions in other states that do not. Although performance-based funding provides incentives for colleges to increase enrollment rates, it does not offer incentives to institutions to assist students to succeed (National Conference of State Legislatures, 2015; Walters, 2012). This has resulted in states opting for funding policies aligned with state objectives and priorities (National Conference of State Legislatures, 2015). Recently, performance-based funding has been re-branded as outcomes-based funding, clearly defining institutional success in terms of degree completion rather than increased enrollments (Jones, 2013; Wayt, 2015).
EMERGING THEME IN HIGHER EDUCATION
An emerging theme in the literature is the need to diversify support services in order to meet the needs of higher education’s growing and diverse student population (DiPrete & Buchmann, 2006; Ebersole, 2014; Glazer, 2015; Lockerman, 2013; Sandoval-Lucero, 2014; Terriquez, 2015; Wagner, 2015). Scholarly evidence links the importance of financial aid availability and college completion (Dwyer, 2012; Hillman & Orians, 2013). Other findings show that the major factors leading to institutional departure include family expectations, lack of social integration, confusion about academic major, and academic/employment balance (Bers & Schuetz, 2014; Hunt et al., 2012). This reaffirms the importance of creating diverse opportunities for student engagement at higher education institutions to compliment completion efforts.
PRIOR REPORTS ON COLLEGE COMPLETION
Several national reports and empirical studies rely on established measures used by long-standing data sources, such as IPEDS (e.g., first-to-second year retention, first-time full-time cohort graduation rates, and degree awards). These reports are considerably limited in their ability to provide adequate information for evaluating institutional performance and student outcomes. Empirical studies that only use conventional student success measures, such as completion rates at institutions of origin, are substantially limited in their ability to capture student outcomes. They fail to recognize institutional efforts to encourage enrollment mobility, notably at community colleges that help students achieve their personal educational goals. Most studies tend to focus on a single institution or region and rely on institutional or state-level student unit record data. As a result, they fail to account for increasingly common enrollment behaviors, such as multi-institution enrollment, cross-state transfer, and transfer between institutional sectors (Bach et al., 2000; Hillman, Lum, & Hossler, 2008).
In addition, students who enroll in college full time immediately after high school no longer represent the majority of postsecondary college students (Choy, 2002; Horn & Carroll, 1997; Mullin, 2012; Petty 2014; Reeves, Miller, & Rouse, 2011). Because these “nontraditional” students have many external demands and competing interests, conventional measures of success – such as, graduation rates for institution-based, first-time full-time degree-seeking cohorts – are insufficient for understanding the particular risks and support structures that shape their academic careers (ACSFA, 2012; Committee on Measures of Student Success, 2011; Moore & Shulock, 2009; University Professional and Continuing Education Association Center for Research and Consulting & InsideTrack, 2012; U.S. Department of Education, 2011). Subsequently, a fundamental aspect of recent college completion research pays attention to the development and adoption of new and more appropriate measures of success.
WHAT TO FIND IN THIS REPORT
This report highlights the completion of postsecondary certificates and degrees by first-time-in-college degree-seeking students who initially enrolled in two- and four-year colleges and universities (public, private nonprofit, or private for-profit) nationwide in fall 2009. The study follows the fall 2009 cohort’s college enrollment behaviors for six years through spring 2015. The study cohort includes former dual enrollment students (first-time college students in fall 2009 who had taken college courses while still in high school).
- Results: Six-year outcomes provided in this report include completions at students’ starting institutions, completions at institutions other than the starting institution, and continued enrollment of noncompleters through the end of the study period. While the report emphasizes students’ first completions, it also provides the subsequent completions at four-year institutions of students whose first credential was awarded by a two-year institution. Six-year postsecondary outcomes are presented by students’ age at first entry into college, by enrollment intensity, and by the type of institution where students first enrolled. Results for students in three categories of enrollment intensity are also presented: (1) exclusive full-time enrollment, (2) exclusive part-time enrollment, and (3) enrollments showing both full- and part-time terms during the six years examined (mixed enrollment students).
- Supplemental Feature: Explores eight-year postsecondary outcomes for the fall 2007 cohort.
- Discussion Section: Highlights the major findings of the report and discusses how they compare to the outcomes of the fall 2008 cohort.
A NOTE ON THE DATA
Data Source
The data for this report were drawn from the StudentTracker® and DegreeVerifySM services, administered by the National Student Clearinghouse® (The Clearinghouse), which tracks 96 percent of college enrollments nationwide across all postsecondary institutions, including all institution types: two-year and four-year institutions, public and private institutions, and nonprofit and for-profit institutions. In order to ensure the most accurate possible representation of student outcomes for the study cohort, the results reported here are weighted according to the formula described in Appendix A using the state-by-state coverage rate for each institution type (sector and control). A complete explanation of national coverage rates and the weights used to ensure that results reflect enrollment and completion by sector and control can be found in Appendices A and B.
The student outcomes captured in this report are based on student-level data representing an unduplicated headcount of students across all institutions, a feature of the Clearinghouse data sets that distinguishes them from many other data sources, including the Integrated Postsecondary Education Data System (IPEDS), that may not accurately capture the complexity of postsecondary pathways because they are not structured to identify multiple enrollments by individual students. The capability of StudentTracker to link enrollment records across institutions nationally allows researchers to follow students longitudinally as they move from institution to institution, producing a fuller picture of college persistence and completion.
Although Clearinghouse data contain demographic information on students, historical coverage rates for the demographic data elements are uneven. Therefore, the results summarized in this report give a national overview of college completion by age at first entry and by enrollment intensity, showing the percentage of students who enrolled or completed at various types of institutions, but they do not examine completion by race/ethnicity, for example.
Cohort Definition
The cohort examined in this study is made up of first-time degree-seeking students, of any age, who began their postsecondary studies in the fall of 2009. Showing intent to seek a degree or certificate was defined as follows1:
- For students who started at four-year institutions, enrolled at least one term with an intensity of half-time or higher; and
- For students who started at two-year institutions, either:
- Enrolled full-time for at least one term before August 9, 2010, or
- Enrolled at least half-time for any two terms before December 31, 2010.
First-time status was established by confirming that a student (1) did not show any postsecondary enrollment record in the four years prior to the student’s fall 2009 enrollment, and (2) did not receive a degree or certificate from any postsecondary institution prior to fall 2009, according to Clearinghouse data. An exception was made for former dual enrollment students: first-time college students in fall 2009 who had taken college courses while still in high school were included in the study cohort.
Depending on the strengths and limitations of the data sets they use in their analysis, researchers face considerable complexity in operationalizing the category “first-time student.” For this report, the Clearinghouse and the Project on Academic Success (PAS) balanced competing priorities in selecting a method for identifying the study cohort. On the one hand, Clearinghouse data allowed the researchers to capture a unique headcount of students nationally and, therefore, to follow individual students while also accounting for concurrent enrollments. In addition, Clearinghouse data allowed the researchers to establish first-time enrollment status empirically, i.e., by searching for prior enrollments rather than by relying on institutions’ reports, which may include idiosyncratic definitions as well as errors in transactional records. On the other hand, some limitations do arise with the method for identifying the study cohort in this report.
Because Clearinghouse data on designations for class year are incomplete, for example, the researchers were not able to use them for this report. Consequently, this study’s sample may include students who have more than 30 Advanced Placement (AP), International Baccalaureate (IB), or dual enrollment credits (students included in this study’s sample as first-time students who, in fall 2009, were enrolled in college courses while still in high school), and who may not be considered freshmen by their institutions, despite having first-time-in-college status. Moreover, because of inconsistencies in the historical depth of DegreeVerify database records, it is possible that a small number of graduate students are also included in the study cohort. (For a full discussion of data, definitions, and limitations, please see Appendix A.)
Throughout this report, we examine college completion rates for the fall 2009 cohort. The study followed the cohort through May 31, 2015, and highlighted six-year student outcomes, including degree and certificate completion and continuing enrollment (persistence). Completions were identified using a combination of degree/certificate award records submitted by institutions as part of their participation in DegreeVerify as well as StudentTracker enrollment records indicating completions of a certificate or degree.
Former dual enrollment students, identified as those whose postsecondary enrollment or degree record prior to fall 2009 occurred before the student turned 18 years old, represent 15.1 percent of the fall 2009 cohort. By sector, these students represent 18 percent of those who started in four-year public institutions, 14 percent of the students who started in two-year public institutions and 15 percent of those who started in four-year private nonprofit institutions. Only two percent of the students who started in four-year private for-profit institutions had prior dual enrollments. The main part of the results section discusses completion rates for the full cohort including former dual enrollment students.
1For comparison purposes, the results for non-degree seeking students who started at two-year public institutions are presented in Appendix C.
Figure 1. Fall 2009 Cohort by Starting Institution
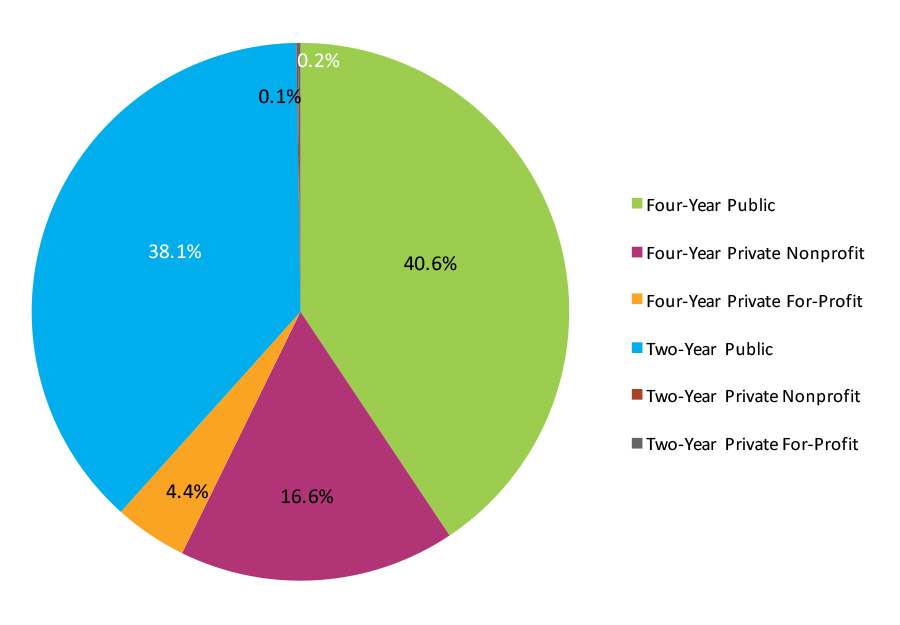
*This figure is based on data shown in Appendix C, Table 6.
Figure 1 displays the fall 2009 cohort (n=2,917,552) including former dual enrollment students broken out by type of starting institution. In the cohort, the largest percentage (40.6 percent, n=1,185,596) was enrolled in four year public institutions, followed by two‐year public institutions with 38.1 percent (n=1,111,744), and four‐year private nonprofit institutions that enrolled 16.6 percent (n=484,902) of the cohort. At 4.4 percent, four‐year private for‐profit institutions enrolled a small percentage (n=128,145) in comparison to their public counterparts. The smallest proportion of the enrollment cohort was made up of two‐year private nonprofit institutions and two‐year private for‐profit institutions, both enrolling under 0.5 percent each.
Figure 2. Fall 2009 Cohort by Age at First Entry
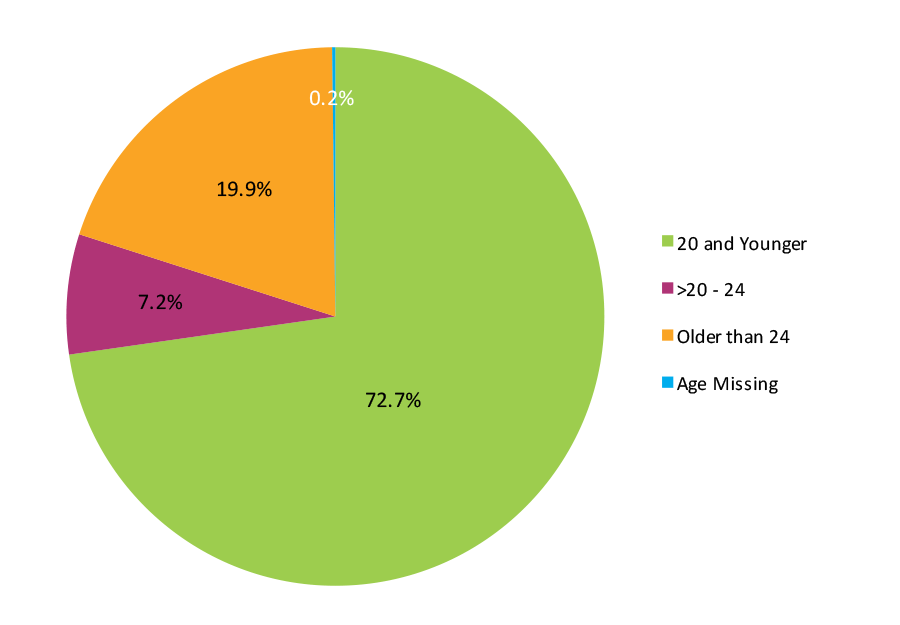
*This figure is based on data shown in Appendix C, Table 1.
Figure 2 shows students’ age in the 2009 cohort at the time of their initial enrollment. Most of the students (72.7 percent) were age 20 or younger, followed by a drop to 19.9 percent for students over age 24 at the time of first entry into college. Only 7.2 percent were between the ages of over 20 through 24, at first entry and age was missing for less than one percent of the cohort.
Figure 3. Fall 2009 Cohort by Enrollment Intensity
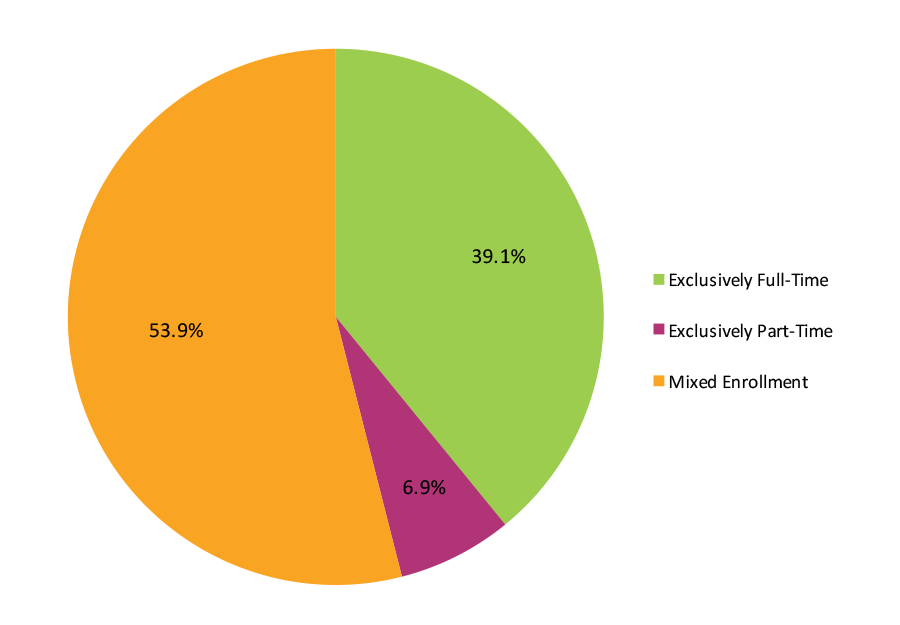
*This figure is based on data shown in Appendix C, Table 2.
Figure 3 displays to students’ enrollment intensity revealing that 39.1 percent of the study cohort enrolled exclusively full-time throughout the study period. Additionally, approximately 7.0 percent of the students enrolled exclusively part-time. “Exclusively” means during all regular terms, excluding summers, in which the student was enrolled, and thus does not preclude stop‐outs. It is important to note that over half of the cohort (53.9 percent) were mixed enrollment students; that is, they enrolled full-time for some terms and part-time for other terms during the study period (see Appendix A for further detail).
Note that this is a significantly different definition of enrollment status than the one commonly used in graduation rate studies based on IPEDS data. IPEDS cohorts are based on student enrollment status in the first fall term only. Alternatively, this report takes into consideration student enrollment status over time and across institutions, allowing for a more nuanced classification.
Figure 4. Fall 2009 Cohort by Gender
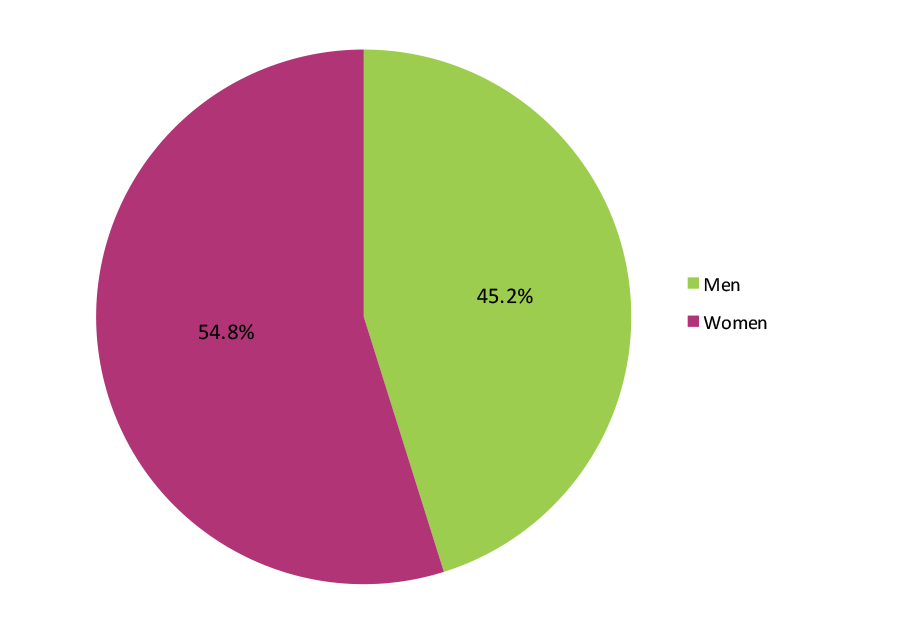
*This figure is based on data shown in Appendix C, Table 4.
The representation of men and women within the cohort is displayed in Figure 4. Similar to national figures on participation in postsecondary education, women make up more than half of the cohort, at 54.8 percent. It should be noted that these data exclude those students with missing gender data (6.51 percent of the cohort).
Table 1. Fall 2009 Cohort by Age at First Entry and Enrollment Intensity
| Age at First Entry | Enrollment Intensity | Weighted Count | Percentage of Age Group |
| 20 and Younger | Overall | 2,123,395 | 100.0 |
| Exclusively Full-Time | 895,764 | 42.2 | |
| Exclusively Part-Time | 64,408 | 3.0 | |
| Mixed Enrollment | 1,162,751 | 54.8 | |
| >20 – 24 | Overall | 208,929 | 100.0 |
| Exclusively Full-Time | 71,157 | 34.1 | |
| Exclusively Part-Time | 21,674 | 10.4 | |
| Mixed Enrollment | 115,659 | 55.4 | |
| Older than 24 | Overall | 574,182 | 100.0 |
| Exclusively Full-Time | 166,740 | 29.0 | |
| Exclusively Part-Time | 113,123 | 19.7 | |
| Mixed Enrollment | 292,190 | 50.9 | |
| Age Missing | Overall | 5,392 | 100.0 |
| Exclusively Full-Time | 2,434 | 45.1 | |
| Exclusively Part-Time | 1,350 | 25.0 | |
| Mixed Enrollment | 1,593 | 29.5 |
Table 1 represents the distribution of students in the study cohort by age at first entry and enrollment intensity. Across the three age groups, students with mixed enrollment represented the largest proportions. For students who were 20 years old or younger at first entry, 54.8 percent had mixed enrollment, 42.2 percent enrolled exclusively full-time, and the remaining 3.0 percent enrolled exclusively part-time. Students who were over 24 at first entry, also showed a large percentage (50.9 percent) of mixed enrollment. In comparison to the younger groups, a higher proportion (19.7 percent) of students who were over 24 at first entry, enrolled exclusively part-time throughout the study period.
Results
OVERALL SIX-YEAR OUTCOMES
The results highlighted in this report are six-year outcomes of degree-seeking students who enrolled in postsecondary education for the first time in fall 2009. This report emphasizes each student’s first instance of completion, presenting a national picture of college completion while taking a closer look at college outcomes for students of various age groups and enrollment intensity.
Figures 5 through 13 show six-year outcomes for the 2009 fall cohort broken out by:
- Enrollment intensity
- Gender
- Age group at first entry
- Gender and age
- Age group and enrollment intensity
- Starting institution type
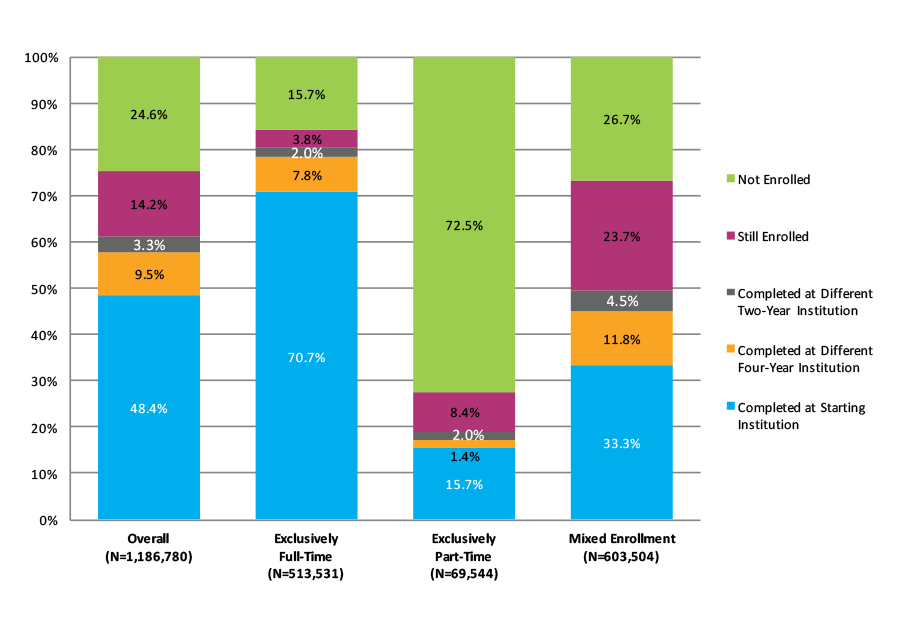
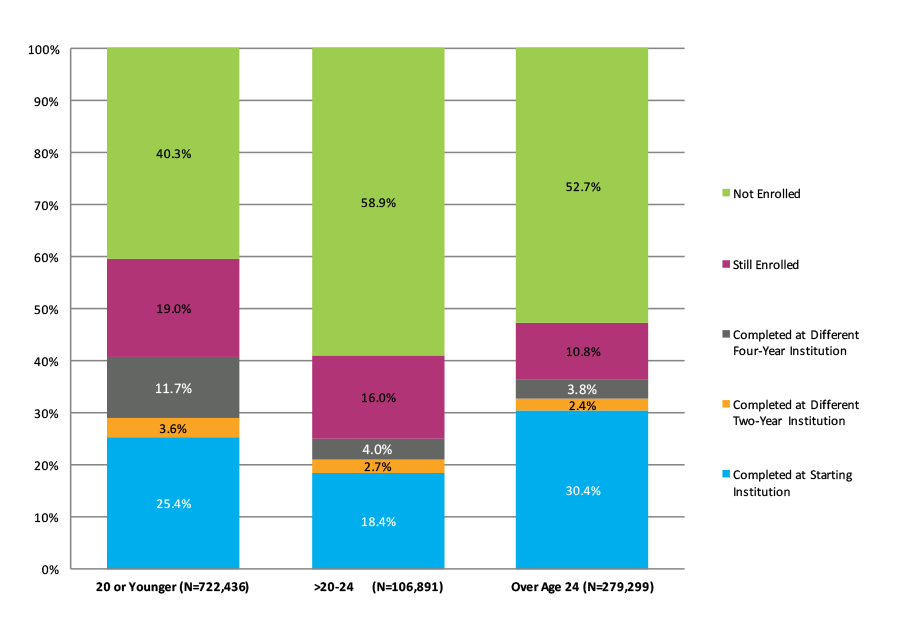
Overall, 67.0 percent of the cohort completed a degree (52.9 percent) or were still enrolled (14.1 percent) at the end of the study period. Students who enrolled exclusively full-time completed at higher rates (73.7 percent) than their exclusively part-time (19.7 percent) and mixed enrollment (42.2 percent) counterparts (Figure 5).
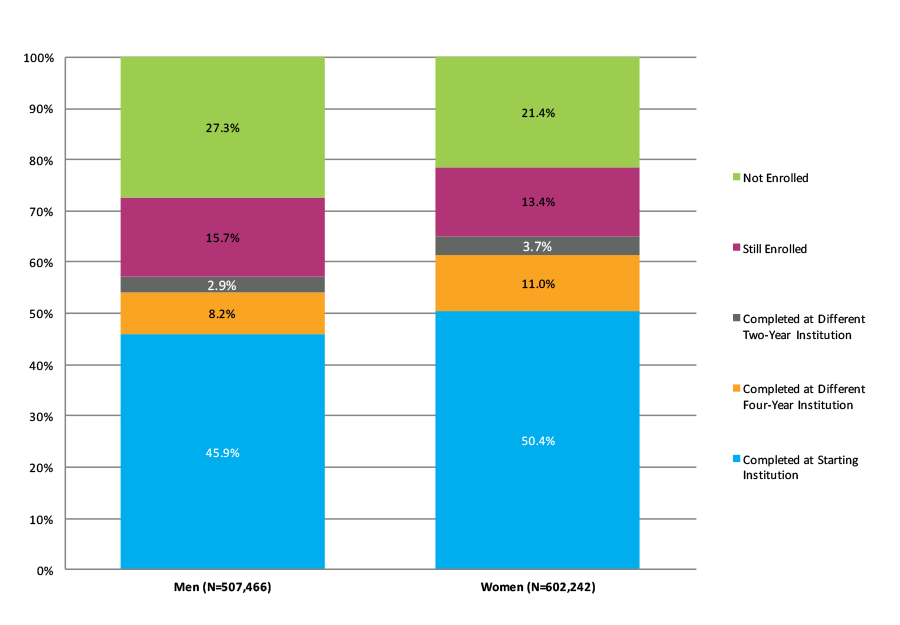
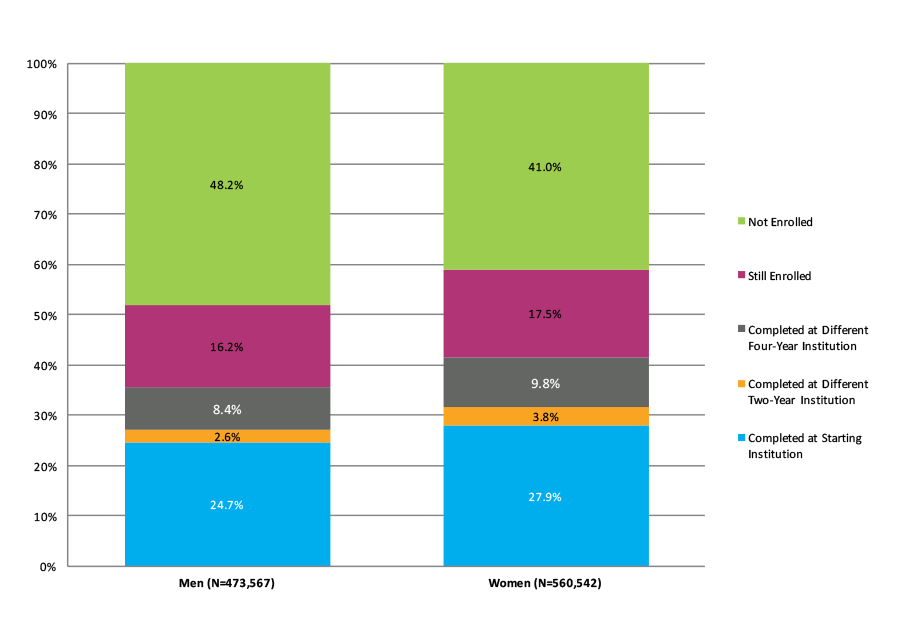
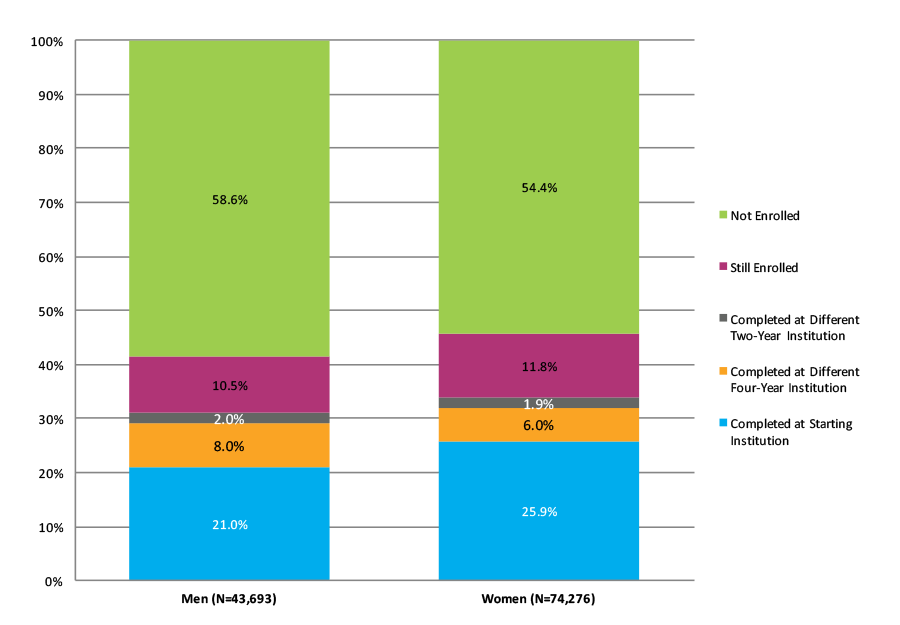
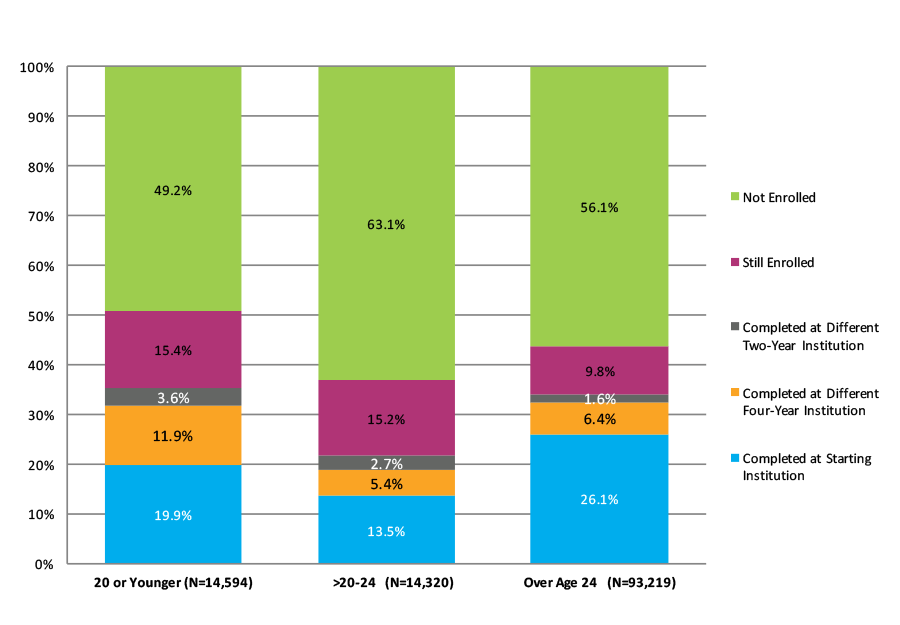
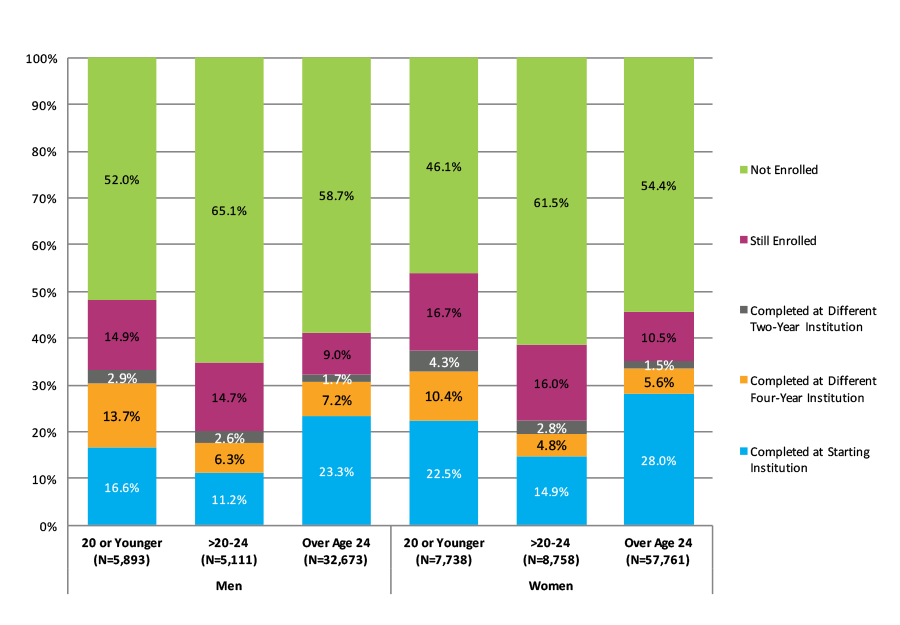
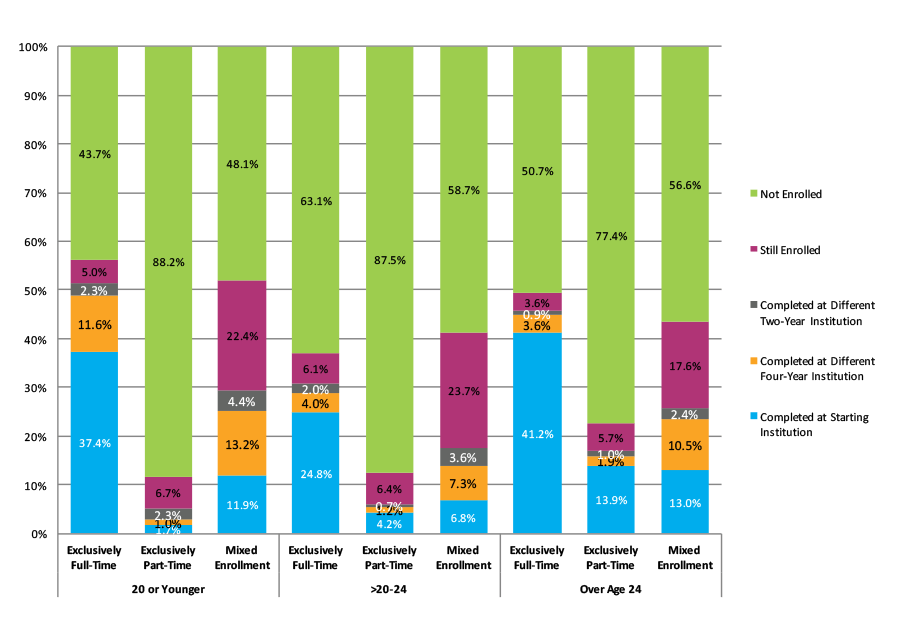
Among exclusively part-time students only 8.2 percent were still enrolled at the end of the study period. In addition, this group showed the highest proportion (72.1 percent) of students who were no longer enrolled at the end of the study period (Figure 5). The pattern stayed consistent when outcomes were disaggregated by age at first entry. More than one-third of completions by mixed enrollment students took place at an institution different from where they started (Figure 6). Overall, higher completion rates were observed among female students (56.3 percent) than male students (49.6 percent) (Figure 7). For all three age groups, exclusively part-time students showed the lowest completion rates and highest stop-out rates (Figure 11).
Figure 5. Six-Year Outcomes by Enrollment Intensity (N= 2,911,898)
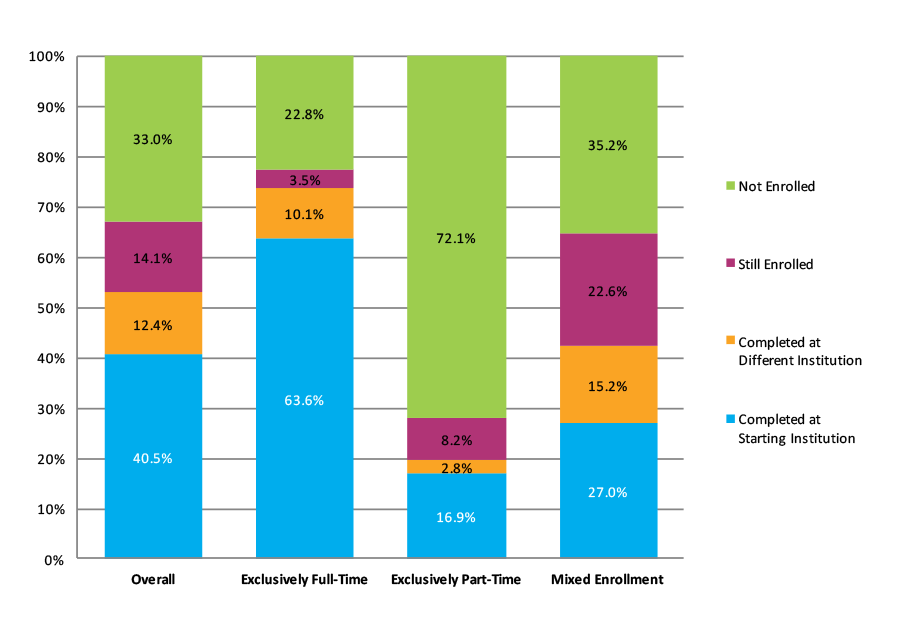
*This figure is based on data shown in Appendix C, Table 7.
Figure 6. Completion at Starting vs. Different Institution by Enrollment Intensity (N=1,539,699)
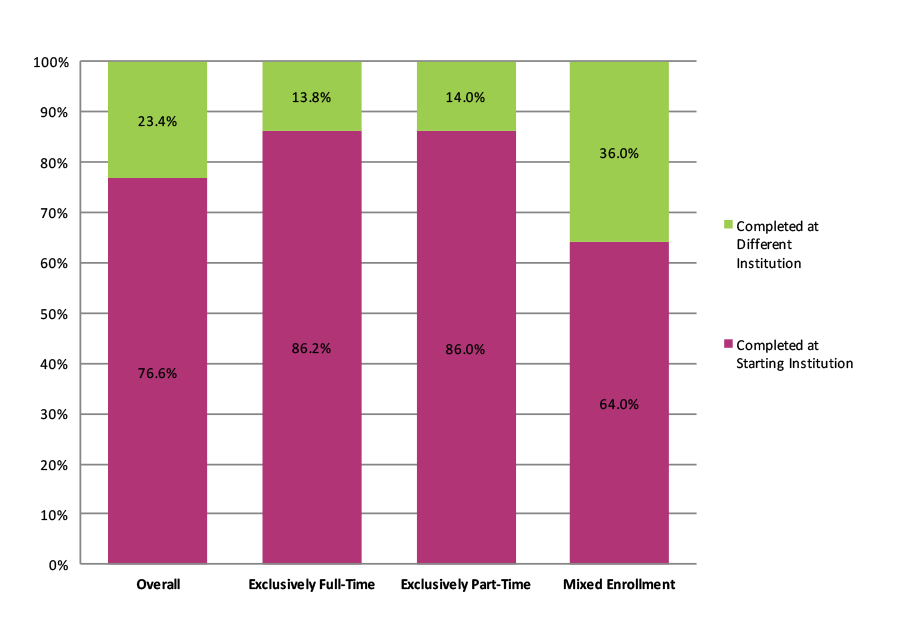
*This figure is based on data shown in Appendix C, Table 7.
Figure 7. Six-Year Outcomes by Gender (N=2,722,503)
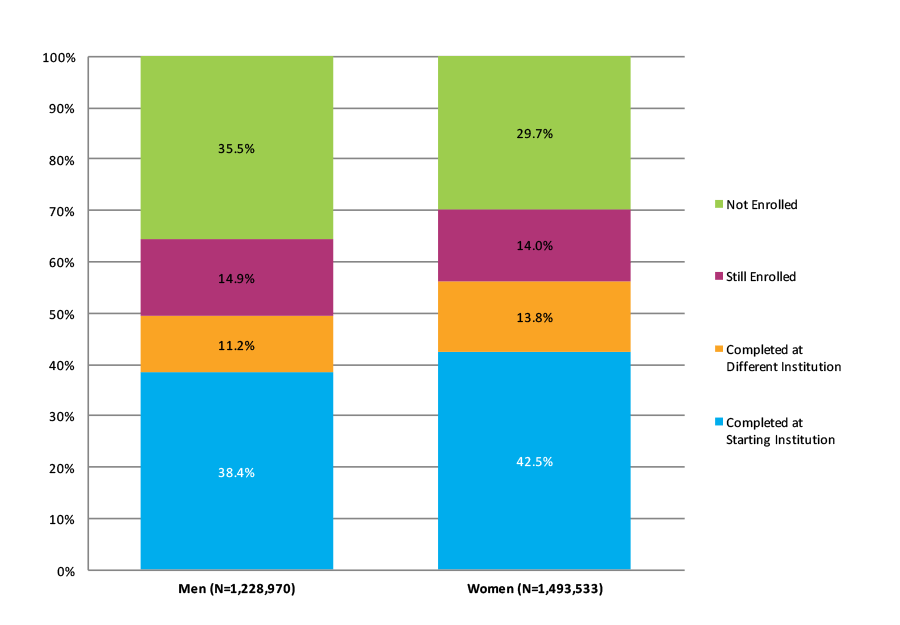
Note: Students with gender data missing were excluded from the above figure.
*This figure is based on data shown in Appendix C, Table 8.
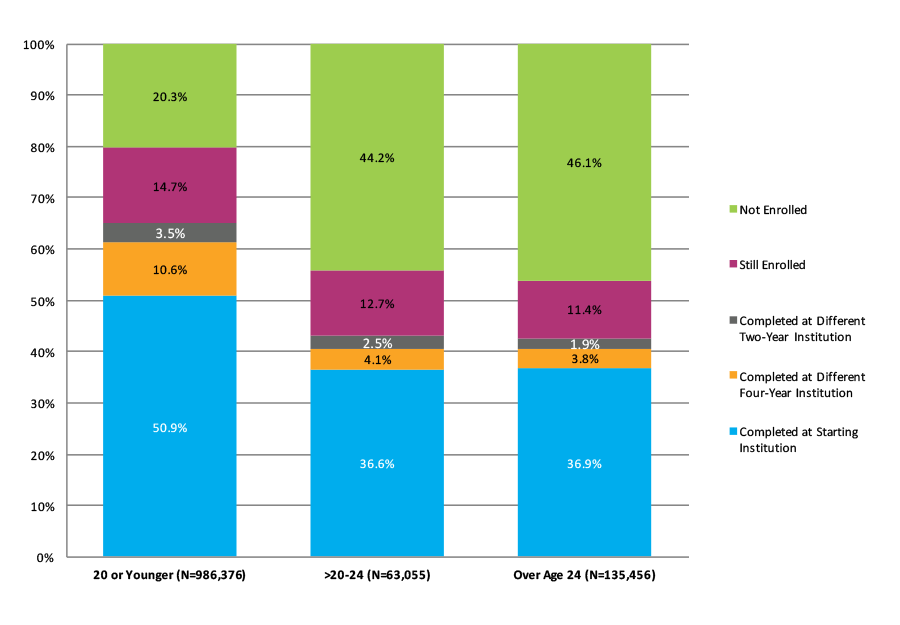
Figure 8. Six-Year Outcomes by Age at First Entry (N=2,906,506)
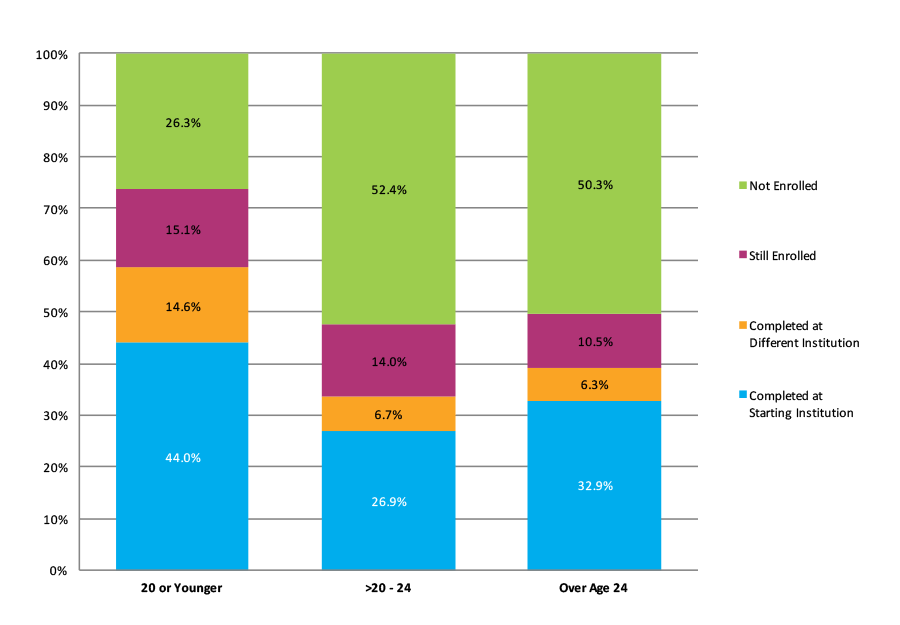
Note: Students with date of birth data missing were excluded from the above figure.
*This figure is based on data shown in Appendix C, Table 9.
Figure 9. Completion at Starting vs. Different Institution by Age at First Entry (N=1,538,665)
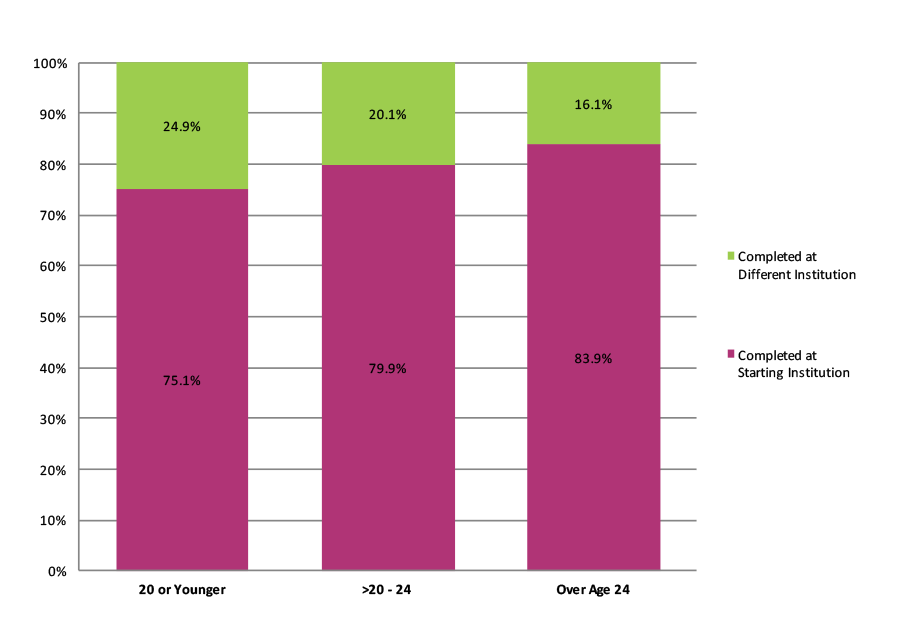
Note: Students with date of birth data missing were excluded from the above figure.
*This figure is based on data shown in Appendix C, Table 9.
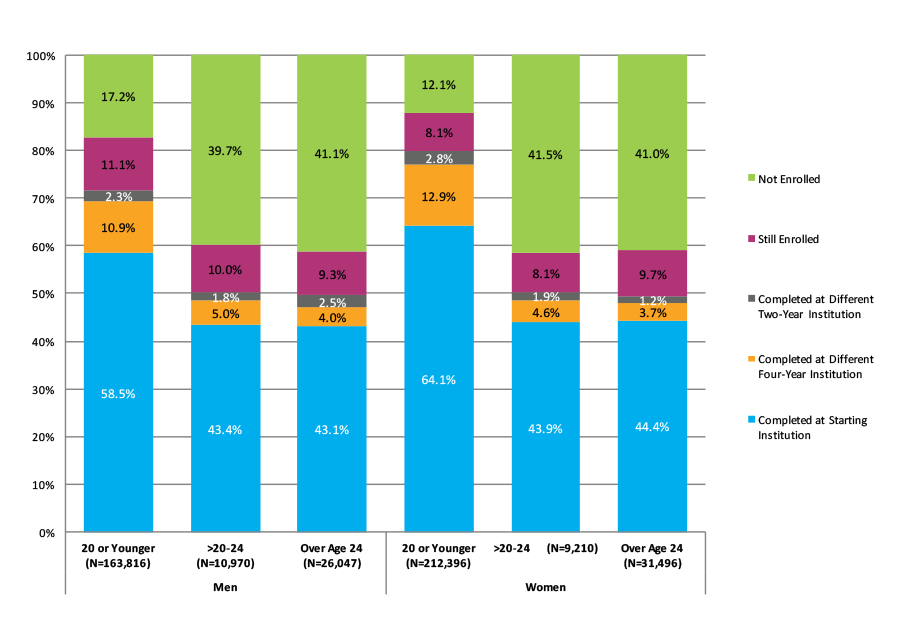
Figure 10. Six-Year Outcomes by Age at First Entry and Gender (N=2,717,923)
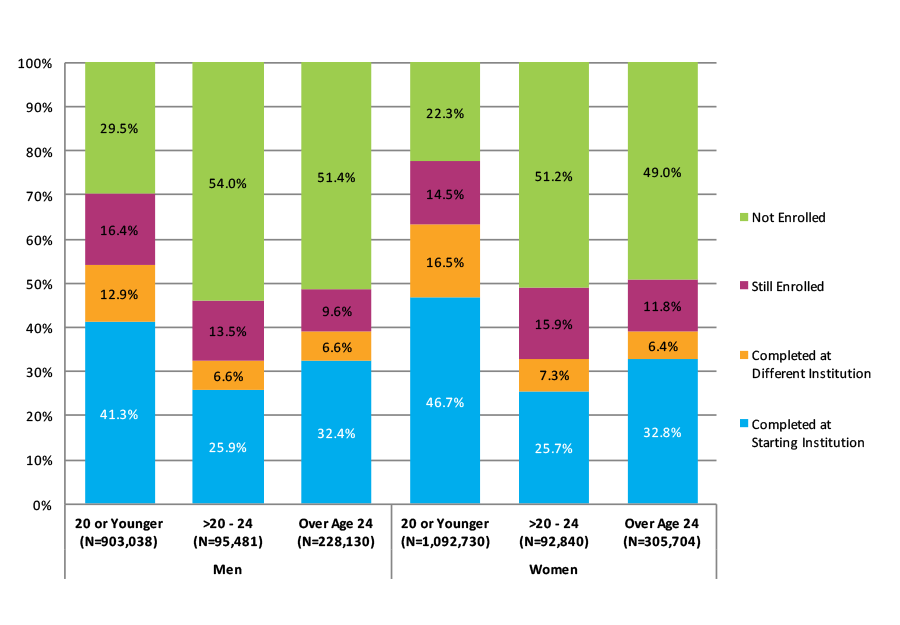
Note: Students with missing birth date and/or gender data were excluded from the above figure.
*This figure is based on data shown in Appendix C, Table 10.
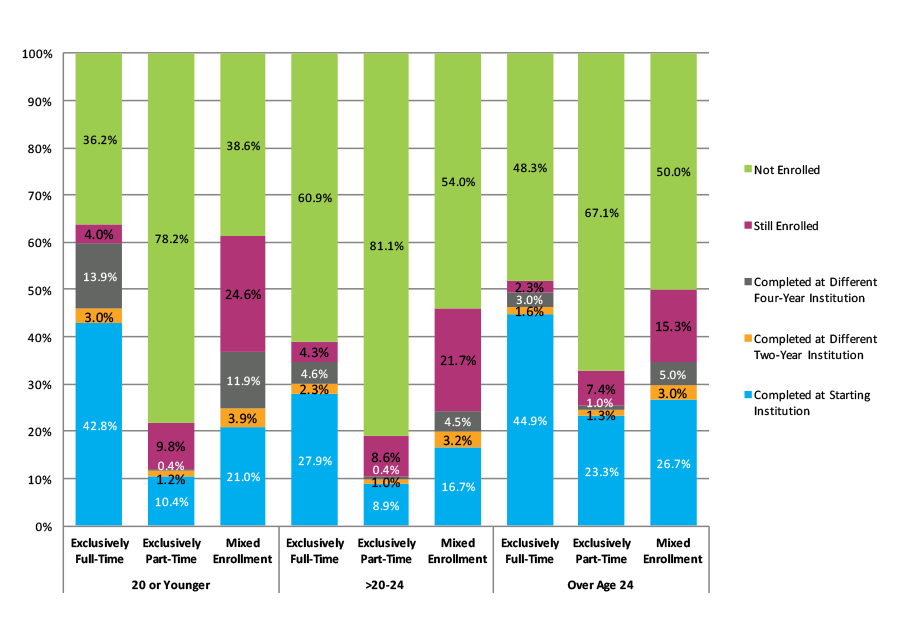
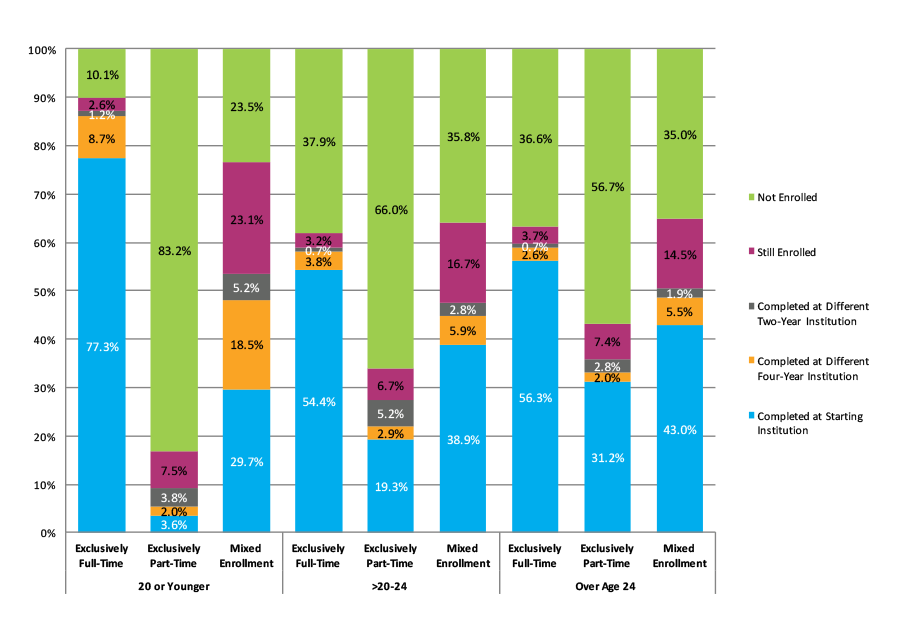
Figure 11. Six-Year Outcomes by Age and Enrollment Intensity (N=2,903,466)
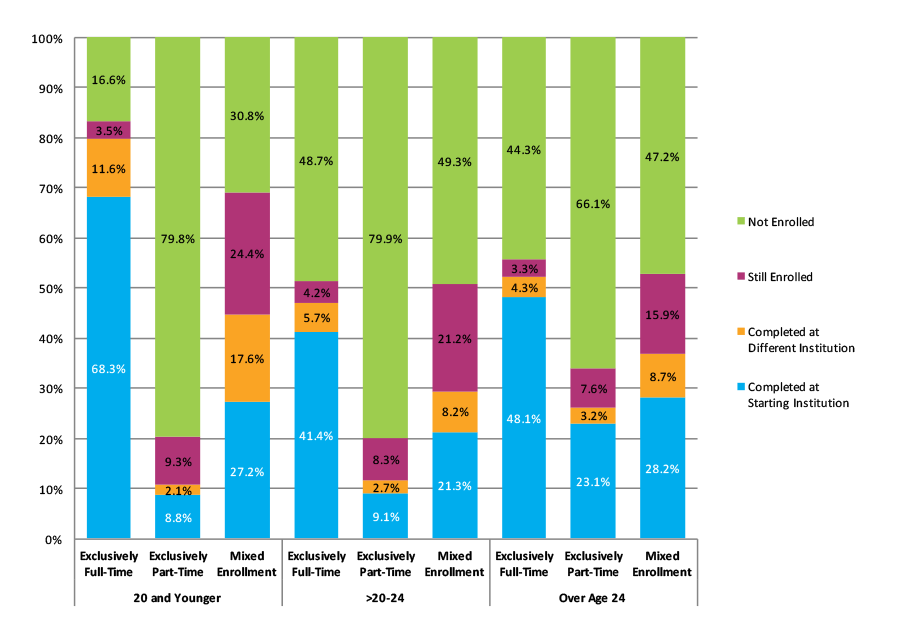
Note: Students with date of birth data missing were excluded from the above figure.
*This figure is based on data shown in Appendix C, Table 11.
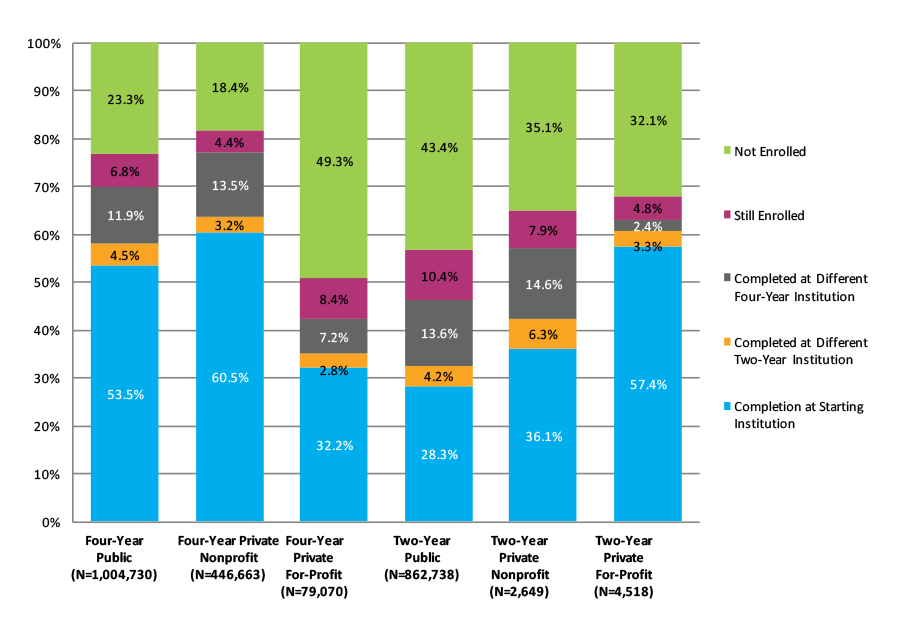
Figure 12. Six-Year Outcomes by Starting Institution Type (N=2,911,898)
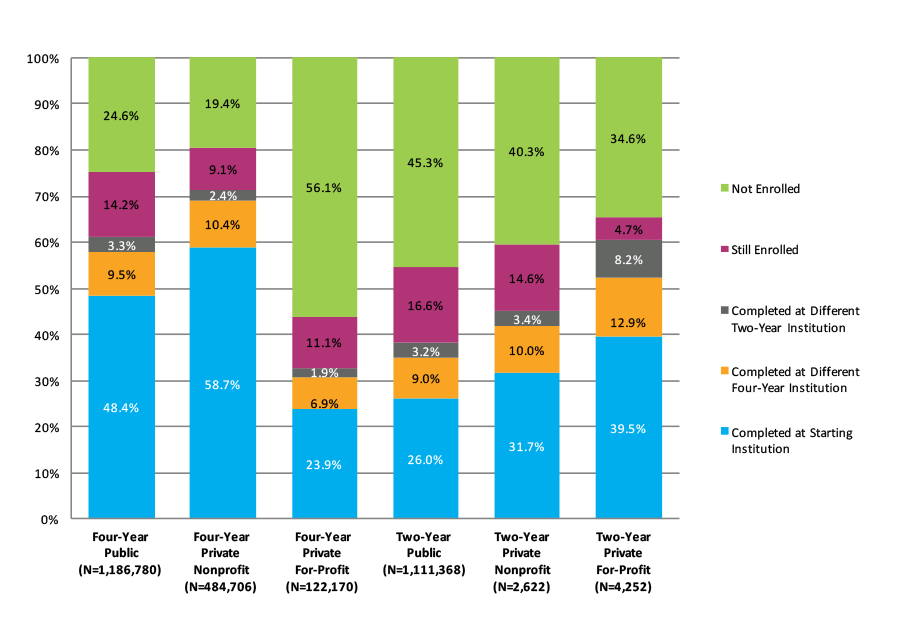
*This figure is based on data shown in Appendix C, Table 14.
Figure 13. Completion at Starting vs. Different Institution by Starting Institution Type (N=1,539,914)
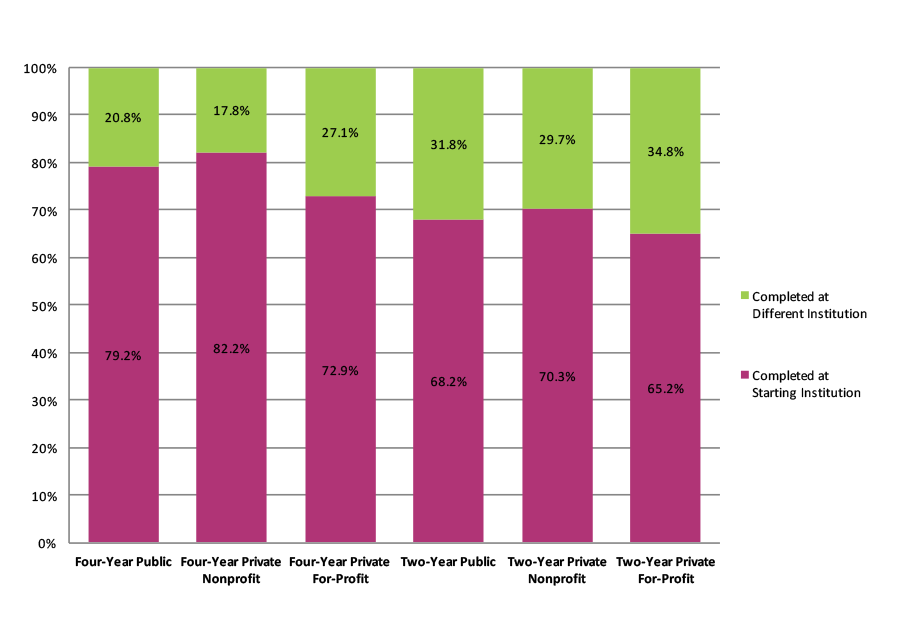
*This figure is based on data shown in Appendix C, Table 14.
STUDENTS WHO STARTED AT FOUR-YEAR PUBLIC INSTITUTIONS
Figures 14 through 18 present the six‐year outcomes of students who started at four‐year public institutions.
Overall, 61.2 percent of the cohort completed a degree within six years, a decrease of 1.6 percentage points from that of fall 2008 cohort. A higher proportion (65.0 percent) of students in the traditional-age group completed a degree, compared to well under half of students who were either over age 20 through 24 (43.2 percent) or over age 24 (42.6 percent). Mixed enrollment students had the highest proportion of students (23.7 percent) who were still enrolled at the end of the study period (Figure 14). Interestingly, the stop-out rate (44.2 percent) for students who were over age 20 through 24 at first entry, was similar to that of students who were over age 24 (46.1 percent), as shown in Figure 16. Regardless of age at first entry, part-time students had the lowest completion rates and highest stop-out rates (Figure 18).
Figure 14. Six-Year Outcomes for Students Who Started at Four-Year Public Institutions by Enrollment Intensity (N=1,186,780)
*This figure is based on data shown in Appendix C, Table 15.
Figure 15. Six-Year Outcomes for Students Who Started at Four-Year Public Institutions by Gender (N=1,109,708)
Note: Students with missing gender data were excluded from the above figure.
*This figure is based on data shown in Appendix C, Table 16.
Figure 16. Six-Year Outcomes for Students Who Started at Four-Year Public Institutions by Age at First Entry (N=1,184,886)
Note: Students with missing birth date data were excluded from the above figure.
*This figure is based on data shown in Appendix C, Table 17.
Figure 17. Six-Year Outcomes for Students Who Started at Four-Year Public Institutions by Gender and Age at First Entry (N=1,108,137)
Note: Students with missing birth date and/or gender data were excluded from the above figure.
*This figure is based on data shown in Appendix C, Table 18.
Figure 18. Six-Year Outcomes for Students Who Started at Four-Year Public Institutions by Age at First Entry and Enrollment Intensity (N=1,184,693)
Note: Students with missing birth date data were excluded from the above figure.
*This figure is based on data shown in Appendix C, Table 19.
STUDENTS WHO STARTED AT TWO-YEAR PUBLIC INSTITUTIONS
Figures 19 through 26 display the six‐year outcomes for students who started at two‐year public institutions.
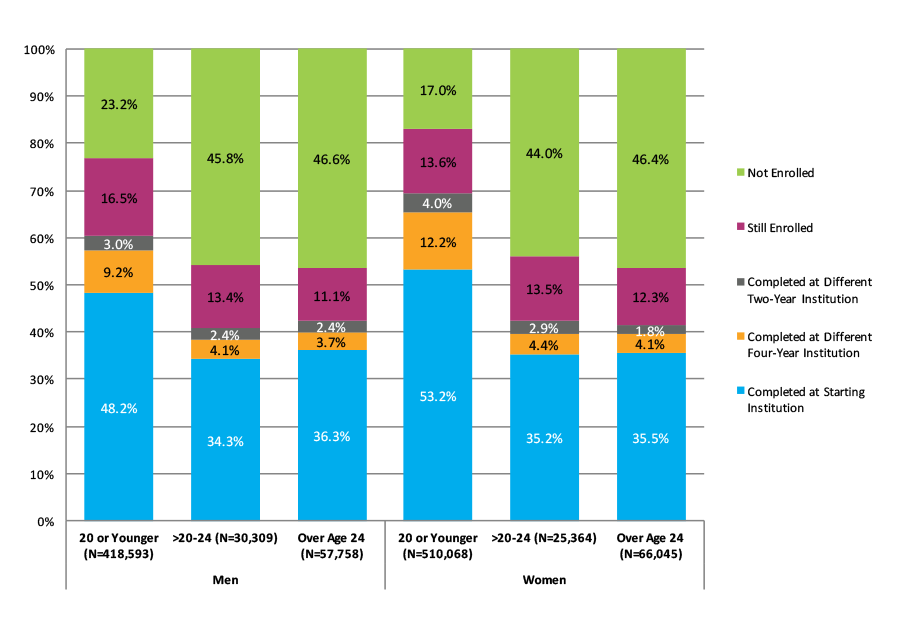
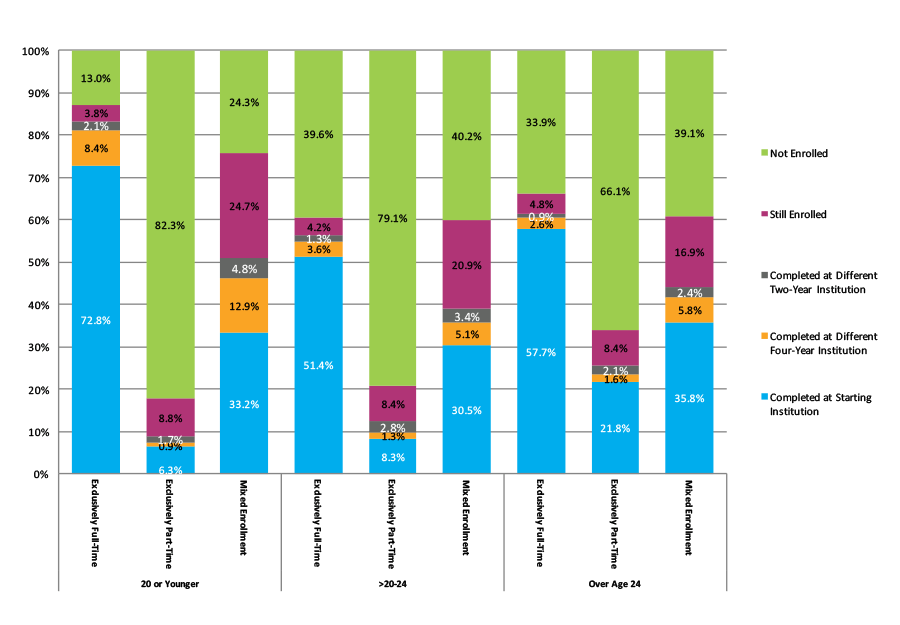
Overall, 38.2 percent of the two-year starters completed a degree or certificate within the study period. A higher proportion of students enrolled exclusively full-time completed their postsecondary education (54.6 percent), in comparison to about one-fifth of exclusively part-time students (18.3 percent) and slightly over one-third of mixed enrollment students (35.1 percent) (Figure 19). Adult learners had a total completion rate closer to that of traditional-age students (36.5 percent and 40.7 percent, respectively) than delayed entry students (25.2 percent). (Figure 22). Overall, 15.1 percent of two-year starters completed a degree at a four-year institution by the end of the study period (Figure 20). For all three age groups, the highest proportions of exclusively full-time students who completed at four year institutions had already attained a credential from a two-year institution, reiterating the important role played by two-year institutions in achieving national college completion goals (Figure 26).
Figure 19. Six-Year Outcomes and First Completion for Students Who Started at Two-Year Public Institutions by Enrollment Intensity (N=1,111,368)
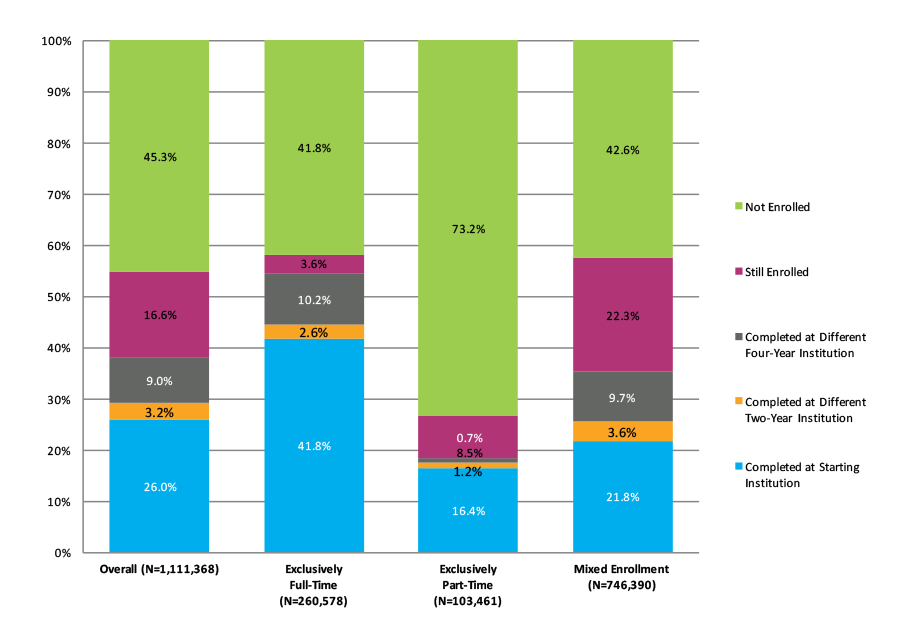
*This figure is based on data shown in Appendix C, Table 22.
Figure 20. Completion at Four-Year Institutions for Students Who Started at Two-Year Public Institutions by Enrollment Intensity (N=1,111,368)
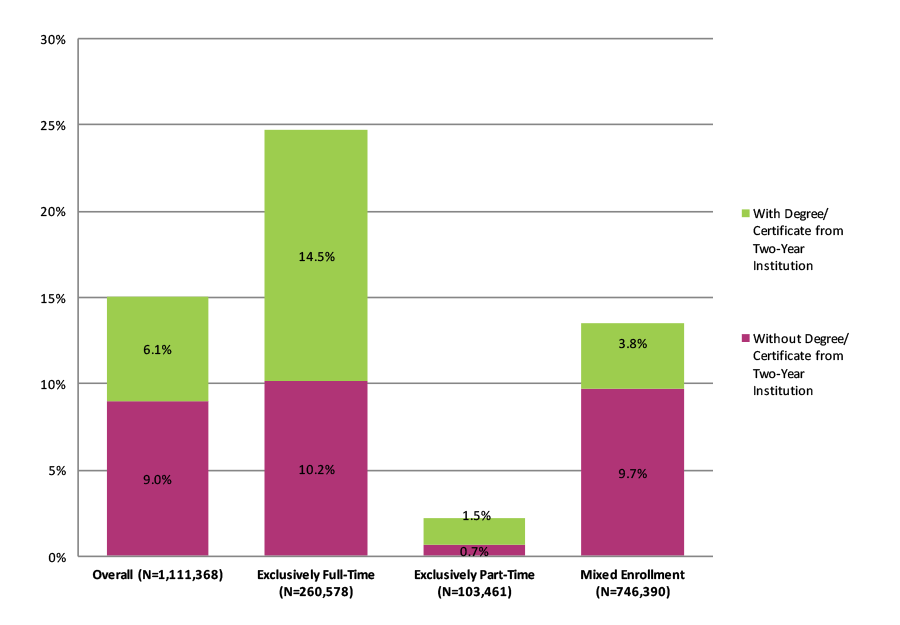
*This figure is based on data shown in Appendix C, Table 22.
Figure 21. Six-Year Outcomes and First Completion for Students Who Started at Two-Year Public Institutions by Gender (N=1,034,109)
Note: Students with missing gender data were excluded from the above figure.
*This figure is based on data shown in Appendix C, Table 23.
Figure 22. Six-Year Outcomes and First Completion for Students Who Started at Two-Year Public Institutions by Age at First Entry (N=1,108,626)
Note: Students with missing birth date data were excluded from the above figure.
*This figure is based on data shown in Appendix C, Table 24.
Figure 23. Completion at Four-Year Institutions among Students Who Started at Two-Year Public Institutions by Age at First Entry (N=1,108,626)
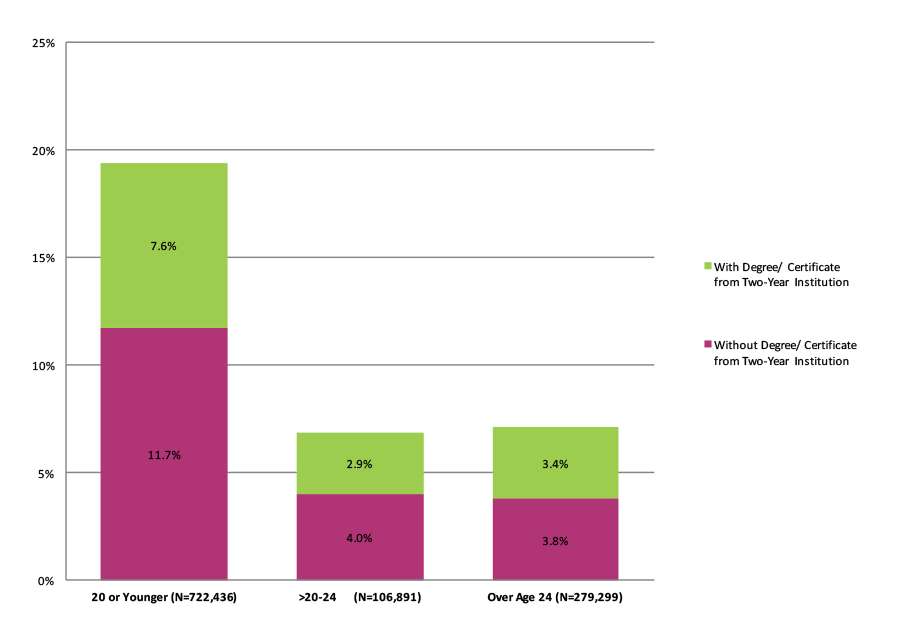
Note: Students with missing birth date data were excluded from the above figure.
*This figure is based on data shown in Appendix C, Table 24.
Figure 24. Six‐Year Outcomes and First Completion for Students Who Started at Two‐Year Public Institutions by Gender and Age at First Entry (N=1,031,787)
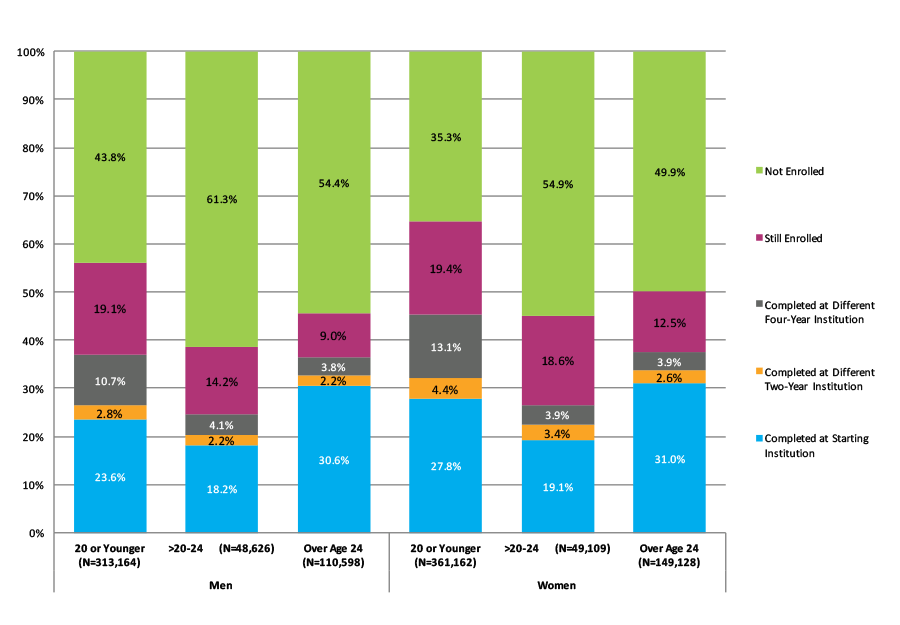
Note: Students with missing birth date and/or gender data were excluded from the above figure.
*This figure is based on data shown in Appendix C, Table 25.
Figure 25. Six-Year Outcomes and First Completion for Students Who Started at Two-Year Public Institutions by Age at First Entry and Enrollment Intensity (N=1,107,695)
Note: Students with missing birth date data were excluded from the above figure.
*This figure is based on data shown in Appendix C, Table 26.
Figure 26. Completion at Four-Year Institutions Among Students Who Started at Two-Year Public Institutions By Age at First Entry and Enrollment Intensity (N=1,107,695)
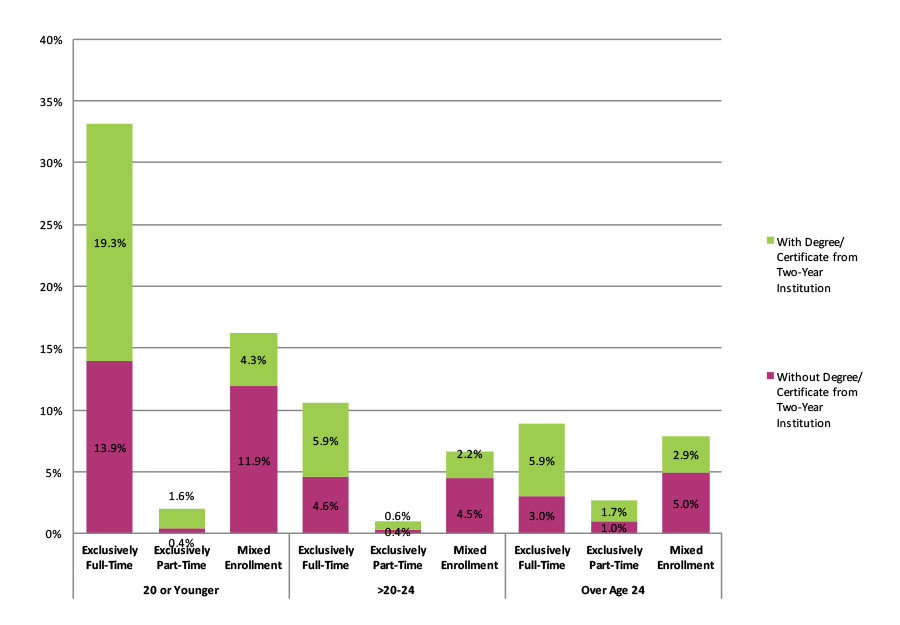
Note: Students with missing birth date data were excluded from the above figure.
*This figure is based on data shown in Appendix C, Table 26.
STUDENTS WHO STARTED AT FOUR-YEAR PRIVATE NONPROFIT INSTITUTIONS
Figures 27 through 31 show the six‐year outcomes for students who started at four‐year private nonprofit institutions.
Overall, 71.5 percent of the cohort completed with a postsecondary credential by the end of the study period, a decrease of 2.1 percentage points from that of fall 2008 cohort. (Figure 27). Women had a higher completion rate than men (74.9 and 67.6 percent, respectively), as shown in Figure 28. When completion rates were broken out by gender and age at first entry, among adult learners, men had a similar completion rate (49.6 percent) to women (49.3 percent), as shown in Figure 30. When disaggregated by age, the proportion of students who stopped out increased with each age group by the end of the study period (Figure 29). Regardless of age, the completion rates of mixed enrollment students at institutions other than the starting institution were higher compared to those of students with exclusively full-time and exclusively part-time enrollment (Figure 31).
Figure 27. Six-Year Outcomes for Students Who Started at Four-Year Private Nonprofit Institutions by Enrollment Intensity (N=484,706)
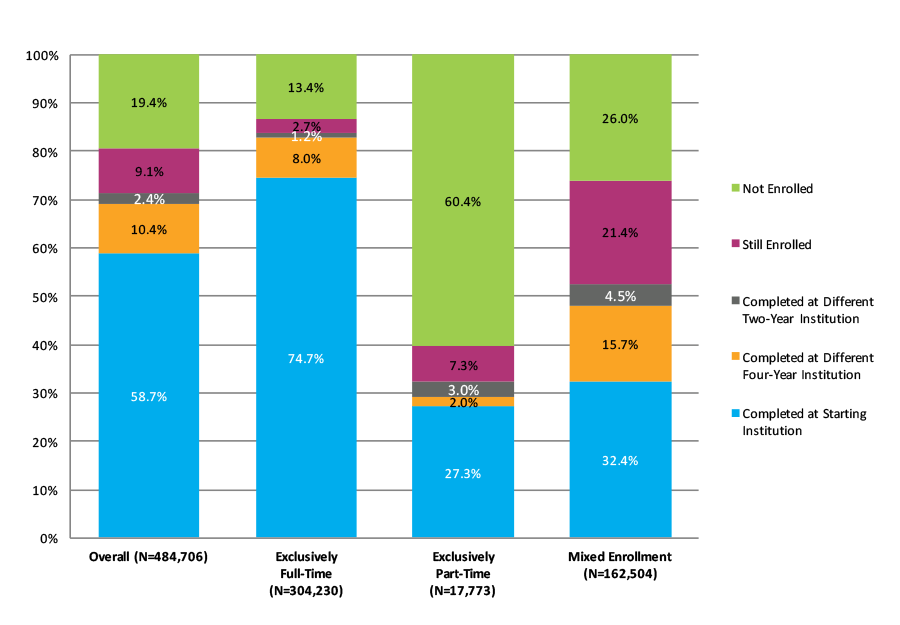
*This figure is based on data shown in Appendix C, Table 36.
Figure 28. Six-Year Outcomes for Students Who Started at Four-Year Private Nonprofit Institutions by Gender (N=454,430)
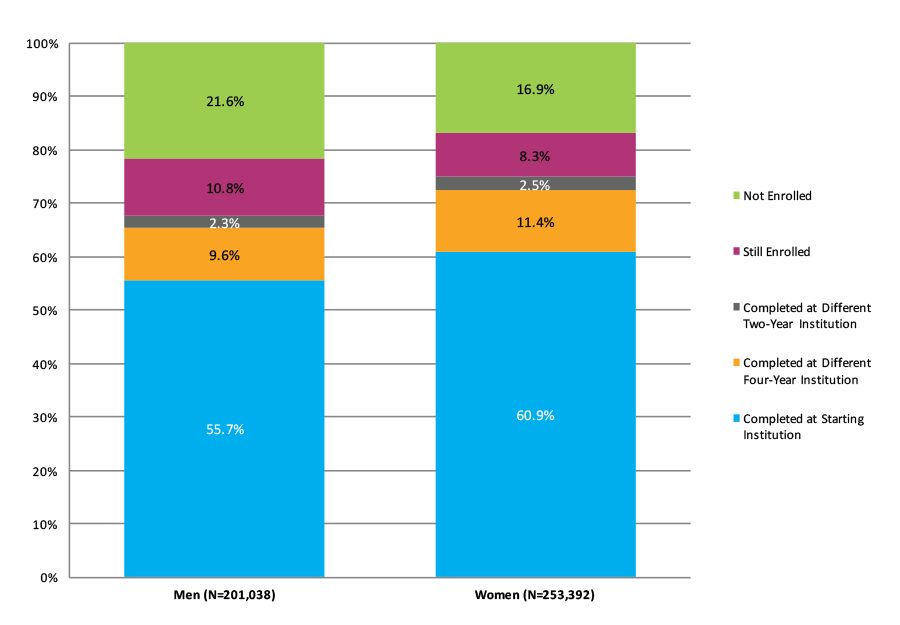
Note: Students with missing gender data were excluded from the above figure.
*This figure is based on data shown in Appendix C, Table 37.
Figure 29. Six-Year Outcomes for Students Who Started at Four-Year Private Nonprofit Institutions by Age at First Entry (N=484,137)
Note: Students with missing birth date data were excluded from the above figure.
*This figure is based on data shown in Appendix C, Table 38.
Figure 30. Six-Year Outcomes for Students Who Started at Four-Year Private Nonprofit Institutions by Gender and Age at First Entry (N=453,907)
Note: Students with missing birth date and/or gender data were excluded from the above figure.
*This figure is based on data shown in Appendix C, Table 39.
Figure 31. Six-Year Outcomes for Students Who Started at Four-Year Private Nonprofit Institutions by Age at First Entry and Enrollment Intensity (N=483,938)
Note: Students with missing birth date data were excluded from the above figure.
*This figure is based on data shown in Appendix C, Table 40.
STUDENTS WHO STARTED AT FOUR-YEAR PRIVATE FOR-PROFIT INSTITUTIONS
Figures 32 through 36 present the six‐year outcomes for students who started at four‐year private for-profit institutions.
Overall, 23.9 percent of the cohort completed at their starting institution, an additional 8.8 percent completed at a different institution, for a combined completion rate of 32.7 percent; a decrease of 5.7 percentage points from the previous year’s cohort (Figure 32). The gender gap in favor of women was the narrowest among those who started in four-year private for-profit institutions among all institutional sectors (only a 2.9 percentage point difference) (Figure 33). When disaggregated by age, students 20 years old or younger had a similar completion rate (35.4 percent) to that of adult learners (34.1 percent), as shown in Figure 34. When broken out by age and enrollment intensity, traditional-age students who enrolled exclusively full time had the highest completion rate (51.3 percent), 5.6 percentage points higher than that of adult learners who enrolled exclusively full-time (Figure 36).
Figure 32. Six-Year Outcomes for Students Who Started at Four-Year Private For-Profit Institutions by Enrollment Intensity (N=122,170)
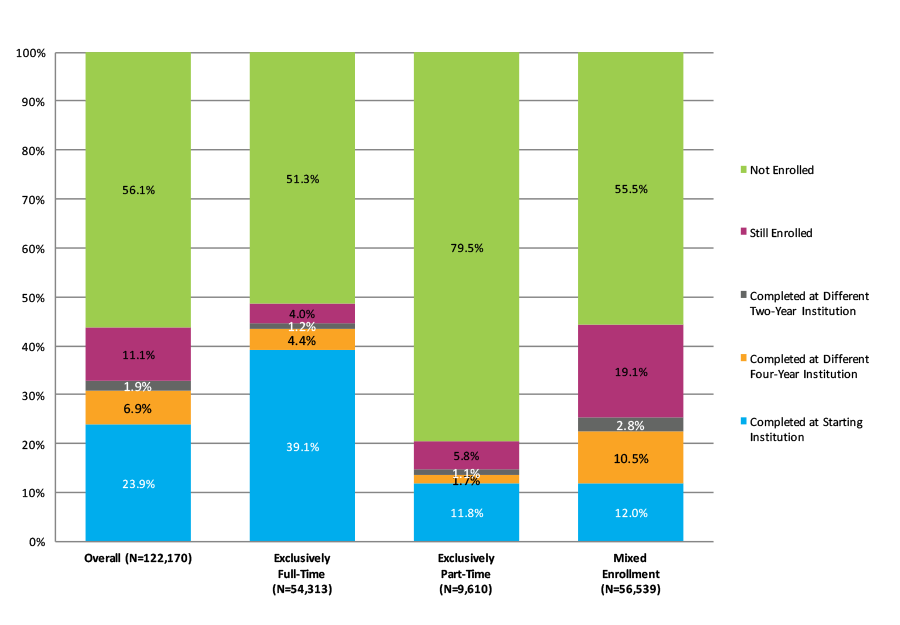
*This figure is based on data shown in Appendix C, Table 43.
Figure 33. Six-Year Outcomes for Students Who Started at Four-Year Private For-Profit Institutions by Gender (N=117,969)
Note: Students with gender data missing were excluded from the above figure.
*This figure is based on data shown in Appendix C, Table 44.
Figure 34. Six-Year Outcomes for Students Who Started at Four-Year Private For-Profit Institutions by Age at First Entry (N=122,133)
Note: Students with birth date data missing were excluded from the above figure.
*This figure is based on data shown in Appendix C, Table 45.
Figure 35. Six-Year Outcomes for Students Who Started at Four-Year Private For-Profit Institutions by Gender and Age at First Entry (N=117,935)
Note: Students with birth date data missing were excluded from the above figure.
*This figure is based on data shown in Appendix C, Table 46.
Figure 36. Six-Year Outcomes for Students Who Started at Four-Year Private For-Profit Institutions by Age at First Entry and Enrollment Intensity (N=120,425)
Note: Students with birth date data missing were excluded from the above figure.
*This figure is based on data shown in Appendix C, Table 47.
COMPLETION ACROSS STATE LINES
Figures 37 through 41 present six‐year outcomes for students who completed at institutions across state lines.
Overall, 8.6 percent of the cohort completed at a different in-state institution, 3.3 percent completed at a different out-of-state institution, and 0.6 percent completed at a different multistate institution (Figure 37). Traditional-age students who showed mixed enrollment had the highest completion rates (16.8 percent) at a different in- or out-of-state institution when comparing the results by enrollment intensity and age group (Figure 41). Women had a slightly higher completion rate at an out-of-state institution than men (3.6 percent and 3.1 percent, respectively) (Figure 38).
Exclusively part-time students showed a lower completion rate at different out-of-state institutions (1.1 percent) than students who enrolled exclusively full-time (3.2 percent) and mixed enrollment students (3.6 percent) (Figure 37). This finding alludes to the demands, interests, and mobility of part-time students, who may need to remain at one institution for the duration of their postsecondary education.
Figure 37. Completion at Different Institutions across State Lines by Enrollment Intensity
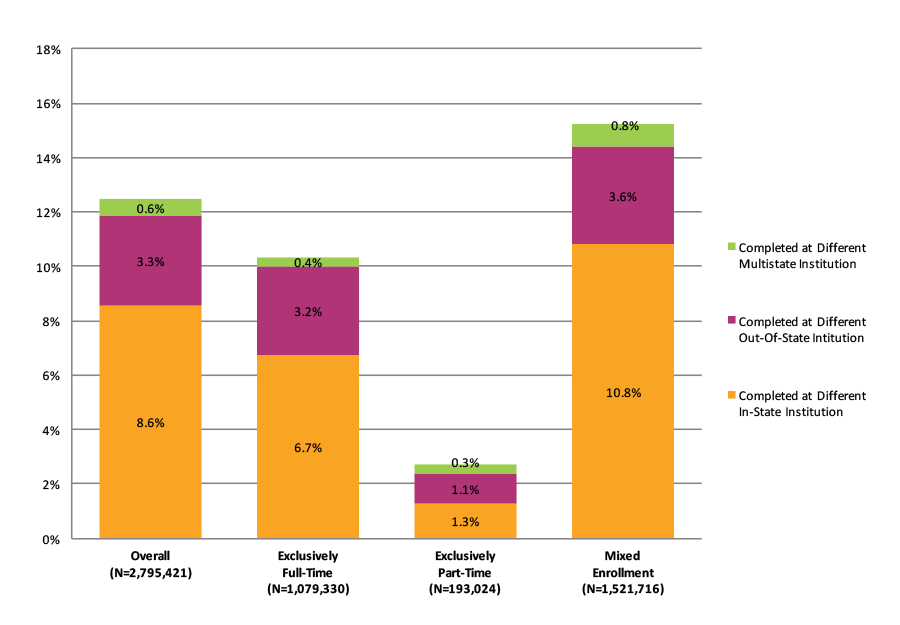
Note: Students who started at a multistate institution were excluded from the above figure.
*This figure is based on data shown in Appendix C, Table 50.
Figure 38. Completion at Different Institutions across State Lines by Gender
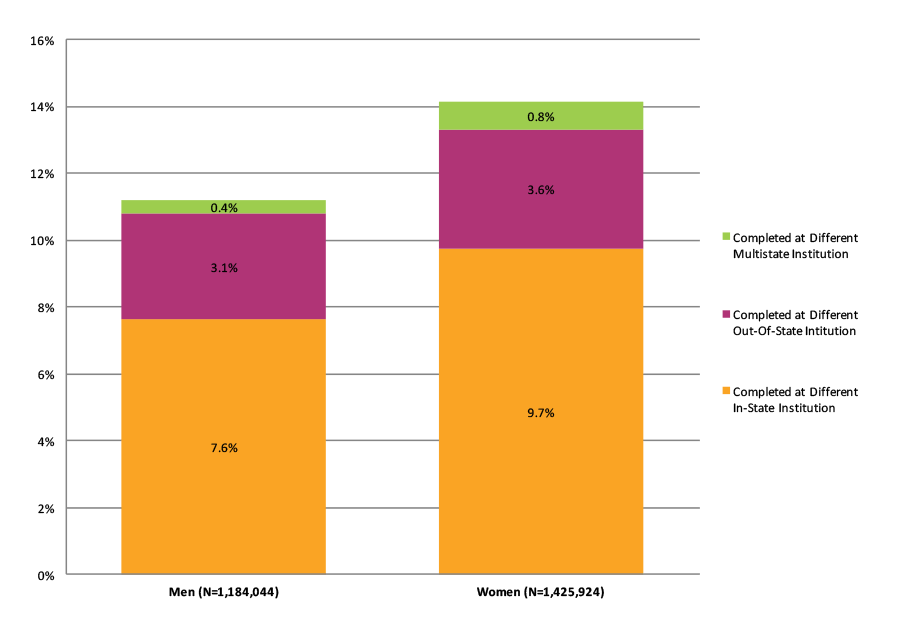
Note: Students with missing gender data missing and those who started at a multistate institution were excluded from the above figure.
*This figure is based on data shown in Appendix C, Table 51.
Figure 39. Completion at Different Institutions across State Lines by Age at First Entry
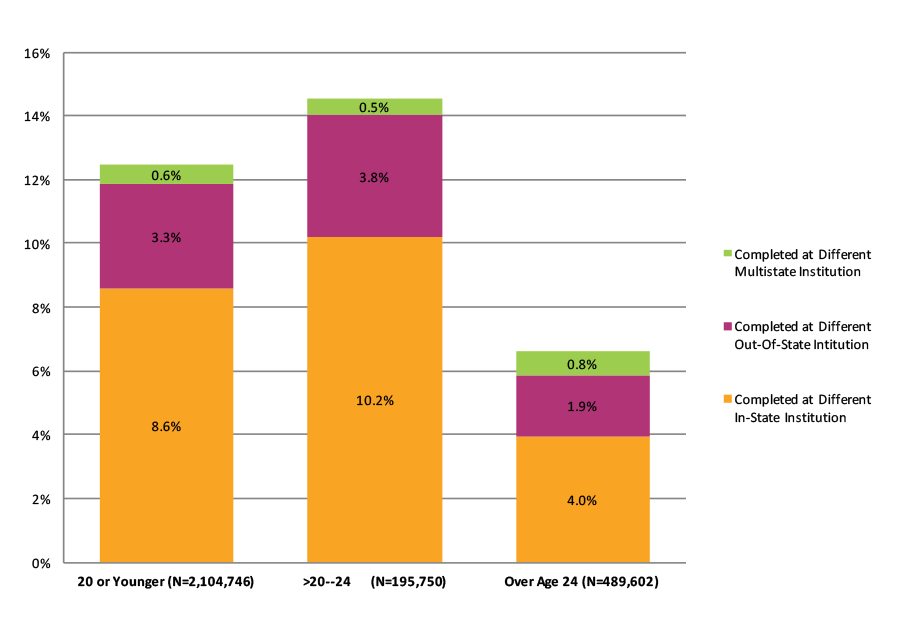
Note: Students with missing birth date data and those who started at a multistate institution were excluded from the above figure.
*This figure is based on data shown in Appendix C, Table 52.
Figure 40. Completion at Different Institutions across State Lines by Gender and Age at First Entry
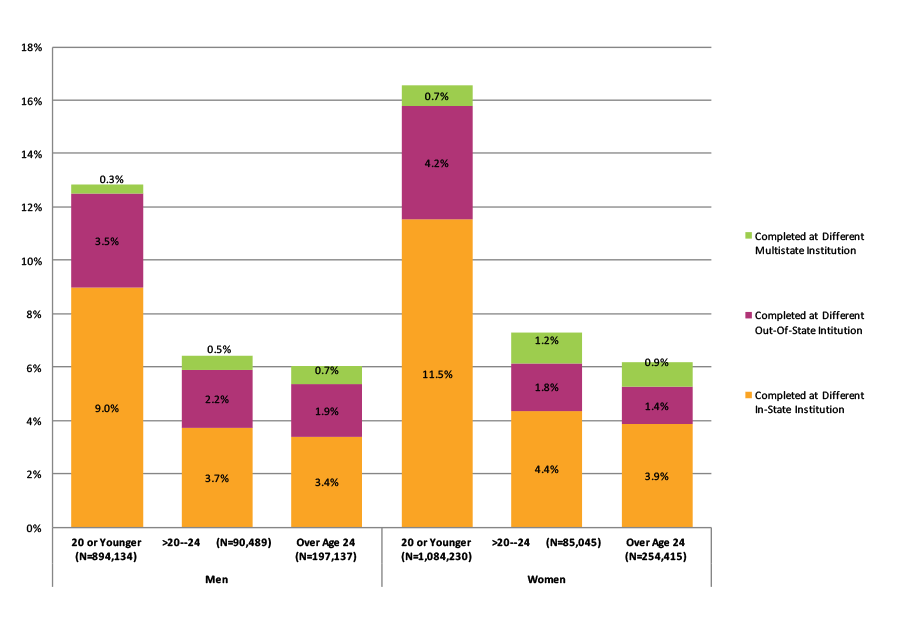
Note: Students with missing birth date and/or gender data missing and those who started at a multistate institution were excluded from the above figure.
*This figure is based on data shown in Appendix C, Table 53.
Figure 41. Completion at Different Institutions across State Lines by Age at First Entry and Enrollment Intensity
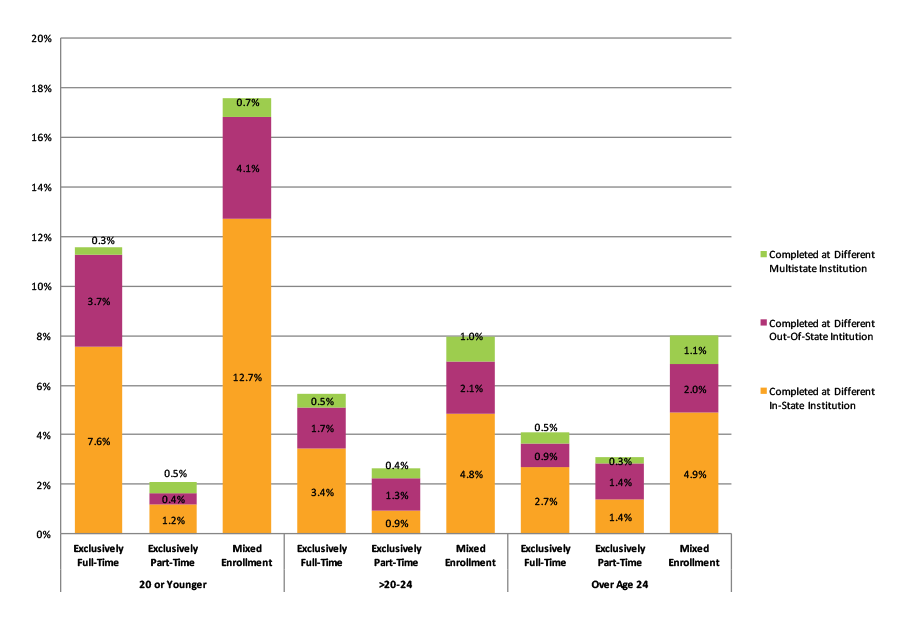
Note: Students with missing date of birth data and those who started at a multistate institution were excluded from the above figure.
*This figure is based on data shown in Appendix C, Table 54.
SUPPLEMENTAL FEATURE: EIGHT‐YEAR OUTCOMES FOR FALL 2007 COHORT
The supplemental feature highlights the findings of first‐time students who began their postsecondary education in fall 2007, the cohort at the focus of Signature Report 6, which was released in December 2013. In this part of the report, we highlight eight-year outcomes of this cohort as compared to their sixth.
OUTCOMES BY ENROLLMENT INTENSITY
Figure S-1. Eight-Year Outcomes for Fall 2007 Cohort by Enrollment Intensity
Figure S‐1 shows eight-year outcomes for the fall 2007 cohort, including first degree or certificate completion at starting or different institutions, continuing enrollment, or stop-out during the last year of the study period. Overall, 45.0 percent of the cohort completed at their starting institution and an additional 16.8 percent completed at a different institution, for a combined completion rate of 61.8 percent nationally. This represents a 5.8 percentage point increase in total completions over the six‐year rate.
The completion rate for exclusively part-time students was 20.7 percent for students who completed at their starting institutions and 4.0 percent for those who completed at a different institution, bringing their total completion rate to 24.8 percent. This is only 2.9 percentage points higher than this group’s six-year rate. The percentage of students who were still enrolled declined from 11.0 to 5.4 percent, increasing the stop-out rate from the six-year rate of 67.1 percent to 69.4 percent.
Mixed enrollment students had a completion rate of 51.8 percent, a noticeable increase in comparison to the six-year completion rate (42.2 percent). Nearly one in eight (12.8 percent) students in this group were still enrolled in the eighth year, in comparison to one in four (25.2 percent) students in the sixth year.
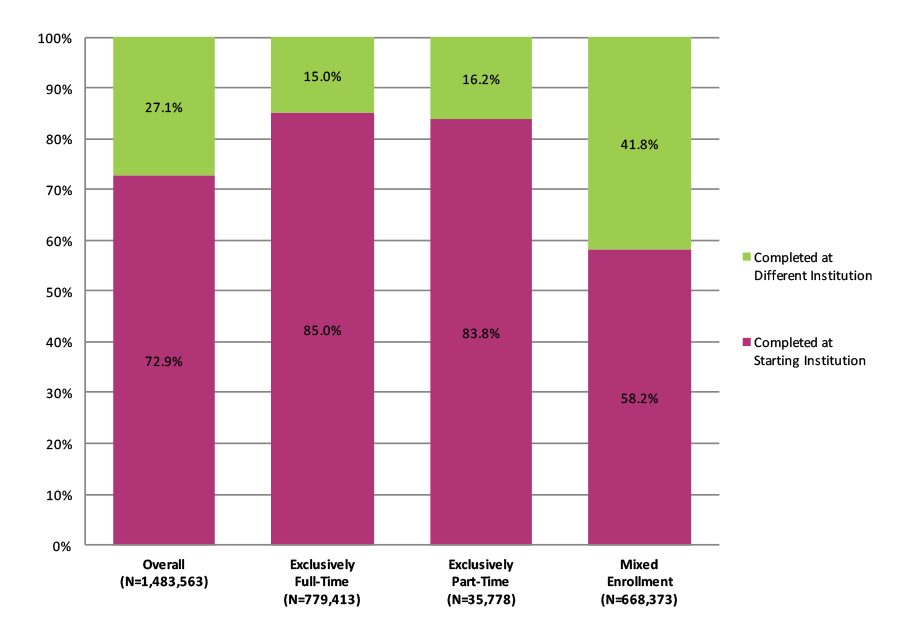
COMPLETION AT STARTING VS. DIFFERENT INSTITUTION
Figure S-2. Eight-Year Completion Outcomes at Starting vs. Different Institution by Enrollment Intensity for Fall 2007 Cohort
Figure S-2 presents the proportion of students who completed at their starting institutions versus at a different institution for each enrollment intensity group. Overall, over a quarter of students completed at an institution other than their starting institution (27.1 percent). The proportion of completions happening elsewhere in the sixth year was 23.4 percent for this cohort.
OUTCOMES BY AGE AT FIRST ENTRY
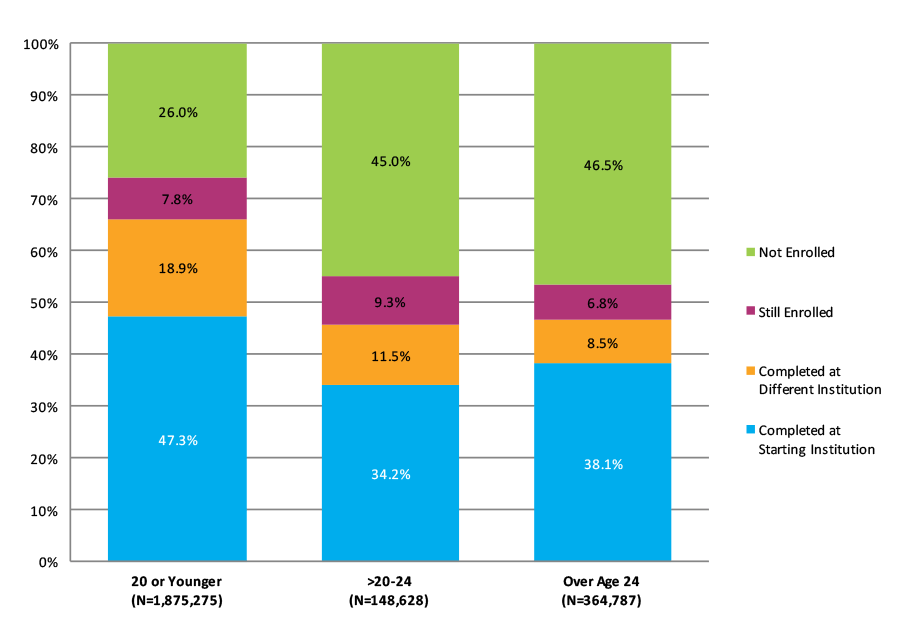
Figure S-3. Eight-Year Outcomes for Fall 2007 Cohort by Age at First Entry (N=2,388,690)
Figure S-3 demonstrates differences in eight-year completion rates for the fall cohort 2007 by age at first entry. For traditional-age students (age 20 or younger), the total eight-year completion rate was 66.2 percent, a 6.4 percentage point increase from the sixth-year rate.
Delayed entry students (over age 20 through 24) and adult learners (over age 24) showed total completion rates of 45.7 and 46.7 percent, respectively. Delayed entry students had a larger increase from the six-year rate than adult learners (by 4.8 percentage points and 3.1 percentage points, respectively).
OUTCOMES BY STARTING INSTITUTION TYPE
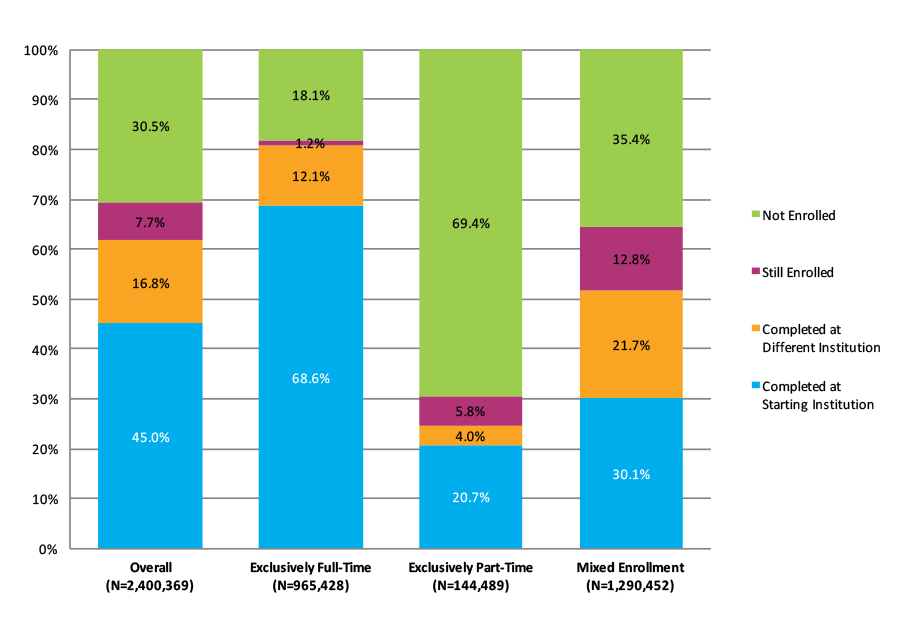
Figure S-4. Eight-Year Outcomes by Starting Institution Type (N=2,400,369)
*This figure is based on data shown in Appendix C, Table S-3.
Figures S-4 further disaggregates eight-year outcomes by the type of institution where students first enrolled.
Students who started in four-year public institutions showed an eight-year total completion rate of 69.9 percent, a gain of 6.6 percentage points over the six‐year rate. The eight-year total completion rate for students who started in two-year public institutions in 2007 was 6.3 percentage points higher than their six-year total completion rate.
Discussion of Results for the 2009 Cohort and Changes from the 2008 Cohort
In our previous national college completions report, published in November 2014, we studied the cohort of students who entered college in fall 2008. Those students started their postsecondary education at the peak of the Great Recession, and we observed its effects in the cohort’s size and composition as well as its college completion rates. Compared to fall 2007, the 2008 cohort was 12 percent larger (about 2.7 million vs. 2.4 million students), the number of older students was 20 percent higher, and the share of students enrolled less than full-time had increased 1.5 percentage points. The share of students enrolling in community colleges and four-year private for-profit institutions also increased, by about one percentage point each. Six years after starting college, the overall completions rate for the cohort had fallen one percentage point, from 56.1% to 55.0%.
The official end of the Great Recession is considered to be June 2009 (National Bureau of Economic Research, 2010). However, its effects on employment, wages, and family finances have lingered, impacting colleges and universities through 2009 and well beyond it. This year’s completions report clearly shows the continuing effects of recession on the fall 2009 cohort. The overall size was still larger: at slightly over 2.9 million, there were 8 percent more students than in fall 2008. However, there was an even higher growth in the number of older students (over age 24 at first entry): 24 percent more than in fall 2008. The share of the cohort enrolling at less than full-time status increased another half of a percentage point and the share of students enrolling in community colleges grew an additional 1.3 percentage points. The continuation of each of these trends clearly points to an expectation that completion rates would decline further as well, which is precisely what we observed.
ACCELERATION OF THE DECLINE IN OVERALL COMPLETION RATES
The overall national six-year completion rate for the fall 2009 cohort was 52.9 percent, a decline of 2.1 percentage points from the fall 2008 cohort, or twice the rate of decline that we observed in last year’s report when we compared the 2007 cohort to the 2008 cohort.
A small decrease, less than one percentage point, was also observed in the percent of students who were still enrolled in their sixth year without having earned a degree. When the two phenomena are combined, the rate at which students who were no longer enrolled in the final year of the study period increased 2.7 percentage points, from 30.3 percent for the fall 2008 cohort to 33.0 percent for the fall 2009 cohort. Thus, after six years, fully one-third of the starting cohort had stopped out or left higher education without earning a degree or certificate.
Despite the fall 2009 cohort’s lower rate of completion, the total number of graduates it produced six years later still increased (by about 71,000 students). This was because the fall 2009 cohort was much larger than that of the fall 2008. The number of students from the 2009 starting cohort who left college without a credential or continuing enrollment in the sixth year also grew, by 153,000 students.
Examining the rates by age and enrollment intensity reveals that all student populations experienced declines in their attainment rates. Thus, although the shifts in the cohort makeup clearly played a role, they are not solely responsible for the declining completion rates. Nonetheless, some groups had larger declines than others. In particular, older students and exclusively full-time students experienced some of the largest drops in completion rates.
DECLINES IN COMPLETION RATES ACROSS AGES AND ENROLLMENT INTENSITIES
The report divides students into three age groups: those who began postsecondary education immediately after high school (age 20 or younger), those who delayed entering college for a few years (over age 20 through 24), and adult learners (over age 24). Compared to the fall 2008 cohort results, the decline in completion rates was largest for the delayed entry group, which fell 4.7 percentage points (from 38.3 to 33.6 percent). Adult learners experienced a decrease of 2.9 percentage points (from 42.1 to 39.2 percent) compared to a decrease of only 0.75 percentage points for the traditional-age group (from 59.3 to 58.6 percent).
Both of the older age groups also showed declines within each of the three enrollment intensity groups. The largest declines were among exclusively full-time students, which showed decreases of 9.2 percentage points in the delayed entry group and 7.2 percentage points among adult learners. These patterns were consistent when we examined the results for men and women separately. Within each gender group, the decline in the completion rate among exclusively full-time students was larger than the declines for part-time or mixed enrollment students.
The same was also true among traditional-age students, by far the cohort’s largest age group, where the completion rate for those enrolled exclusively full time fell 1.1 percentage points, a steeper decline than for part-time or mixed enrollees.
Consistent with last year’s results, we found that students enrolling exclusively part-time had by far the lowest completions rates, but that disaggregating by both age and enrollment intensity revealed part-time enrollment to be less of a disadvantage to older students than to younger students. Exclusively part-time students over age 24 again showed a higher completion rate than did the part-time students in either of the two younger age groups. This is a reversal of the trend for full-time and mixed enrollment students for whom the younger groups consistently complete at higher rates than older students. Among exclusively part-time students, the completion rate for adult learners was more than twice as high as for delayed entry or traditional-age students (26.3 percent, 11.8 percent, and 10.9 percent, respectively). These group differences highlight the importance of targeting and differentiating efforts for improving student outcomes, whether through institutional or public policy initiatives, so that they align with the needs of different types of students.
COMPLETION RATES FOR STUDENTS WHO STARTED AT FOUR-YEAR PUBLIC INSTITUTIONS
For students who started at four-year public institutions, the completion rate for the fall 2009 cohort decreased 1.7 percentage points compared to that of fall 2008 cohort (61.2 percent and 62.9 percent). Most of this decline occurred among students who graduated from their starting institution (1.4 percentage points lower). There was only a quarter of a percentage point decline in the rate at which students transferred to complete at two-year institutions, and even less, one tenth of a point, when students transferring to complete at different four-year institutions. The magnitude of the decline in total completion rates was similar for exclusively full-time and exclusively part-time students (2.1 and 2.3 percentage points, respectively), while those who had mixed enrollments had a much smaller decline, less than one percentage point.
As was true for the cohort overall, students in the delayed entry group had the largest decline in completion rates (from 50.7 percent to 43.1 percent), followed by adult learners (from 45.9 percent to 42.6 percent). Traditional-age students in this sector, meanwhile, had a less than one percentage point decrease. Large declines in the completion rates were observed for all students in the delayed entry and adult learners groups, regardless of enrollment intensity. However, similar to the pattern in the overall cohort, the largest decline was among exclusively full-time students in both age groups.
CONTINUED DECLINE IN COMPLETION RATES FOR STUDENTS WHO STARTED AT TWO-YEAR PUBLIC INSTITUTIONS, INCLUDING COMPLETIONS AT FOUR-YEAR INSTITUTIONS
The total completion rate for two-year starters, regardless of whether the completion occurred at a two-year or four-year institution, declined one percentage point, from 39.1% for the fall 2008 cohort to 38.1% for 2009 students. The decline was almost entirely among students completing at transfer institutions (0.9 percentage point drop). The percent that completed at the same institution where they started was virtually unchanged, 26.0 (a decline of only 0.1 percentage point from the 2008 cohort). Among enrollment intensity groups, students who were exclusively full-time had the largest decline in their completion rate (54.6 percent vs. 57.0 percent).
In addition to examining the overall completion rates of students who started at two-year public institutions, we also looked specifically at their completions at four-year institutions. This rate also continued its decline, falling another percentage point for the 2009 cohort which was on top of the one-point decline for 2008 students when compared to 2007. In total, 15.1 percent of two-year starters had completed a degree at a four-year institution by the end of the study period, down from 16.2 percent for the fall 2008 cohort. This decline occurred mostly in the completion rate of students who received their degree from a four-year institution without first obtaining a two-year degree.
COMPLETION RATES AT FOUR-YEAR PRIVATE NONPROFIT INSTITUTIONS REVERSE THEIR GAINS OF PREVIOUS YEAR
The completion rate for students who started in four-year private nonprofit institutions in fall 2009 decreased 2.1 percentage points compared to the fall 2008 cohort, from 73.6 percent to 71.5 percent. This also represents a decline from the 72.1 percent rate recorded two years ago for the fall 2007 cohort, after having increased for the fall 2008 cohort. Disaggregating the results by age shows that the decline in the overall completion rate for this sector can almost exclusively be explained by the lower completion rate among older students (a decrease of 8.7 percentage points for the delayed entry group and 5.0 percentage points among adult learners). By contrast, completion rates for traditional-age students declined by 0.6 percentage points.
The size of the cohort for this sector increased 4.3 percent from fall 2008 to fall 2009. However, the increase was significantly larger among older students: the delayed entry group increased 35.3 percent and adult learners 19.3 percent. The increase in the number of traditional-age students was very small, less than one percent.
COMPLETION RATES FOR STUDENTS WHO STARTED AT FOUR-YEAR FOR-PROFIT INSTITUTIONS CONTINUE STEEP DECLINES
The dramatic decline in the six-year completion rate for those who started in four-year for-profit institutions continued for this cohort. In last year’s report, we found a 3.9 percentage point decrease for the fall 2008 cohort from that of the previous year (from 42.3 to 38.4 percent). The completion rate dropped even further this year, to 32.8 percent for the fall 2009 cohort. When the completion rate decline was combined with the small, 0.6 percentage point decline in the rate of those who were still enrolled at the end of the study period, the percentage who stopped out or dropped out without a degree or certificate increased from 49.9 percent for the fall 2008 cohort to over half of the fall 2009 cohort: 56.1 percent.
The size of the cohort for this sector continued the upward trend we observed in the previous year’s report, although at a somewhat slower rate. While the growth in the cohort from fall 2007 to fall 2008 was 35 percent, it was only 20 percent from fall 2008 to fall 2009. An examination of cohort sizes by age groups shows that most of the increase in the cohort size occurred among delayed entry students (20 percent) and adult learners (23 percent), rather than among traditional-age students (7 percent). This may partially explain the increased stop-out or drop-out rate at the end of the study period. Older students who may have chosen to enroll in college in the absence of employment opportunities may have returned to the labor market when the employment climate improved later in these students’ education.
EIGHT-YEAR OUTCOMES FOR FALL 2007 NATIONAL COHORT
We examined eight-year outcomes for the fall 2007 cohort, tracking their enrollment patterns through spring 2015. With the two extra years, a total of 45.0 percent of the 2007 cohort completed at their starting institution and an additional 16.8 percent completed at a different institution, for a combined completion rate of 61.8 percent nationally. This represents a margin of 5.8 percentage points in total completions compared to the six‐year rate. At the same time, the percentage of students who were still enrolled at the end of the eight-year period was 7.6 percentage points lower than at the six-year period (7.7 percent and 15.3 percent, respectively).
Results show that students who required the two extra years to complete their first degree were slightly more likely to do so at a different institution than at the institution where they started: the completion rate increased 2.1 percentage points at the starting institution and 3.7 percentage points at a different institution. Among students with mixed enrollment, the eight-year total completion rate showed a marked increase over the six-year completion rate for the same cohort (51.8 percent and 43.2 percent, respectively). For exclusively part-time students the eight-year completion rate was only three percentage points higher than the six-year completion rate (24.8 percent and 21.8 percent, respectively).
Examining the increases in the completion rate from six years to eight years by age revealed larger increases for traditional-age and delayed entry students than for adult learners. The eight-year completion rate had about an 11 percent increase over the six-year rate for traditional-age students, a 12 percent increase for delayed entry students, and only a 7 percent increase for adult learners.
IMPLICATIONS FOR POLICY
The results show that the Great Recession continued to affect student attainment rates even for the cohort that entered college after the nominal end of the recession. While the fall 2008 cohort reflected an increase in enrollments mostly in community colleges and for-profit institutions, the fall 2009 cohort had enrollment surges in all types of schools. As the number of high school graduates neared its peak, all institution types saw larger enrollment increases among older students than traditional-age students. Unlike the previous year’s report, however, this year we found declines not only in the overall national completion rate, but for every institution type and all student subgroups.
Nonetheless, the report continues to illustrate the value of disaggregating results for different types of students in different types of institutions. Using student-level data to do so enables a deeper understanding of the change in outcomes for the 2009 cohort, including often dramatically different attainment rates for students by gender, age, and enrollment behaviors.
This analysis should not be taken as an indication that the considerable efforts to drive improvement in student outcomes at the institutional, state, and federal levels have been ineffective. Indeed, one might easily conclude that without them the declines could have been even worse for particular types of students or institutions, given the demographic and economic forces at play. In this spirit, we hope that the report helps practitioners and policymakers alike identify where opportunities for improvement may be greatest.
This report’s findings do, however, reiterate the need for developing measures that capture the complexity of students’ postsecondary pathways. Developing new measures of student success outcomes will result in public and institutional policies that acknowledge and respond to student pathways that may involve mobility across institutional and state lines, part‐time and mixed enrollment, a gender gap that varies by age, and entry into postsecondary institutions at a variety of different ages and life circumstances.
References
Advisory Committee on Student Financial Assistance (ACSFA). (2012). Pathways to success: Integrating learning with life and work to increase national college completion (A report to the U.S. Congress and Secretary of Education). Washington, DC: Author.
Bach, S. K., Banks, M. T., Kinnick, M. K., Ricks, M. F., Stoering, J. M., & Walleri, R. D. (2000, June). Student attendance patterns and performance in an urban postsecondary environment. Research in Higher Education, 41(3), 315-330.
Barr, A., & Turner, S. E. (2013). Expanding enrollments and contracting state budgets: The effect of the great recession on higher education. Annals of the American Academy of Political & Social Science, 650(1), 168-193. doi: 10.1177/0002716213500035.
Bers, T., & Schuetz, P. (2014). Nearbies: A missing piece of the college completion conundrum. Community College Review, 42(3), 167-183.
Bill & Melinda Gates Foundation. (2015). New Initiative to Double the Number of Low-Income Students in the U.S. Who Earn a Postsecondary Degree – Retrieved http://www.gatesfoundation.org/Media-Center/Press-Releases/2008/12/New-Initiative-to-Double-the-Number-of-LowIncome-Students-in-the-US-Who-Earn-a-Postsecondary-Degree
Choy, S. P. (2002). Access and persistence: Findings from 10 years of longitudinal research on students. Washington, DC: American Council on Education.
College Board Advocacy and Policy Center. (2010). The college completion agenda: State policy guide. New York, NY: Author.
Committee on Measures of Student Success. (2011, December). Committee on Measures of Student Success: A report to Secretary of Education Arne Duncan. Washington, DC: Author.
Desmond, M. R. (2008, October 23). The coming college bubble? America’s undercapitalized independent schools could be the next industry to pop. Forbes.com.
DiPrete, T. A., & Buchmann, C. (2006). Gender-specific trends in the value of education and the emerging gender gap in college completion. Demography (1), 1.
Dougherty, K., Jones, S., Lahr, H., Natow, R., Pheatt, L., & Reddy, V. (2014). Performance Funding for Higher Education: Forms, Origins, Impacts, and Futures. Annals of the American Academy of Political & Social Science, 55. Retrieved from http://ann.sagepub.com/content/655/1/163.full.pdf+html
Dundar, A., Hossler, D., Shapiro, D., Chen, J., Martin, S., Torres, V., Zerquera, D., & Ziskin, M. (2011, July). National Postsecondary Enrollment Trends: Before, During, and After the Great Recession (Signature Report No.1). Herndon, VA: National Student Clearinghouse Research Center.
Dwyer, R. E., McCloud, L., & Hodson, R. (2012). Debt and graduation from American universities. Social Forces, 90(4), 1133-1155.
Ebersole, J. (2010). Degree completion: Responding to a national priority. Continuing Higher Education Review, 74, 23-31.
Friedel, Janice N., Zoe M. Thornton, Mark D’Amico, & Stephen G. Katsinas. (2013). Performance-based funding: The national landscape. Tuscaloosa, AL: University of Alabama, Education Policy Center. Retrieved from http://www.uaedpolicy.ua.edu/uploads/2/1/3/2/21326282/pbf_9-17_web.pdf.
Glazer, L. (2015). It’s time to make college completion the priority at community colleges. Grand Rapids Business Journal, 33(23), 8-9.
Hillman, N., Lum, T., & Hossler, D. (2008). Understanding Indiana’s reverse transfer students: A case study in institutional research. Community College Journal on Research & Practice, 39(2), 113-134.
Hillman, N. W., & Orians, E. L. (2013). Financial aid’s role in meeting state college completion goals. Education Finance and Policy, 8(3), 349-363.
Hillman, N. W., Tandberg, D. A., & Gross, J. P. K. (2014). Performance funding in higher education: Do financial incentives impact college completions? Journal of Higher Education, 85(6-), 826-857.
Hunt, P. F., Boyd, V. S., Gast, L. K., Mitchell, A., & Wilson, W. (2012). Why some students leave college during their senior year. Journal of College Student Development, 53(5), 737-742.
Horn, L. J. & Carroll, C. D. (1997, October). Confronting the odds: Students at risk and the pipeline to higher education (Statistical Analysis Report, NCES 98-094). Washington, DC: U.S. Department of Education, National Center for Education Statistics.
Jaschik, S. (2008, September 23). Mixed messages on early decision. Inside Higher Ed.
Lee, J. M., Jr., Edwards, K., Menson, R. & Rawls, A. (2011). The college completion agenda: 2011 progress report. Washington, DC: College Board Advocacy and Policy Center.
Jones, D. P. (2013). Outcomes-Based Funding: The Wave of Implementation. Washington, DC: Complete College America and National Center for Higher Education Management Systems.
Lockeman, K. S., & Pelco, L. E. (2013). The relationship between service-learning and degree completion. Michigan Journal of Community Service Learning, 20(1), 18-30.
Long, B. (2015). The financial crisis and college enrollment: How have students and their families responded. In How the Financial Crisis and Great Recession Affected Higher Education Brown J., & Hoxby, C.
Lumina Foundation for Education. (2009). Goal 2025: Lumina Foundation’s strategic plan. Indianapolis, IN: Author.
Mangan, K. (2009). High enrollments and low graduation rates challenge struggling states. Chronicle of Higher Education, 56(1), 68.1.
Moore, C., & Shulock, N. (2009). Student progress toward degree completion: Lessons from the research literature. Sacramento, CA: Institute for Higher Education Leadership and Policy.
Mullin, C. M. (2012). Transfer: An indispensable part of the community college mission. Policy Brief.
National Conference of State Legislatures. [NCSL]. 2014. Performance funding for higher education. Denver, CO: National Conference of State Legislatures. Retrieved from http://www.ncsl.org.
National Conference of State Legislatures. [NCSL]. 2015. Performance-based funding for higher education. Denver, CO: Retrieved from http://www.ncsl.org/research/education/performance-funding.aspx
Petty, T. (2014). Motivating first-generation students to academic success and college completion. College Student Journal, 48(2), 257-264.
Rutherford, A. & Rabovsky. (2014). Evaluating Impacts of Performance funding Policies on Student Outcomes in Higher Education. Annals of the American Academy of Political & Social Science, 655 (1), 185-208. doi: 10.1177/0002716214541048.
Sander, L. (2013, December 4). Lumina devotes $4-million to local efforts to speed college completion. The Chronicle of Higher Education. Retrieved from http://chronicle.com/article/Lumina-Devotes-4-Millionto/143379/.
Sandoval-Lucero, E., Maes, J. B., & Klingsmith, L. (2014). African American and Latina(o) community college students; Social capital and student success. College Student Journal, 48(3), 522-533.
Sanford, T., & Hunter, J. M. (2011). Impact of performance-funding on retention and graduation rates. Education Policy Analysis Archives, 19(33).
Shapiro, D., Dundar, A., Yuan, X., Harrell, A. & Wakhungu, P.K. (2014, November). Completing College: A National View of Student Attainment Rates – Fall 2008 Cohort (Signature Report No. 8). Herndon, VA: National Student Clearinghouse Research Center.
Supiano, B. (2009b, January 26). Student-aid experts offer advice to colleagues on weathering the recession. The Chronicle of Higher Education.
Terriquez, V. (2015). Dreams delayed: Barriers to degree completion among undocumented community college students. Journal of Ethnic & Migration Studies, 41(8), 1302-1323. doi:10.1080/1369183X.2014.
University Professional and Continuing Education Association & InsideTrack, (2012). Measuring nontraditional student success: An imperative for colleges and universities. Washington, DC: Authors.
U.S. Department of Education. (2011). Committee on Measures of Student Success: A report to Secretary of Education Arne Duncan, Washington, DC: Author. Retrieved from http://www2.ed.gov/about/bdscomm/list/acmss.html#reports.
U.S. Government Accountability Office [GOA]. (2014, December). HIGHER EDUCATION. State Funding Trends and Policies on Affordability. Retrieved from http://www.gao.gov/assets/670/667557.pdf.
Wagner, J. (2015). Hispanic minority college students at selective colleges: What matters with degree completion? Journal of Hispanic Higher Education, 1-24, DOI: 10.1177/1538192714568807.
Walters, G. (2012). It’s not so easy: The completion agenda and the states. Liberal Education, 98(1), 34-39.
Wayt, L.K. (2015). Pathways to student success: A multiple case study on four-year colleges’ organizational change in performance funding states. (Doctoral dissertation). University of Nebraska-Lincoln, Lincoln, Nebraska.
Welbeck, R., Diamond J., Mayer, A., Richburg-Hayes, L. (2014). Piecing Together the College Affordability Puzzle: Student Characteristics and Patterns of (Un)Affordability. MDRC. Retrieved from http://www.mdrc.org/publication/piecing-together-college-affordability-puzzle.
Witham, K; Chase, M; Bensimon E.M., Hanson, D & Longanecker, D. (2015) Moving the Attainment Agenda from Policy to Action, Change: The Magazine of Higher Learning, 47:4, 6-15, DOI: 10.1080/00091383.2015.1053779.
Appendix A: Methodological Notes
This report describes six-year college student success outcomes, focusing primarily on degree and certificate completion of a cohort of first-time-in-college degree-seeking students who started their postsecondary education at U.S. colleges and universities in the fall of 2009. The study follows this cohort for six years, through May 31, 2015. The results presented in the report center on student outcomes over the six-year span, including completion (i.e., receipt of any postsecondary credential by the end of the study period), persistence (i.e., having enrollment records at any postsecondary institution during the last year of the study period), and stop-out without completion (i.e., having no enrollment records at any postsecondary institution during the last year of the study period). The report mainly focuses on students’ first completion, with further distinctions drawn between completions awarded at the institution where a student first enrolled (his or her starting institution) and those awarded at an institution other than the starting institution. For students who started at a two-year public institution, this report also presents an overview of their completions at a four-year institution, either as a first completion (i.e., those who completed a four-year degree without having first earned a credential at a two-year institution2) or as a subsequent degree after a first completion awarded in the two-year sector. In addition to results on degree and certificate completion rates by enrollment intensity, age group, gender and starting institution type, the report includes results on completion across state lines, and for students who started at multistate institutions.
2Throughout this report, “two-year institution” is used broadly to designate institutions offering both associate’s degrees and less-than-two-year degrees and certificates.
NATIONAL COVERAGE OF THE DATA
The National Student Clearinghouse® (the Clearinghouse) is a unique and trusted source for higher education enrollment and degree verification. Since its creation in 1993, the participation of institutions nationwide in Clearinghouse data-collection programs has steadily increased. Currently, Clearinghouse data include more than 3,600 colleges and 96 percent of U.S. college enrollments. The Clearinghouse has a 22-year track record of providing automated student enrollment and degree verifications. Due to the Clearinghouse’s unique student-level record approach to data collection the Clearinghouse data provide opportunities for robust analysis not afforded by the more commonly used institution-level national databases.
The enrollment data used in this report provide an unduplicated headcount for the fall 2009 first-time-in-college student cohort. Clearinghouse data track enrollments nationally and are not limited by institutional and state boundaries. Moreover, because this database is comprised of student-level data, researchers can use it to link concurrent as well as consecutive enrollments of individual students at multiple institutions – a capability that distinguishes the Clearinghouse data from national databases built with institution-level data. For instance, in the National Center for Education Statistics (NCES) and the Integrated Postsecondary Education Data System (IPEDS) – one of the most widely used national data sets in postsecondary education research – concurrent enrollments remain unlinked and, therefore, are counted as representing separate individuals.
COHORT IDENTIFICATION, DATA CUT, AND DEFINITIONS
Focusing on the cohort of first-time-in-college degree-seeking students who started their postsecondary studies at U.S. colleges and universities in fall 2009, this report examines completion over a span of six years, through May 31, 2015. In order not to exclude or misrepresent the outcomes of students whose postsecondary pathways included enrollment in college preparatory summer study, the report also includes students who started their studies in summer 2009. Furthermore, to limit the cohort to first-time undergraduate students only, the study uses data from the Clearinghouse’s StudentTracker and DegreeVerify services to confirm that students included in the study (1) showed no previous college enrollment in the four years prior to June 1, 2009, and (2) had not completed a college degree prior to the first day of enrollment in fall 2009. Former dual enrollment students, first-time college students who had enrolled in college courses while still in high school, were included in the cohort for this study (see more on former dual enrollment students below).
In defining the study cohort, it was necessary to identify a coherent set of first-enrollment records that would as closely as possible represent a starting point for the fall 2009 cohort of first-time-in-college students. With this goal in mind, the researchers excluded enrollment records that were either (1) not clearly interpretable within the study’s framework and data limitations or (2) inconsistent with the experiences of first-time college enrollment that were the focus of the analysis. Students who showed concurrent enrollments (defined in this step as enrollments overlapping by at least one day) at different institutions in the fall 2009 term were therefore excluded from the study. Also excluded were students who first enrolled in postsecondary study outside the U.S. or its territories (e.g., Guam, Puerto Rico, the U.S. Virgin Islands), or who started at non-IPEDS institutions.
Because our outcome of interest was completion, we sought to focus analyses on degree-seeking students only. Consequently, we attempted to exclude non-degree-seeking, casual course takers from the cohort. For students who first enrolled in four-year institutions, non-degree-seeking students were defined as those who had only one enrollment record, with intensity of less than half-time. Students who started at two-year institutions were excluded as non-degree-seeking students if they failed to meet one of the following criteria: (1) one or more full-time enrollment before August 9, 2010 and (2) two enrollment terms with half-time status or more before December 31, 20103.
In summary, the study cohort included students who fulfilled all of the following conditions:
- Enrolled in a Title IV institution in fall 2009. This was defined as any term with a start date between August 10 and October 31, 2009, inclusive; if the institution had no term begin date during this period, then between July 13 and August 9, 2009, inclusive;
- Did not have a previous enrollment record, as shown in StudentTracker, between June 1, 2005, and May 31, 2009, unless the previous enrollment record was before the student turned 18 years old (dual enrollment);
- Did not receive any degree or certificate from a postsecondary institution prior to the first day of enrollment in fall 2009, according to Clearinghouse data, unless the award date was before the student turned 18 years old (dual enrollment);
- Enrolled at just one institution in fall 2009 (i.e., showed no overlapping multiple enrollments between July 13 and August 9, 2009 or August 10 and October 31, 2009);
- Had at least one legitimate enrollment status throughout the study period; that is, enrolled for at least one term with full-time, part-time (i.e. half-time or less than half-time), or withdrawal status4;
- Showed intent to seek a degree or certificate. That is:
- For students who started at four-year institutions, enrolled at least one term with an intensity of half-time or higher.
- For students who started at two-year institutions, either:
- Enrolled full time for at least one term before August 9, 2010, or
- Enrolled at least half time for any two terms before December 31, 2010;
3We excluded 534,275 students who began at two-year institutions, as non-degree-seeking students as a result.
4The Clearinghouse receives enrollment status data as full-time, half-time, less-than-half-time, withdrawal, or other statuses from its participating institutions
FORMER DUAL ENROLLMENT STUDENTS
The cohort used in this study includes former dual enrollment students: first-time college students who had previously taken dual enrollment courses. These are the students who enrolled in college courses prior to fall 2009 while still in high school. Enrollment records in the Clearinghouse data do not have an indicator for dual enrollment students. For this reason a proxy was used to identify this population. Students were identified as former dual enrollment students if their enrollment or degree record prior to fall 2009 was before the student turned 18 years old. Former dual enrollment students represent 15.1 percent of the fall 2009 cohort. As proportion of the sample for each sector, former dual enrollment students represent 18 percent of the students who started in four-year public institutions, 14 percent of the students who started in two-year public institutions, and 15 percent of those who started in four-year private nonprofit institutions. Only two percent of the students who started in four-year private for-profit institutions had prior dual enrollments.
ENROLLMENT INTENSITY
For this report, enrollment intensity is classified as exclusively full time throughout the study period, exclusively part time throughout the study period, or mixed enrollment (including both full-time and part-time enrollments), based on students’ enrollments across all terms through the first completion or, for non-completers, through the entire study period. In establishing students’ enrollment intensity in this way, enrollments during summer terms (defined as terms with both the start date and the end date falling between May 1 and August 31 in any given year) and short terms (defined as terms lasting less than 21 days) were excluded from consideration.
For terms in which a student showed concurrent enrollment records (i.e., records that overlapped by 30 days or more), the two highest-intensity enrollments were considered. For example, a student concurrently enrolled half time at two institutions was categorized as enrolled full time for that term. Overall, for each term under consideration (i.e., all terms except summer terms and short terms – less than 21 days – up through the first completion, or, if no completion, throughout the entire study period), the “exclusively full-time enrollment” designation was assigned to students whose enrollment showed one of three situations: (1) the enrollment record showed exclusively full-time enrollment for all terms; or (2) for terms with concurrent enrollments, the two highest-intensity enrollment records included at least one full-time enrollment; or (3) for terms with concurrent enrollments, the two highest-intensity enrollment records both reflected half-time enrollment.
The “part-time enrollment” designation was assigned to students whose enrollment for each term under consideration showed one of the two following situations: (1) the enrollment record showed exclusively half-time or less than half-time enrollment; or (2) for terms with concurrent enrollments, the two highest-intensity enrollment records included some combination of half-time and less than half-time enrollments, but no full-time enrollment, and no more than one half-time enrollment.
The category of mixed enrollment was applied to students who showed a combination of full-time and part-time enrollments across the terms under consideration. Finally, students who showed records indicating withdrawal but no full-time or part-time enrollments were randomly assigned to an enrollment intensity category.
AGE GROUP
The study focused on three age groups, namely, 20 years old or younger, between 21 and 24 years old, and older than 24 years old. The first group “20 years old or younger” is defined to approximate enrollment immediately after high school, while the second group (“between 21 and 24 years old”) is meant to represent students who delay entry into postsecondary education for a few years after finishing high school. The final category included adult learners, defined as those who were older than 24 when they began college. For all categories, we define age as of the end of the 2009 calendar year (December 31, 2009). Students with birthdates of December 31, 1989, or later were placed in the first category. Those with birthdates between December 31, 1985, and December 30, 1989, inclusive, were categorized in the second group (“between 20 and 24 years old”). Students with birthdates before December 31, 1985, were placed in the final category (“over 24 years old”).
CONCURRENT COMPLETION
For this report, we examined completion by first-time students at either two-year or four-year institutions. We defined completion as having obtained a degree or certificate at any institution within the six-year study period (i.e., by May 31, 2015). Clearinghouse data provide a unique headcount of U.S. college enrollments during each term, which allows for the tracking of individuals including those with concurrent completion. In preparing data for this report, a small number of individuals showed more than one completion awarded at multiple institutions on the same day. In these instances, a primary completion record was selected using decision rules specific to the sector of the student’s starting institution.
The first set of decision rules was applied to students with concurrent completions who started at a two-year institution:
- Concurrent Completions at Two Different Two-Year Institutions
- Same over different: Completions at the starting institution were selected over completions at other institutions.
- Random selection: If the first decision rule did not result in a single completion record being selected, then a completion record was selected at random.
- Concurrent Completions at One Two-Year Institution and One Four-Year Institution
- Two-year then four-year: The two-year degree completion was considered the first completion and the four-year degree completion was considered a subsequent completion.
- Concurrent Completions at Two or More Four-Year Institutions
- Random selection: If a student started at a two-year institution but later completed at two or more four-year institutions concurrently, then a completion record was selected at random.
The second set of decision rules was applied to students who started at four-year institutions and later showed concurrent completion records:
- Same over different: Completions at the starting institution were selected over completions at other institutions.
- Four-year over two-year: If the first decision rule did not result in the selection of a single completion record, then completions at four-year institutions were selected over those at two-year institutions.
- Random selection: If neither of the first two decision rules resulted in the selection of a single completion record, then a completion record was selected at random.
IMPUTATION OF VALUES FOR GENDER
The Clearinghouse’s coverage of student gender has increased dramatically for enrollments occurring in recent years. However, imputation of gender for the majority of enrollment records is still necessary in order to use the data for research studies using older cohorts. To meet this need, the Research Center developed an imputation process based on first names. Previously submitted name‐gender pairs throughout the Clearinghouse database are used to determine the probability of any first name being associated with either gender. To increase the accuracy of the imputation process, the Research Center also draws on name‐gender data from the Social Security Administration (SSA) and the U.S. Census Bureau.
Because the Clearinghouse collects transactional data, its data contain many more unique first names than the other sources. International students may also contribute to the large variety of first names submitted to the Clearinghouse. The imputation used only those pairs in which the name occurred in at least two instances and was associated with a single gender in at least 95 percent of the instances. The SSA and Census data sets were used to ensure that name‐gender pairs were consistent across every data set in which they occurred and to enhance the imputation process by contributing name‐gender pairs that did not occur in the Clearinghouse data.
Institutions reported student gender to the Clearinghouse for approximately 52 percent of all students included in this report. The imputation process yielded gender codes for an additional 42 percent of the cohort producing a total gender coverage rate of 94 percent.
IMPUTATION OF MISSING DATA ON GRADUATION RECORDS
The National Student Clearinghouse collects graduation information from its participating institutions via two data reporting services: Enrollment Reporting and DegreeVerify. Enrollment Reporting has higher data coverage rates, but includes only basic completion information such as graduation indicator and the date of graduation. For the fall 2009 cohort, Enrollment Reporting covered 92 percent of all the students in Title IV degree-granting institutions listed in IPEDS (including 98 percent of the students in public institutions, 93 percent in private nonprofit institutions, and 67 percent in private for-profit institutions). DegreeVerify includes enhanced information on completions, including degree title, major, level, and CIP code, but covered only 84 percent of enrollments in 2009. Institutions may participate either in Enrollment Reporting alone or in both services. Completions data for this report included information drawn from either service. An analysis conducted by the Clearinghouse on the 2009 cohort found that graduation data for the institutions that participated in DegreeVerify were relatively more complete for some of the years covered in this study than those for institutions that participated only in Enrollment Reporting, biasing completion rates slightly downwards for institutional sectors with lower participation rates in DegreeVerify.
In order to correct for this bias the Research Center conducted a randomized imputation procedure for missing graduation data among students at non-DegreeVerify institutions who were no longer enrolled, but for whom outcome data were missing (that is, for whom the institution had reported neither a graduation nor a withdrawal status in their Enrollment Reporting). This involved comparing the Enrollment Reporting and DegreeVerify records for institutions that participated in both services and estimating, for each institution type, the average percentage of students with missing outcomes in the enrollment data who had a reported graduation in the DegreeVerify data. We further specified these underreporting rates by taking into account student age and the academic year. We then used random assignment of graduation outcomes to students with missing data at the institutions that did not participate in DegreeVerify in order to match each institution’s underreporting rate for each student age group and for every year of the study to the average rate for similar students at institutions of the same type that did participate in DegreeVerify.
This imputation was performed only for students with missing outcomes data at institutions that did not participate in DegreeVerify. It is based on the typical underreporting of graduation outcomes from similar institutions that participate in both Enrollment Reporting and DegreeVerify. The table below shows, for each institution type, the percentage of the starting cohort for whom graduation data were imputed:
| Institution Type |
Percentage of the Starting Cohort with an Imputed Completion |
| Two-Year Private For-Profit | 0.64% |
| Two-Year Private Nonprofit | 0.90% |
| Two-Year Public | 0.45% |
| Four-Year Private For-Profit | 0.26% |
| Four-Year Private Nonprofit | 0.49% |
| Four-Year Public | 0.21% |
| Total | 0.35% |
IMPUTATION OF MISSING DATA THROUGH WEIGHTING BY STATE AND INSTITUTION TYPE
The institutions participating in the Clearinghouse Enrollment Reporting service (i.e., providing the data coverage) is not 100 percent of all institutions for any individual year. Therefore, in order to account for possibilities of not capturing a student’s enrollment outcome due to non-coverage of Clearinghouse data, the analysis weights were calculated using 2014 coverage rate of the sector, control, and state of the institution where a student was enrolled for the last enrollment record. Last enrollment record was defined based on the first completion (for completers) or the last enrollment record either before stop-out (for students who had no enrollment records during the last year of the study) or before the end of the study period (for persisters). For students who completed a degree at the starting institution or were still enrolled at the starting institution by the end of the study period, a weight=1 was applied. For all other students, two weights were created and applied in this study:
For students who completed a degree or were still enrolled at a different institution by the end of the study period, a “transfer” weight was applied. The transfer weight used was an over-weight based on the coverage of the sector, control, and state of the institution in which the student was enrolled for the last enrollment record, as calculated by the formula provided below:

For students who stopped out by the end of the study period, a “missing” weight was applied. The missing weight used was an under-weight based on the coverage of the sector, control, and state of the institution in which the student was enrolled for the last enrollment record, as calculated by the formula provided below:

DATA LIMITATIONS
The data limitations in this report center mainly on the data coverage, the methods used for cohort identification, and the definition of key constructs, as outlined above.
The representation of private for-profit institutions in the StudentTracker data is lower than that of other institution types, with 67 percent coverage for four-year private for-profit institutions in fall 2009 compared to 93 percent and 98 percent respectively for four-year private nonprofit institutions and four-year public institutions. Despite the challenges presented by low participation in the early years covered in this report, current Clearinghouse data nevertheless offer near-census national coverage, representing more than 96 percent of U.S. postsecondary enrollments. In an effort to correct for coverage gaps, in this study, data were weighted, as explained above.
Data limitations resulting from the cohort identification methods used in preparing this report also should be noted. Because the Clearinghouse data on designations for class year are incomplete, the researchers identified first-time undergraduate students via two indirect measures:
- No previous college enrollments recorded in StudentTracker going back four years, and
- No previous degree awarded in the Clearinghouse’s historical DegreeVerify database.
Given these selection criteria, the sample for this report may include students who had more than 30 Advanced Placement (AP), International Baccalaureate (IB), or dual enrollment credits (students who are included in this study’s sample as first-time students but in fall 2009 they were enrolled in college courses while still in high school) and who would not be considered first-time students despite having first-time status. Moreover, because of inconsistencies in the historical depth of DegreeVerify database records, it is possible that a small number of graduate students are also included in the study cohort.
Finally, although Clearinghouse data contain some demographic information on students, historical coverage rates for the demographic data elements are uneven. Consequently, the results summarized in this report do not break enrollments out by race/ethnicity and results on gender are based partially on imputed values, as described above.