

Completing College – National – 2018
This seventh annual report on national college completion rates offers a look at the six-year outcomes for students who began postsecondary education in fall 2012. It looks at the various pathways students took toward degree completion, as well as the completion rates through Spring 2018 for the different groups of students who followed each pathway.
Suggested Citation: Shapiro, D., Dundar, A., Huie, F., Wakhungu, P.K., Bhimdiwala, A. & Wilson, S. E. (2018, December). Completing College: A National View of Student Completion Rates – Fall 2012 Cohort (Signature Report No. 16). Herndon, VA: National Student Clearinghouse Research Center.
Table of Contents
-
Students Who Started at Four-Year Private Non-profit Institutions
-
Students Who Started at Four-Year Private For-Profit Institutions
-
Appendix B: Coverage Tables
-
Appendix C: Results Tables
List of Figures
Figure 1. Fall 2012 Cohort By Starting Institution Type (N=2,269,618)*
Figure 2. Longitudinal Changes in Completion Rate
Figure 4.Six-Year Outcomes by Starting Institution Type (N=2,259,497)*
Figure 6. Six-Year Outcomes by Race and Ethnicity (N=1,661,399)*
Figure 7. Six-Year Outcomes by Age at First Entry (N=2,250,152)*
Figure 8. Six-Year Outcomes by Race and Ethnicity and Gender (N=1,599,059)*
Figure 9. Six-Year Outcomes for Students Who Started at Four-Year Public Institutions (N=1,016,340)*
About This Report
AUTHORS
National Student Clearinghouse Research Center
- Doug Shapiro
- Afet Dundar
- Faye Huie
Project on Academic Success, Indiana University
- Phoebe Khasiala Wakhungu
- Ayesha Bhimdiwala
- Sean Eric Wilson
ACKNOWLEDGEMENTS
The authors gratefully acknowledge the contributions of Victor Borden, director of Project on Academic Success (PAS) and Professor of Higher Education and Student Affairs at Indiana University at Indiana University Bloomington, for his comments and suggestions that were extremely helpful toward development of this report. We would also like to acknowledge Diana Gillum, the team member of the National Student Clearinghouse Research Center, for her work to make the Clearinghouse data analysis ready. Of course, any remaining errors or omissions are solely the responsibility of the authors.
Executive Summary
This seventh annual report on national college completion rates offers a look at the six-year outcomes for students who began postsecondary education in fall 2012. It looks at the various pathways students took toward degree completion, as well as the completion rates through Spring 2018 for the different groups of students who followed each pathway.
Major Findings and Implications
Steady Increase in Four-year and Two-year Completion Rates
The completion rate grew across the board for both two-year and four-year institutions combined, regardless of student gender, race and ethnicity, or age. Specifically, the overall national six-year completion rate for the fall 2012 cohort, regardless of starting institution type and enrollment intensity, was 58.3 percent, an increase of 1.5 percentage points from the fall 2011 cohort. Although the completion rate also grew for all students regardless of enrollment intensity, the rate for exclusively full-time, four year public starters was particularly notable, where it reached 83.6 percent. The completion rate for two year starters increased 1.7 percentage points to 39.4 percent whereas the rate for four-year starters increased 1.1 percentage points to 67.8 percent. The longitudinal trend for four-year publics was especially notable, where there was a 5 percentage point increase in overall completion rate, from 60.6 percent for the 2006 cohort to 65.7 percent for the 2012 cohort.
Despite Persistent Completion Gap, Strong Gains for Black and Hispanic Students
Notable increases in the overall completion rate for black and Hispanic students who started at four-year public institutions were observed. The completion rate increased by 1.6 percentage points to 47.6 percent for black students and 1.7 percentage points to 57.4 percent for Hispanic students. These increases surpassed the growth observed for Asian and white students, whose completion rate grew approximately one percentage point from the fall 2011 to fall 2012 cohort. Similar gains were observed for black students who started at two-year public institutions. Although black students continue to have the lowest two-year completion rate at 27.5 percent, their overall completion rate grew by 1.6 percentage points.
Although these gains are promising, Asian and white students continue to have much higher completion rates than black and Hispanic students, regardless of the level or sector of the starting institution. These gaps persist regardless of whether students complete the credential at a starting or transfer institution. In fact, the gaps in same-institution completion rates widen even further when completions at a different institution are taken into account. Asian and white students are more likely to complete a credential at a different institution (12.0 percent and 13.5 percent, respectively) than black and Hispanic students (10.3 percent and 10.5 percent, respectively).
Increases in Completion Rates at Four-Year Institutions for Students Who Started at Two-Year Public Institutions
Overall, 15.8 percent of two-year starters had completed a degree at a four-year institution by the end of the study period, with or without first earning a degree at a two-year institution. This rate reflects a 1.1 percentage point increase from the previous year’s cohort.
Increases in Completions at the Starting Institution
Completions at the same institution increased regardless of the institutional level. In total, 46.9 percent of all completions occurred at the starting institution, representing a 1.5 percentage point increase from the last 2011 cohort. This growth was observed for both two year (1.4 percentage point increase to 27.9 percent) and four year (1.3 percentage point increase to 56.4 percent) institutions, which not only reflects the continuing shift towards a more traditional student population, but perhaps more importantly, the improving student retention and advising methods of post-secondary institutions.
Implications
National completion rates across all types of institutions continue to rise. Although the rate of increase was not as steep as the increase we observed in previous year’s report, the 1.5 percentage point climb to over 58 percent overall completion represents the highest rate since the start of this report series with the fall 2006 cohort. In addition to this overall increase, other interesting patterns emerged with significant implications.
One notable finding is that the black and Hispanic student completion rate experienced a strong increase, surpassing the increase observed for Asian and white students, especially for four-year starters. Although white and Asian students continue to complete a post-secondary credential at higher rates than black and Hispanic students, these gains are promising. Both two-year and four-year institutions should continue to engage in and design programs to address the minority achievement gap. With our unique ability to track student outcomes outside of the starting institution, the National Student Clearinghouse Research Center will continue to contribute to efforts to close the achievement gap by providing benchmarking measures that go above and beyond traditional measures of completion.
Several findings indicate the transition towards a more traditional post-secondary student population as well as the growing effectiveness of student retention efforts at both four-year and two-year institutions. Specifically, more two-year starters subsequently completed a four-year credential and overall, more students completed a credential at the starting institution in the 2012 cohort than the previous 2011 cohort. This indicates that institutions have become better able to meet student academic goals and expectations, which ultimately result in stronger retention and completion outcomes.
What to Find in This Report
This report examines the rate of completion of postsecondary certificates and degrees by first-time-in-college degree-seeking students who initially enrolled in two- and four-year colleges and universities (public, private nonprofit, or private for-profit) nationwide in fall 2012. It tracks their enrollment behaviors and outcomes for six years, through spring 2018. The study cohort includes former dual enrollment students (first-time college students in fall 2012 who had previously taken college courses while still in high school) and excludes current dual enrollment students (who first took college courses while still in high school in fall 2012).
Measures of Completion and Progress
Six-year outcomes provided in this report include completions at students’ starting institutions, completions at transfer institutions, and continued enrollment (for non-completers) through the end of the study period. While the report emphasizes students’ first completion, it also examines subsequent completions at four-year institutions for students whose first credential was awarded by a two-year institution. Six-year postsecondary outcomes are presented by students’ age at first entry into college, gender, race and ethnicity and the level and control of the institution where they first enrolled. Results are also presented for students in three categories of enrollment intensity: (1) exclusively full-time enrollment, (2) exclusively part-time enrollment, and (3) enrollments showing both full- and part-time terms during the six years examined (mixed enrollment).
A Note on the Data
Data Source
The data for this report were drawn from the enrollment and degree data held by the National Student Clearinghouse® (the Clearinghouse), which tracks 96.8 percent of college enrollments nationwide across all postsecondary institutions, including all institution types: two-year and four-year institutions, public and private institutions, and nonprofit and for-profit institutions. To ensure accuracy in representation of student outcomes for study cohorts, results reported here are weighted according to the formula described in Appendix A using the state-by-state coverage rate for each institution type (sector and control). A complete explanation of national coverage rates and the weights used to ensure that results reflect enrollment and completion by sector and control can be found in Appendices A and B.
The student outcomes captured in this report are based on student-level data representing an unduplicated headcount of students across all institutions, a feature of the Clearinghouse data sets that distinguishes them from many other data sources, including the Integrated Postsecondary Education Data System (IPEDS), that may not accurately capture the complexity of postsecondary pathways because they are not structured to identify multiple enrollments by individual students. The capability of the Clearinghouse data to link enrollment records across institutions nationally allows researchers to follow students longitudinally as they move from institution to institution, producing a fuller picture of college persistence and completion.
Cohort Definition
The cohort examined in this study is comprised of first-time, degree-seeking students, of any age, who began their postsecondary studies in the fall of 2012. Showing intent to seek a degree or certificate was defined as follows:
- For students who started at four-year institutions:
- Enrolled at least one term with an intensity of half-time or higher; and
- For students who started at two-year institutions, either:
- Enrolled full-time for at least one term before August 13, 2013, or
- Enrolled three- quarter-time for at least one term before December 31, 2013, or
- Enrolled at least half-time for any two terms before December 31, 2013.
First-time status was established by confirming that a student (1) did not show any postsecondary enrollment record prior to the student’s fall 2012 enrollment, unless such prior enrollment happened before the student turned 18 years old (had dual enrollment status); and (2) did not receive a degree or certificate from any postsecondary institution prior to fall 2012, unless the degree was awarded before the student turned 18 years, according to Clearinghouse data. An exception was made for former dual enrollment students: first-time college students in fall 2012 who had taken college courses while still in high school were included in the study cohort.
Depending on the strengths and limitations of the data sets they use in their analysis, researchers face considerable complexity in operationalizing the category “first-time student.” For this report, the Clearinghouse and the Project on Academic Success (PAS) balanced competing priorities in selecting a method for identifying the study cohort. On the one hand, Clearinghouse data allowed the researchers to capture a unique headcount of students nationally and, therefore, to follow individual students while also accounting for concurrent enrollments. In addition, Clearinghouse data allowed the researchers to establish first-time enrollment status empirically, i.e., by searching for prior enrollments rather than by relying on institutions’ reports, which may include idiosyncratic definitions as well as errors in transactional records. On the other hand, some limitations do arise with the method for identifying the study cohort in this report (For a full discussion of data, definitions, and limitations, please see Appendix A.).
Results
Cohort Descriptives
Figure 1. Fall 2012 Cohort By Starting Institution Type (N=2,269,618)*

*This figure is based on data shown in Appendix C, Table 11.
Figure 1 shows the fall 2012 cohort (n=2,269,618), disaggregated by type of starting institution. The largest proportion of students (44.8 percent) were enrolled at four-year public institutions, followed by two-year public institutions (33.2 percent), and four-year private nonprofit institutions (19.5 percent). Four-year private for-profit institutions enrolled 2.3 percent of students whereas the lowest proportion of enrollments were at two-year private nonprofit institutions and two-year private for-profit institutions (0.1 percent and 0.2 percent, respectively).
In terms of race and ethnicity, the highest proportion of students were white students (48.1 percent), followed by Hispanic (11.0 percent), black (10.1 percent), and Asian (4.0 percent) students. Consistent with previous Signature Reports and national figures on postsecondary education attendance, women accounted for more than one-half of the cohort (53.4 percent) (Appendix C, Tables 1-3). The majority of the students in the fall 2012 study cohort were traditional-age students (77.8 percent), followed by adult learners (12.4 percent), and delayed entry students (9.1 percent).
In terms of students’ enrollment intensity, 47.0 percent of students in the 2012 cohort were enrolled exclusively full-time during the study period, while 6.3 were enrolled exclusively part-time. “Exclusively” means during all regular terms, excluding summers, in which the student was enrolled, and hence does not exclude stop-outs. In addition, almost one-half of the cohort (47.0 percent) were mixed enrollment students; that is, students enrolled full-time for some terms and part-time for others during the study period. It is important to note that this is a considerable variation to the definition of enrollment status than the one commonly used in graduation rate studies based on IPEDS data. IPEDS cohorts are based on student enrollment status in the first, fall term only. Instead, this definition takes into account enrollment status of students over time and across institutions, allowing for a more nuanced classification (see Appendix A for further detail).
Overall Longitudinal Changes
The graph below depicts the trajectory of the overall completion rate by two-year and four-year public sectors, beginning from the first report of the completion series that focused on the Fall 2006 cohort. This figure shows the slow decline of the overall completion rate from 2007 up until the height of the recession in 2009. Since 2009, the national completion rate reflects the growing economy and changing student landscape before reaching the current 58 percent national completion rate.
Figure 2. Longitudinal Changes in Completion Rate*
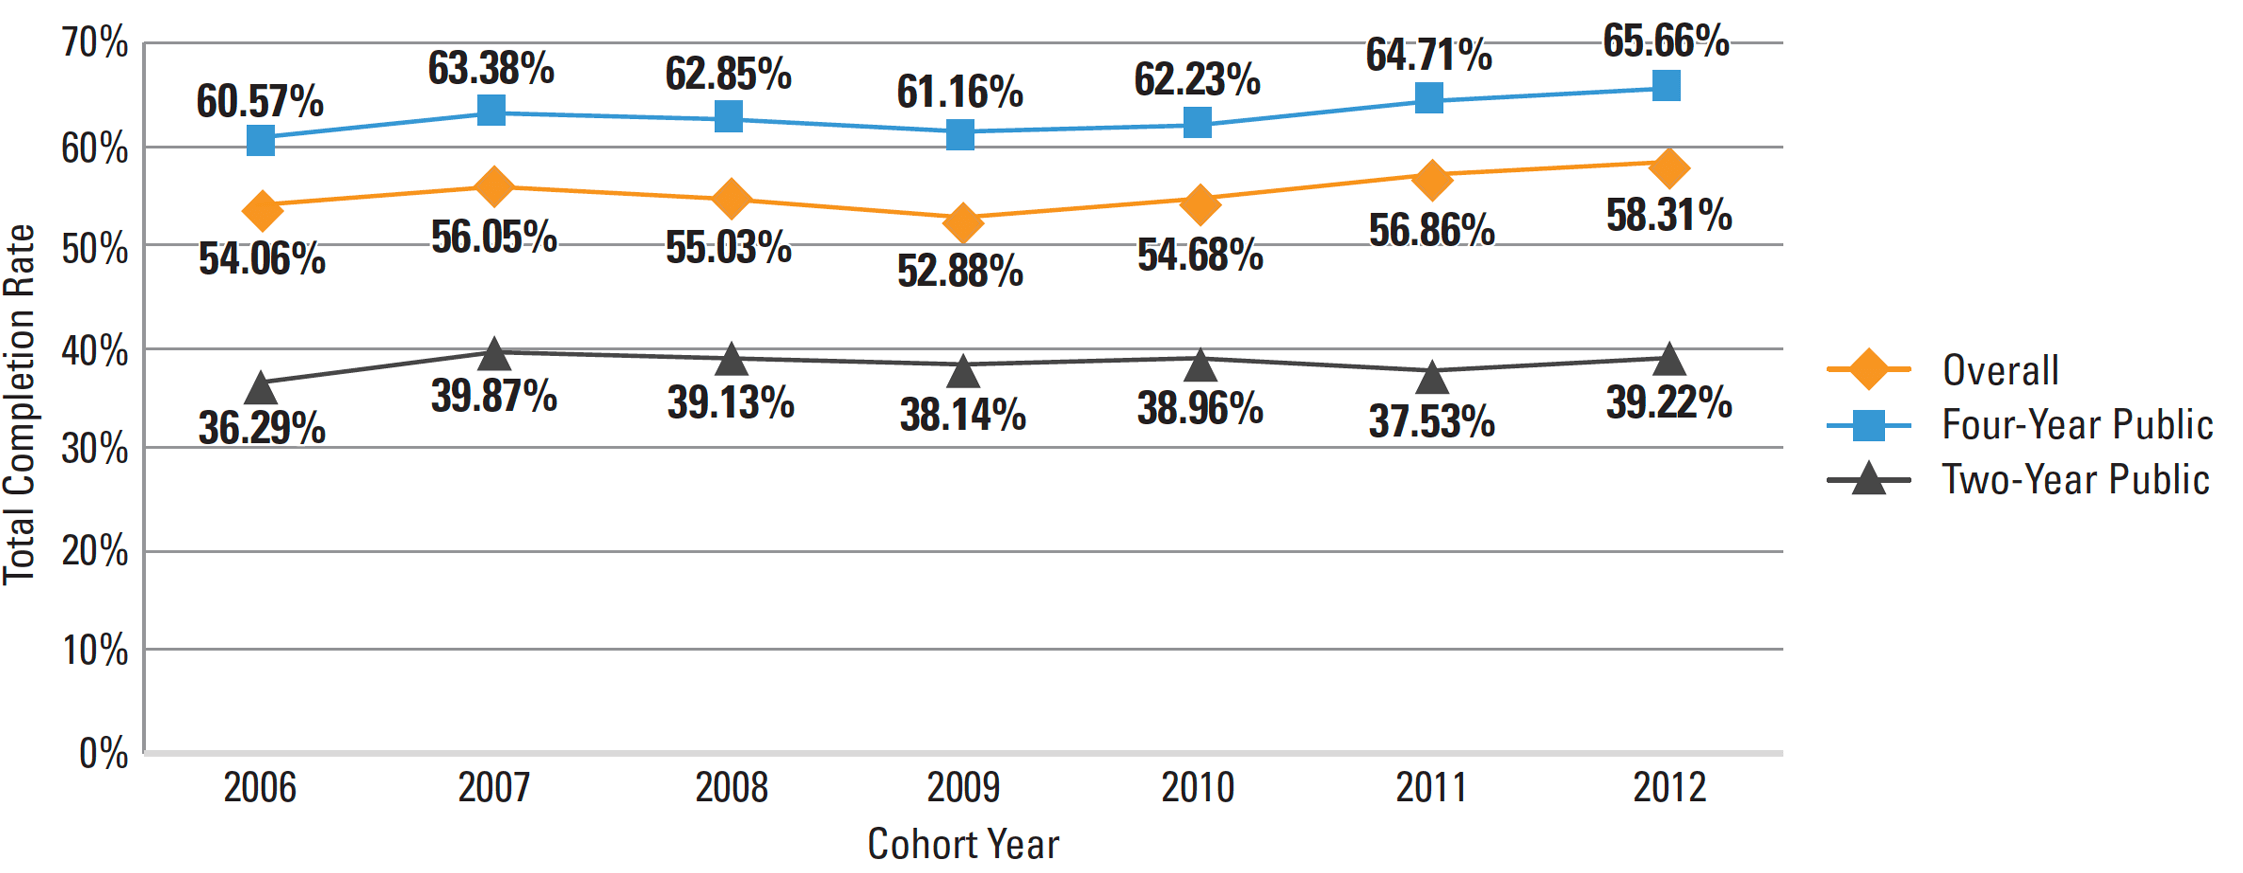
*Note: In 2011, current dual enrolled students (students enrolled in college courses during high school) were removed from the cohort of first-time students which impacted the two-year sectors moreso than the four-year sectors.
Overall Six-Year Outcomes
The results below describe six-year outcomes of degree-seeking students who first entered college in the fall of 2012. Each student’s first degree or certificate earned was examined, offering a national picture of college completion while taking a closer look at college outcomes disaggregated by starting institution type and student characteristics.
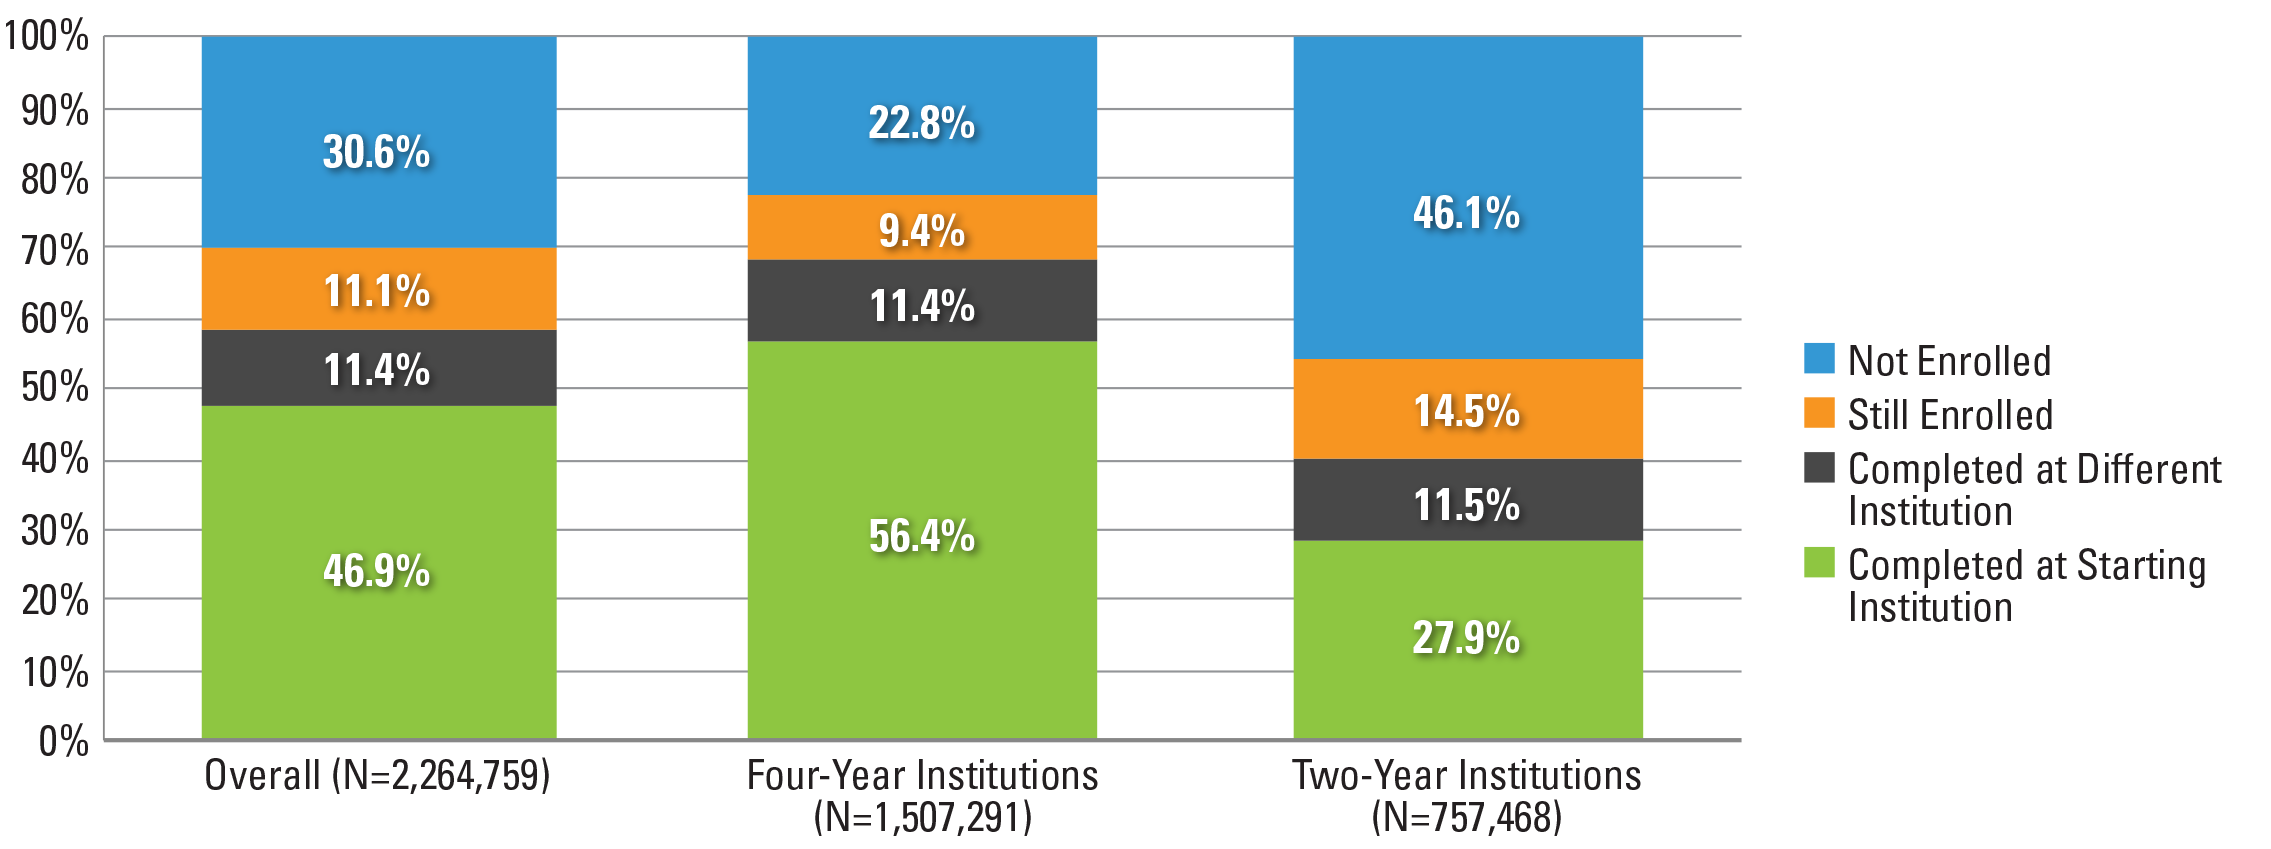
Figure 3. Six-Year Outcomes for All Students, Students Who Started at Four-Year Institutions, and Students who Started at Two-Year Institutions (N=2,264,759)*
*This figure is based on data shown in Appendix C, Table 14.
Figure 3. Overall, almost one-half (46.9 percent) of the cohort completed a credential at their starting institution and an additional 11.4 percent completed at a different institution, bringing the national total completion rate to 58.3 percent. This includes all students in the cohort, regardless of the starting institution type. Disaggregating by the level of institution, over two in three students (67.8 percent) who started at four-year institutions and two in five (39.4 percent) at two-year institutions, completed college by the end of the six-year study period. Meanwhile, the stop-out, or no longer enrolled rate, at two-year institutions was twice that of four-year institutions (46.1 percent and 22.8 percent, respectively). These are students who had earned no degree or certificate, and had no enrollment activity during the final year of the study period.
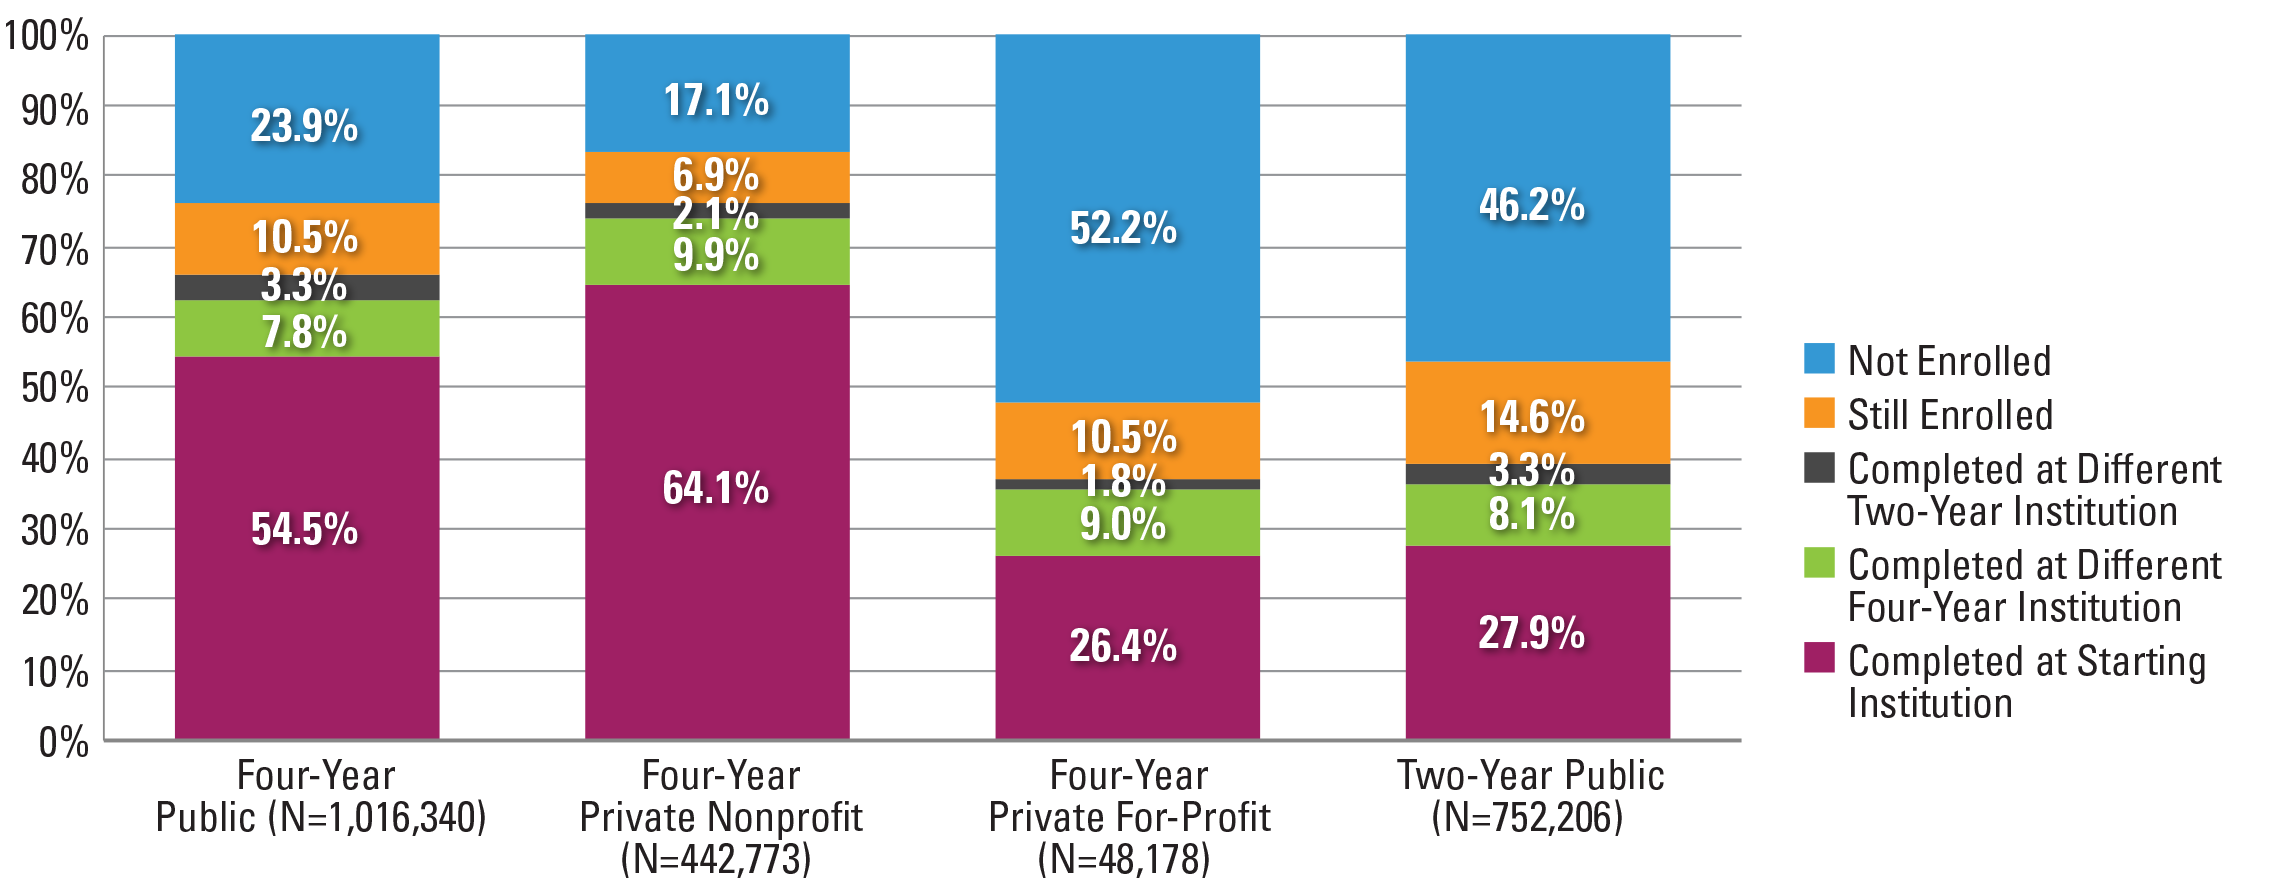
Figure 4. Six-Year Outcomes by Starting Institution Type (N=2,259,497)*
*This figure is based on data shown in Appendix C, Table 15.
Figure 4. Among the four largest categories of institutions (four-year public, four-year private nonprofit, two-year public and four-year private for-profit), students who started at four-year private nonprofit institutions had the highest completion rates (76.1 percent), followed by students at four-year public (65.7 percent), two-year public (39.2 percent) and four-year private for-profit (37.3 percent) institutions. Stop-out rates were the highest (52.2 percent) at four-year private for-profit institutions, followed by two-year public institutions (46.2 percent).
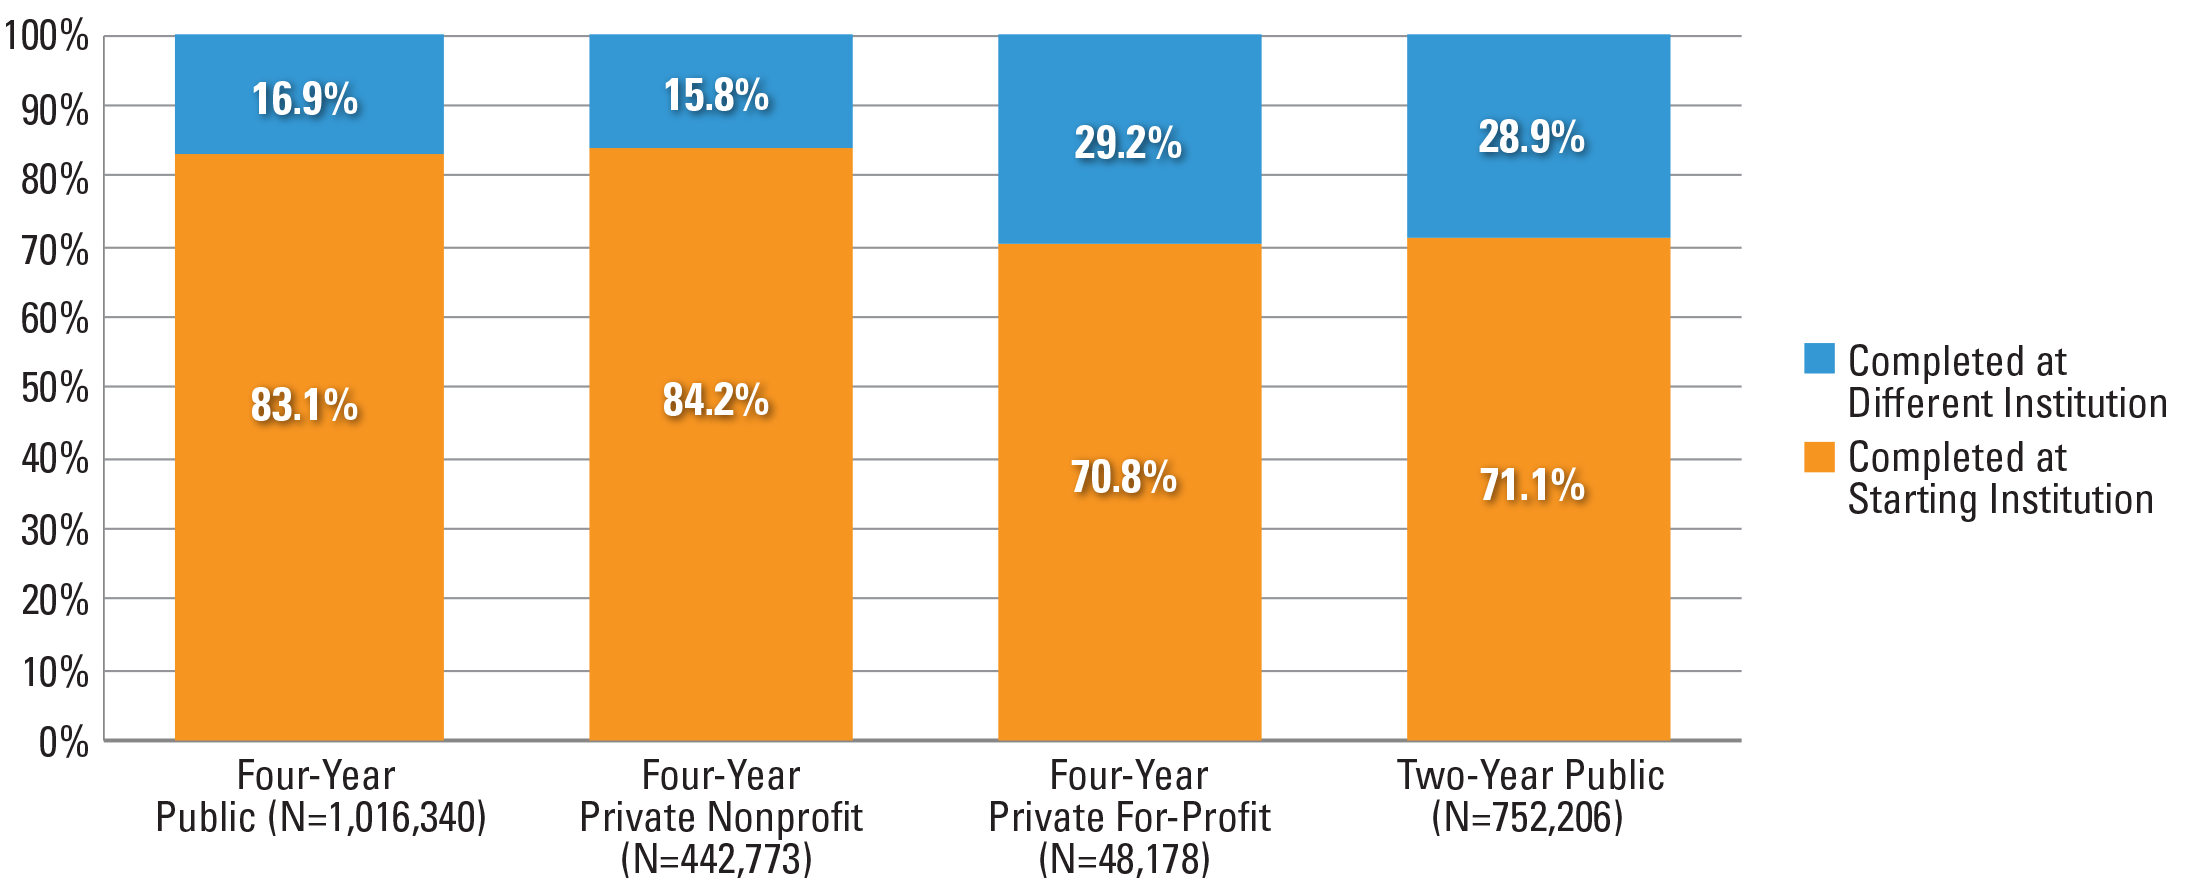
Figure 5. Completion at Starting vs. Different Institution by Starting Institution Type (N=2,259,497)*
*This figure is based on data shown in Appendix C, Table 15.
Figure 5. Among those who completed a credential, a higher proportion of students who started at a four-year private for-profit and a two-year public institution had completed their credential at a different institution (29.2 percent and 28.9 percent, respectively) than those who started at at a four year public and four-year private nonprofit institutions. The proportion of students who completed at a different institution was similar for students who started at a four-year public and a four-year private nonprofit institution (16.9 percent and 15.8 percent, respectively).
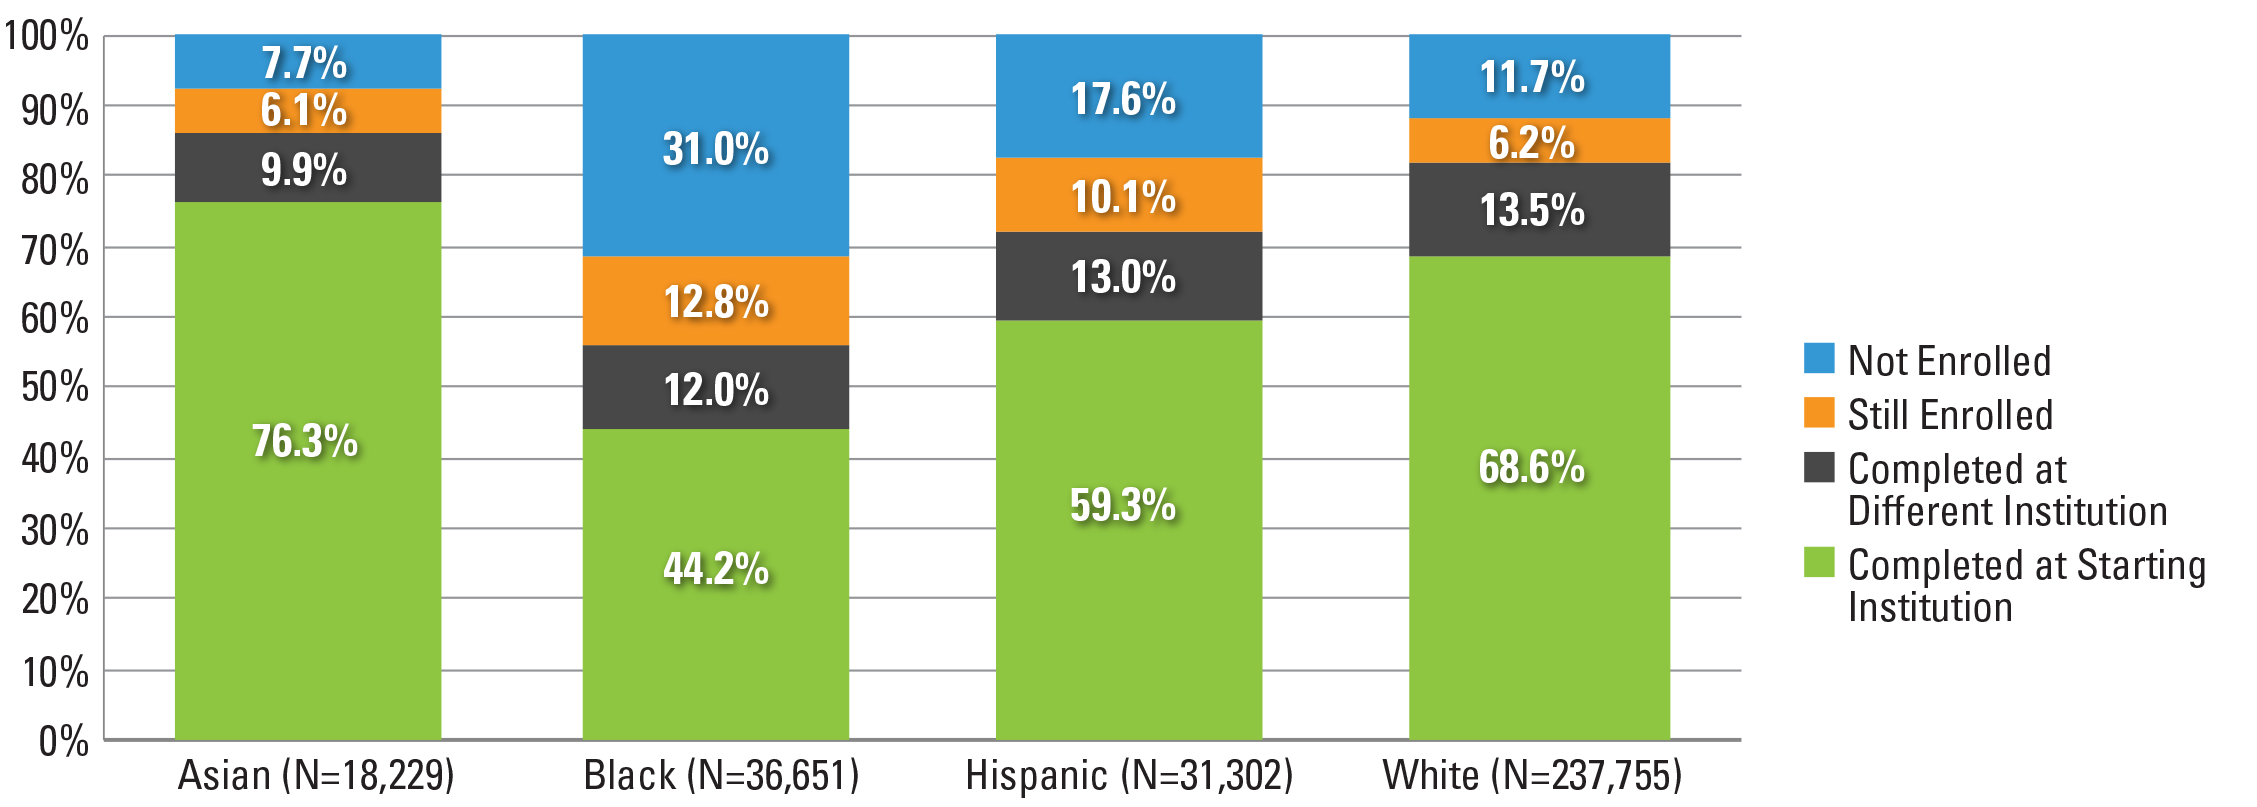
Figure 6. Six-Year Outcomes by Race and Ethnicity (N=1,661,399)*
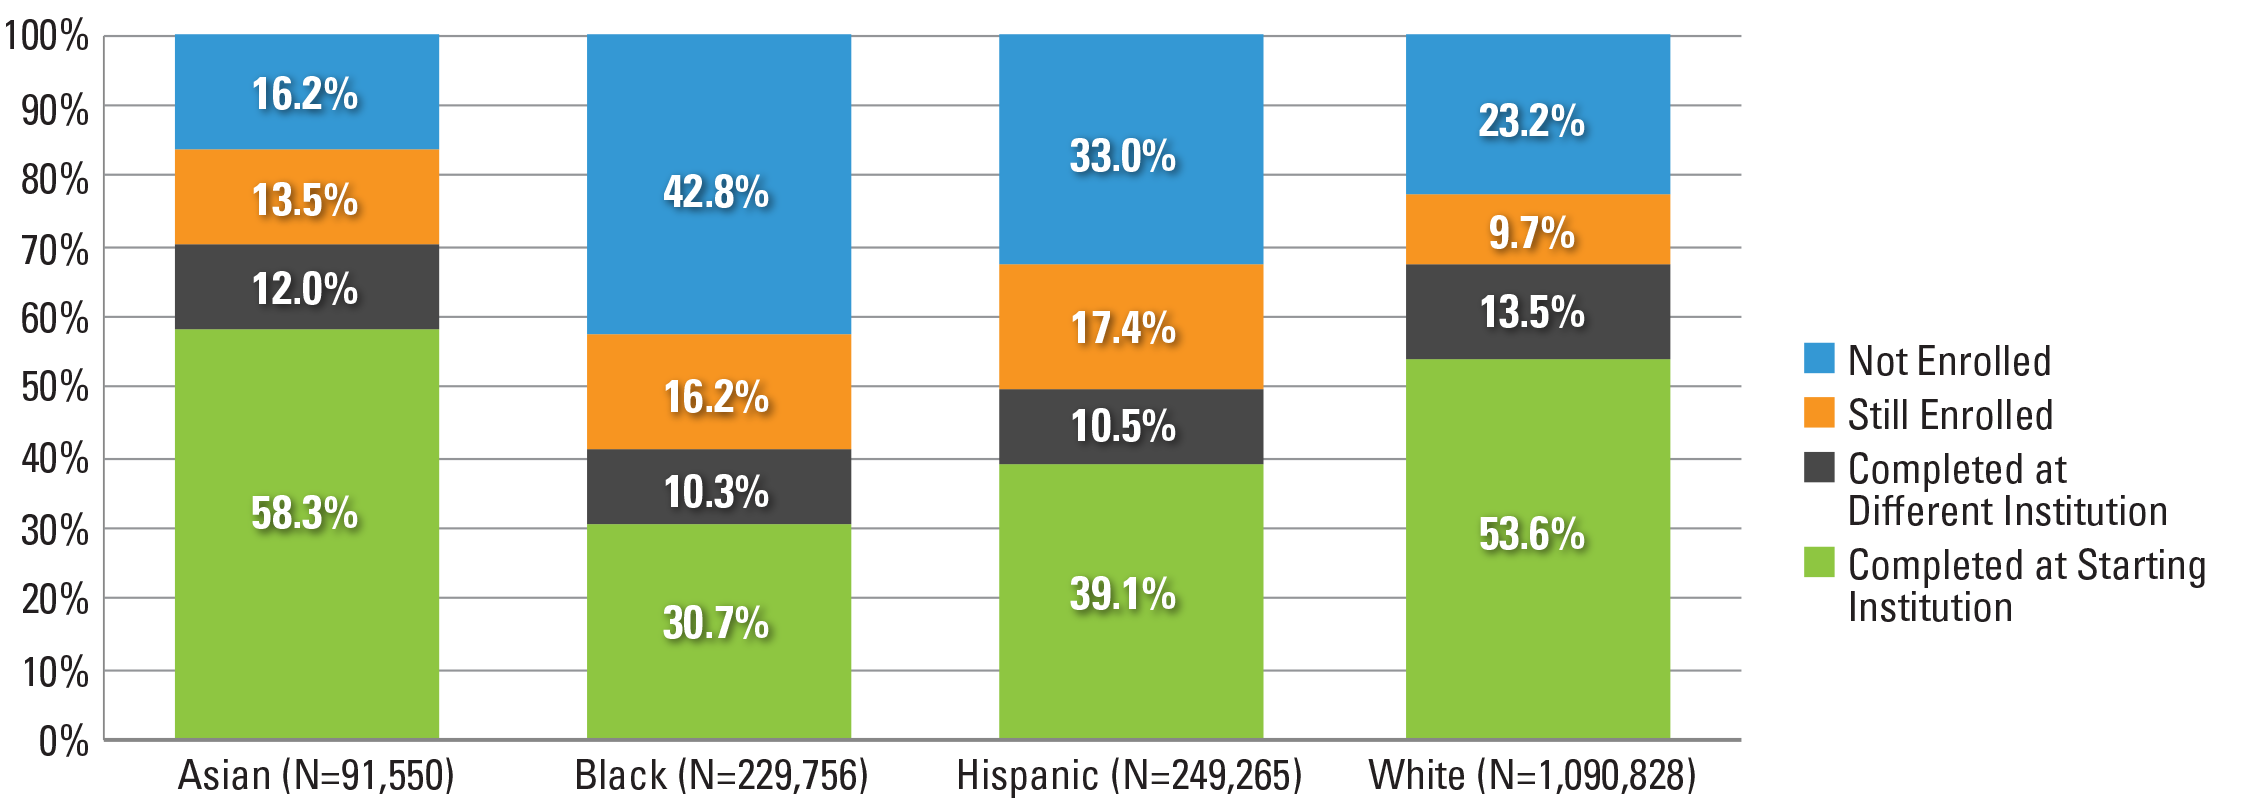
*This figure is based on data shown in Appendix C, Table 17.
*See Appendix C, Table 17b for completion outcomes of other race and ethnicity categories (e.g., non-resident alien, American Indian/Alaskan Native, and Native Hawaiian/Pacific Islander).
Figure 6. Asian students showed the highest completion rate at 70.3 percent, followed by white students at 67.1 percent. Black and Hispanic students had much lower completion rates (41.0 and 49.6 percent, respectively).
Figure 7. Six-Year Outcomes by Age at First Entry (N=2,250,152)*
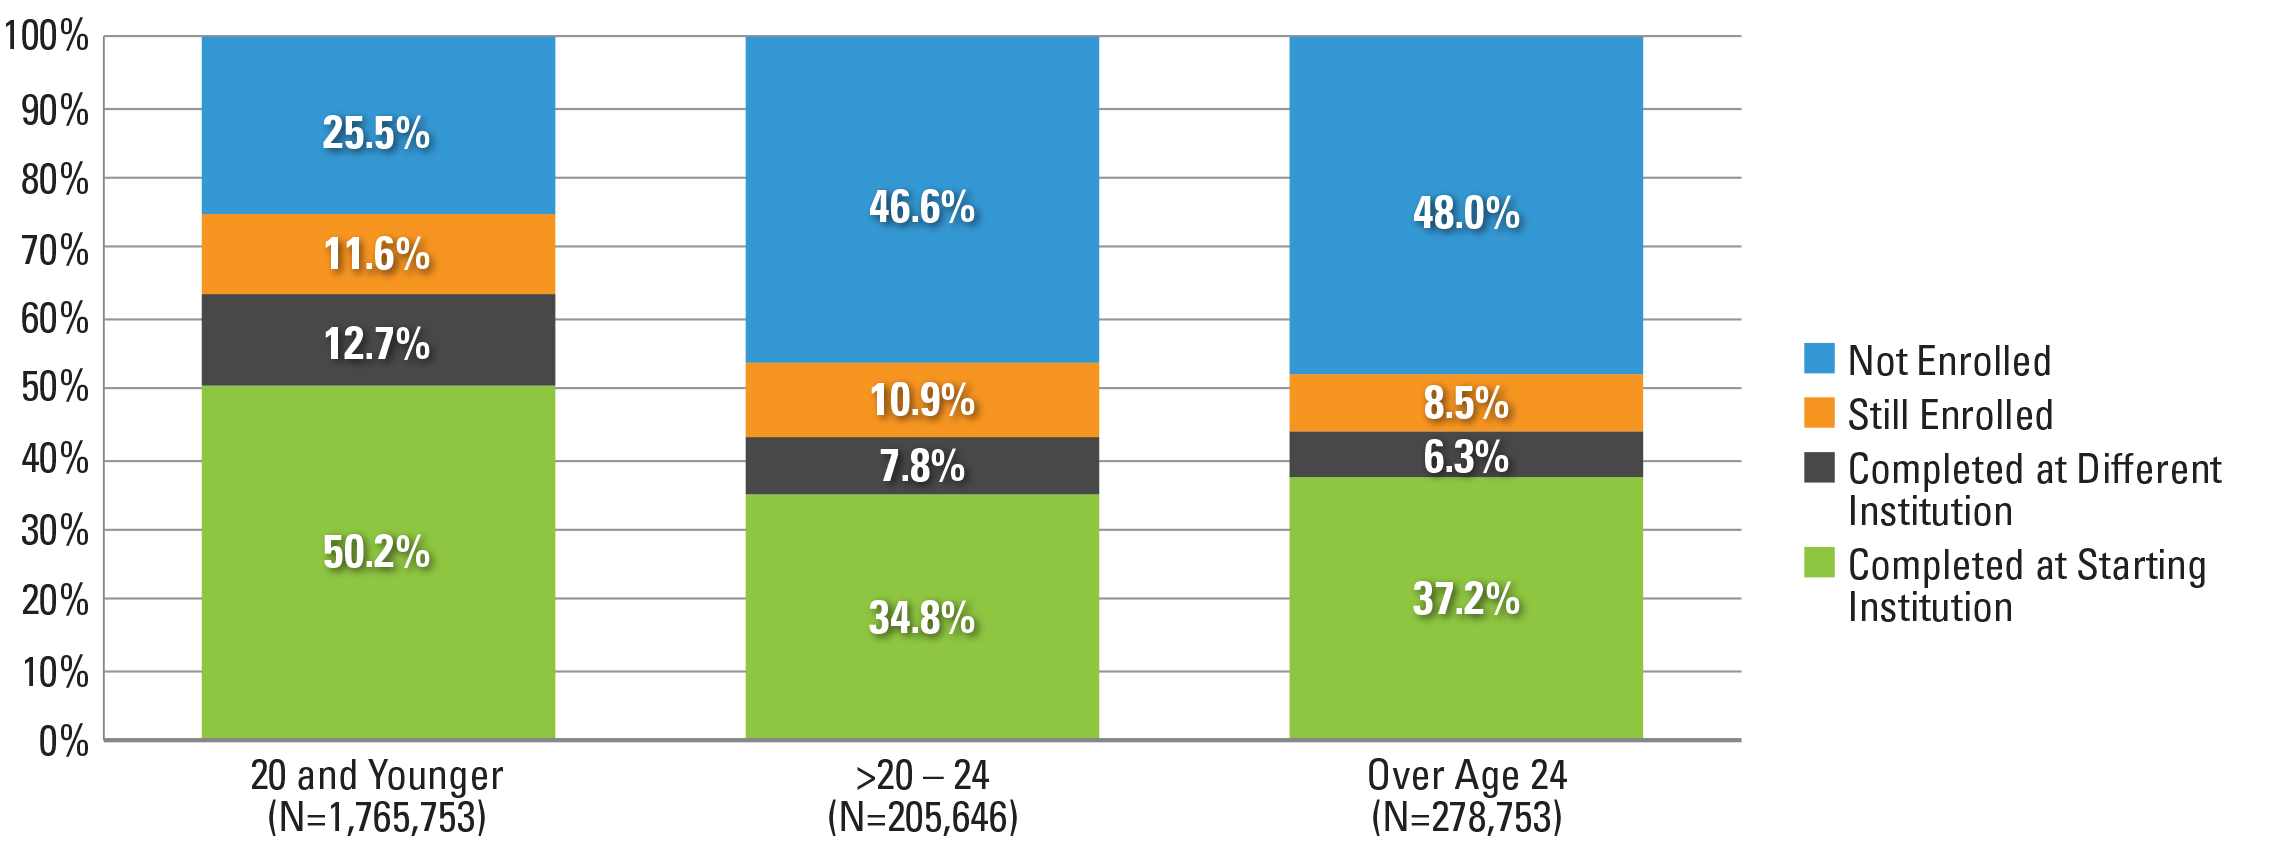
Note: Students with date of birth date data missing were excluded from the above figure.
*This figure is based on data shown in Appendix C, Table 19.
Figure 7. Overall, traditional-age students (20 or younger) displayed the highest completion rates (62.9 percent), while a little less than one-half of delayed entry students (over age 20 through 24) and adult learners (over 24) were no longer enrolled in college at the end of the study period (46.6 percent and 47.9 percent, respectively). Completion and stop-out patterns were similar across delayed entry students and adult learners.
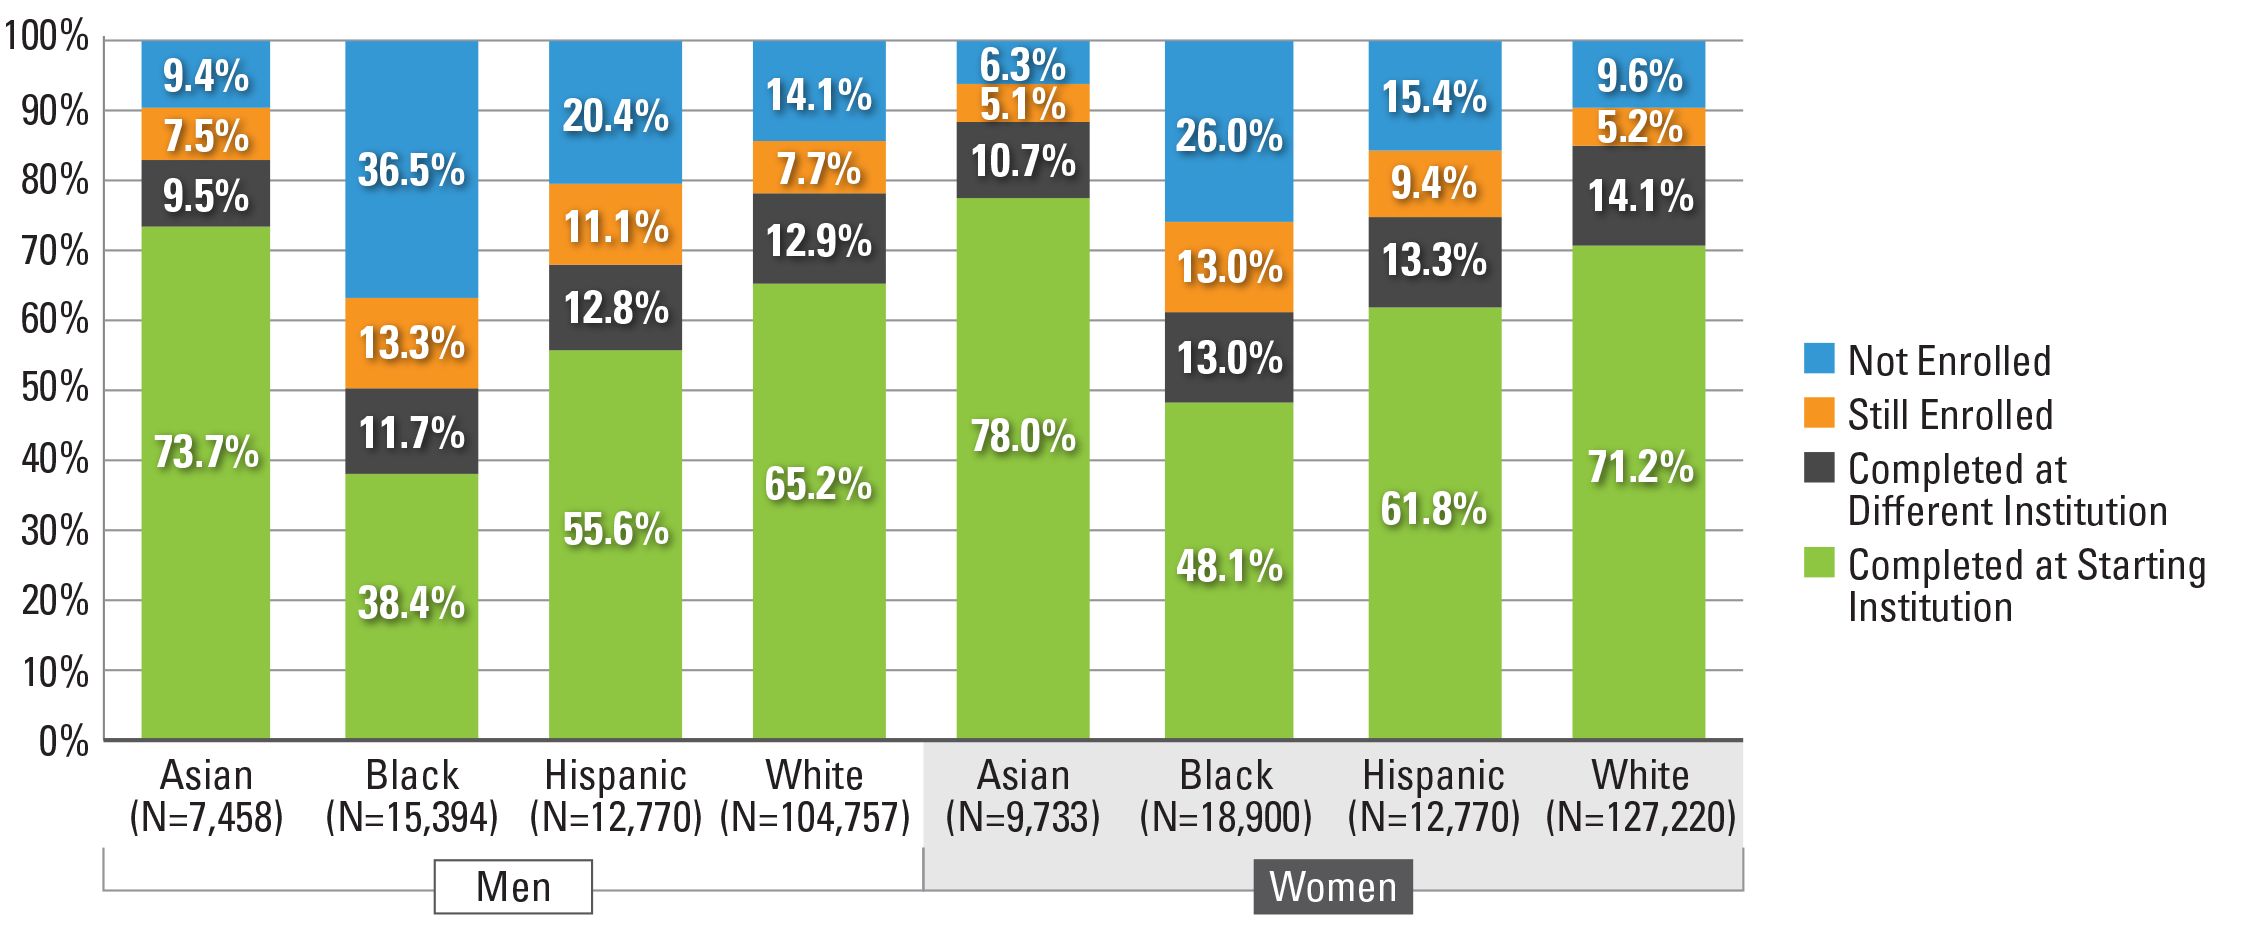
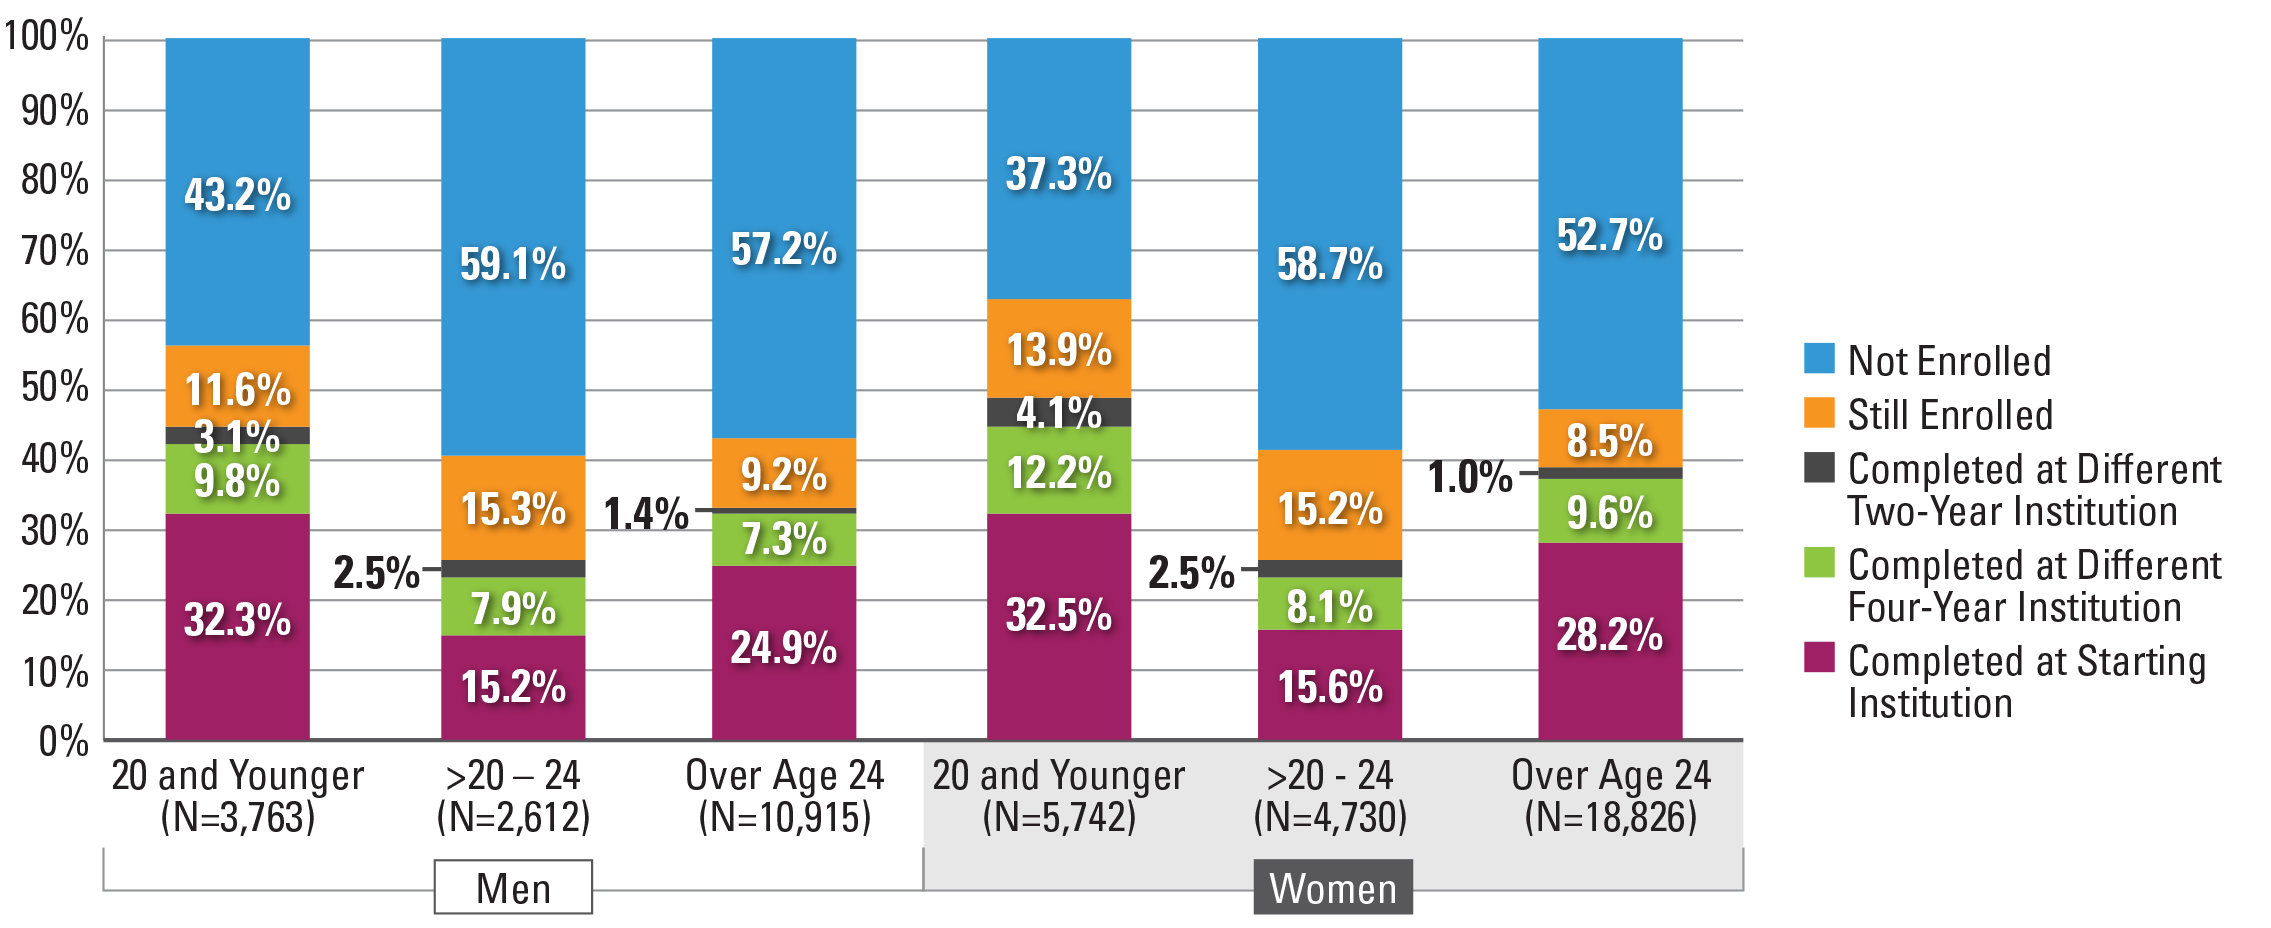
Figure 8. Six-Year Outcomes by Race and Ethnicity and Gender (N=1,599,059)*
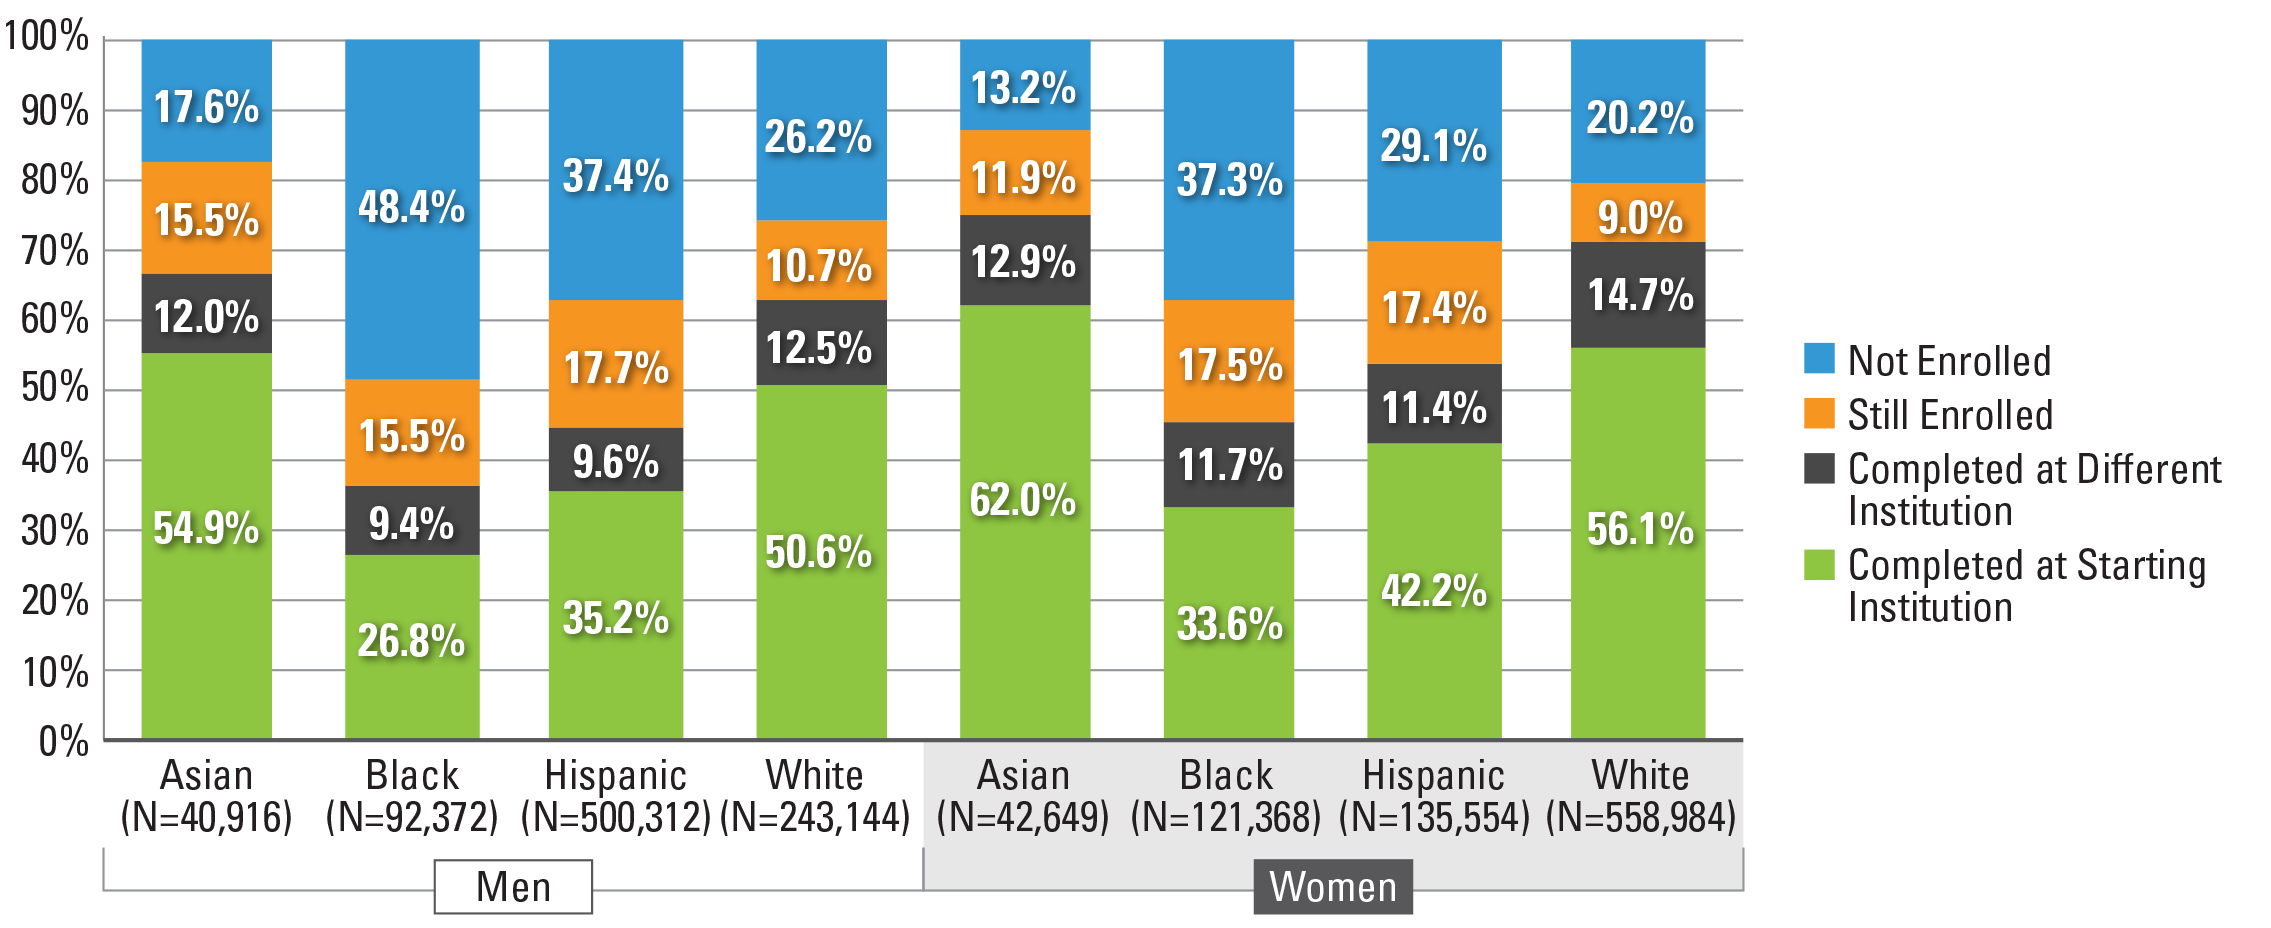
Note: Students with missing gender data were excluded fro the above figure.
*This figure is based on data shown in Appendix C, Table 20.
Figure 8. Women had higher completion rates than men, regardless of race and ethnicity. Out of all the race and ethnicity groups, black men had the lowest completion rate of 36.1 percent and the highest stop-out rate, with almost half of them stopping out by the end of the study period.
Outcomes for Students who Started at Four-Year Public Institutions
The total completion rate for all students who started at a four-year public institution, including those who completed at the starting institution or elsewhere, was 65.7 percent, with 54.5 percent completing at their starting institution and an additional 11.1 percent at a different institution.
Figure 9. Six-Year Outcomes for Students Who Started at Four-Year Public Institutions (N=1,016,340)*
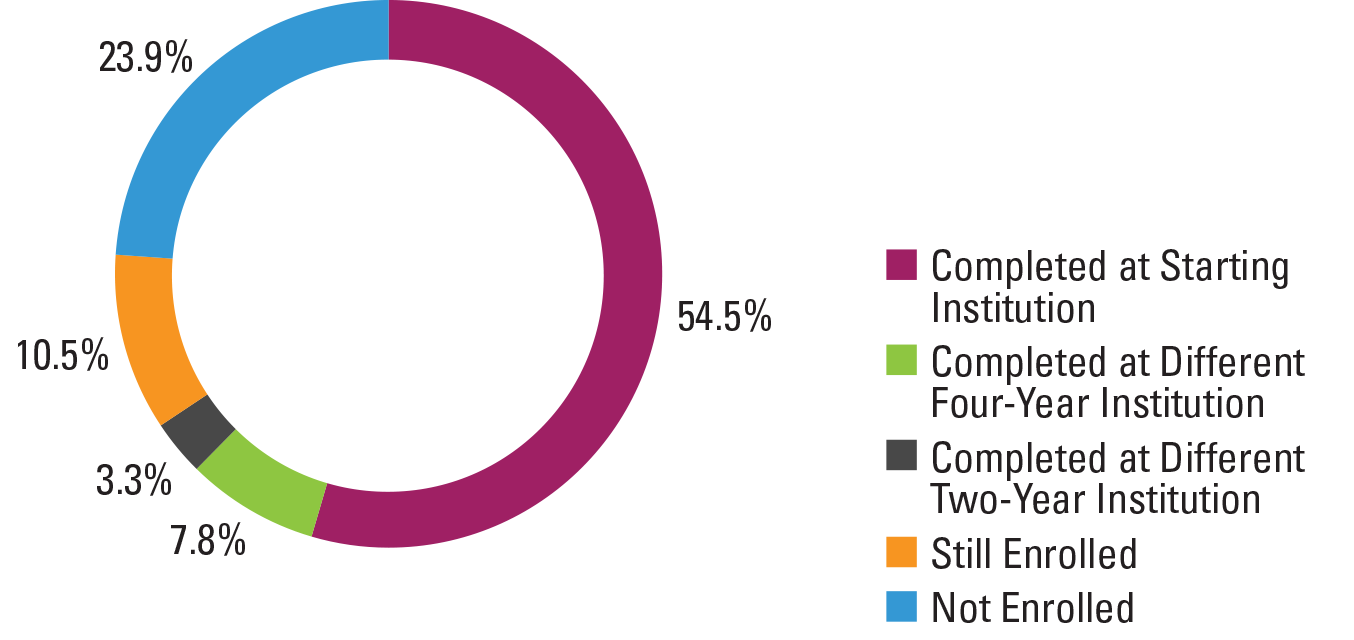
*This figure is based on data shown in Appendix C, Table 27.
*The total completion rate for students who started at four-year public institutions is 65.7%.
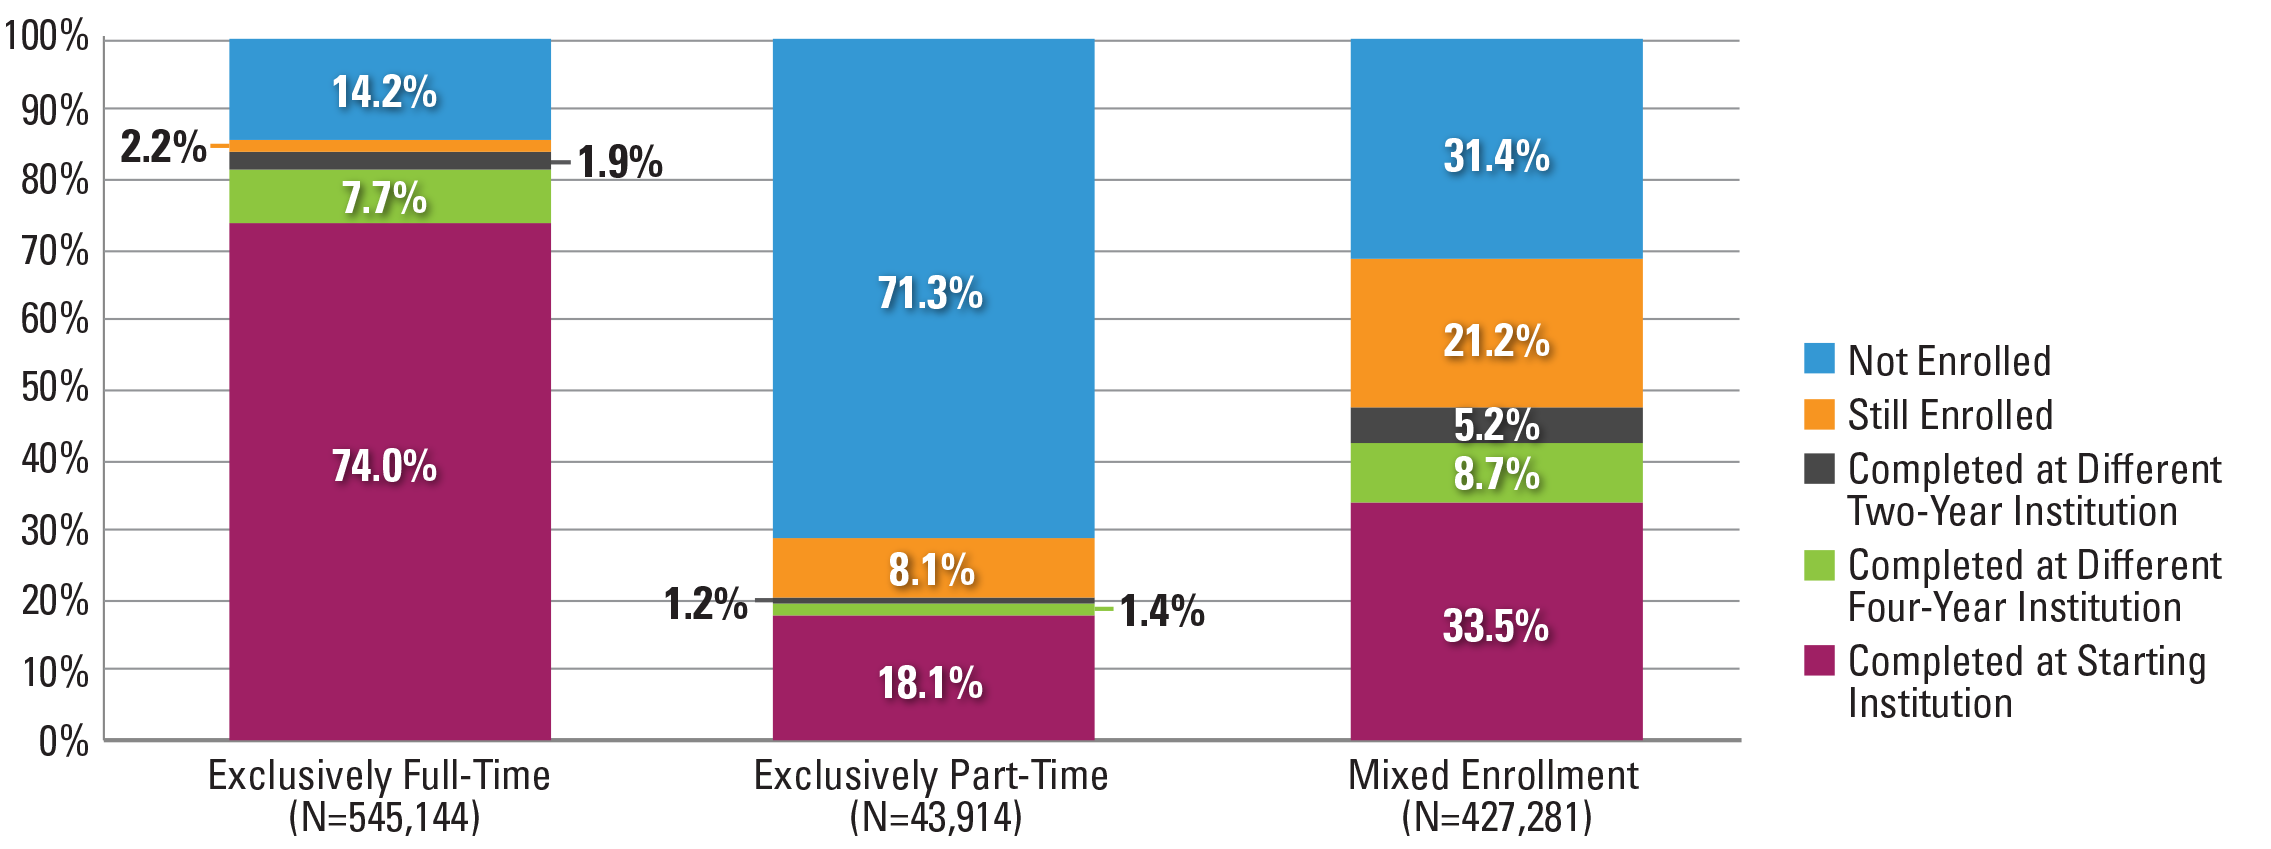
Figure 10. Six-Year Outcomes for Students Who Started at Four-Year Public Institutions by Enrollment Intensity (N=1,016,339)*
*This figure is based on data shown in Appendix C, Table 28.
Figure 10. The highest proportion of students who stopped out appeared among exclusively part-time students: 71.3 percent of these students were no longer enrolled in college at the end of the study period. Exclusively full-time students had the highest completion rates (83.6 percent), and mixed enrollment students had the highest still enrolled rates at the end of the study period (21.2 percent).
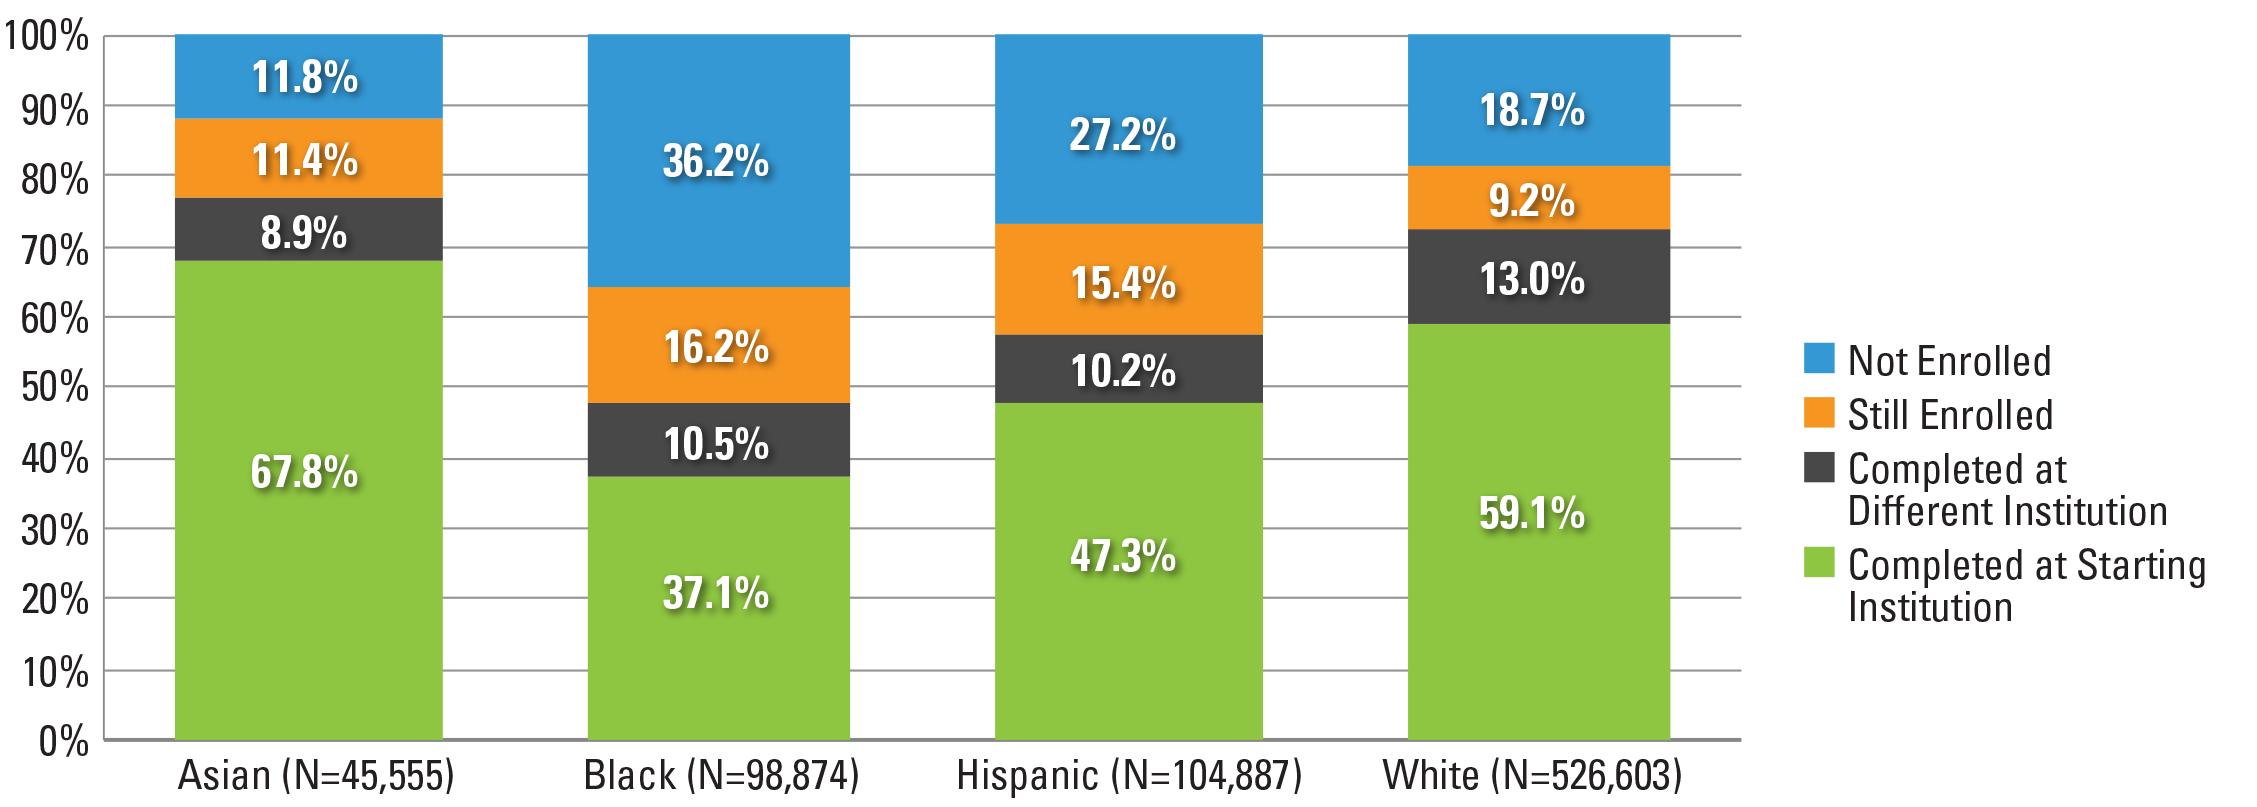
Figure 11. Six-Year Outcomes for Students Who Started at Four-Year Public Institutions by Race and Ethnicity (N=775,919)*
*This figure is based on data shown in Appendix C, Table 29a.
*See Appendix C, Table 29b for completion outcomes of other race and ethnicity categories (e.g., non-resident alien, American Indian/Alaskan Native, and Native Hawaiian/Pacific Islander).
Figure 11. Asian students had the highest completion rate (76.7 percent), followed by white students (72.1 percent), Hispanic students (57.4 percent), and black students (47.6 percent). Black students had the highest stop-out rate (36.2 percent). However, they also had the highest proportion of still enrolled students at the end of the study period (16.2 percent).
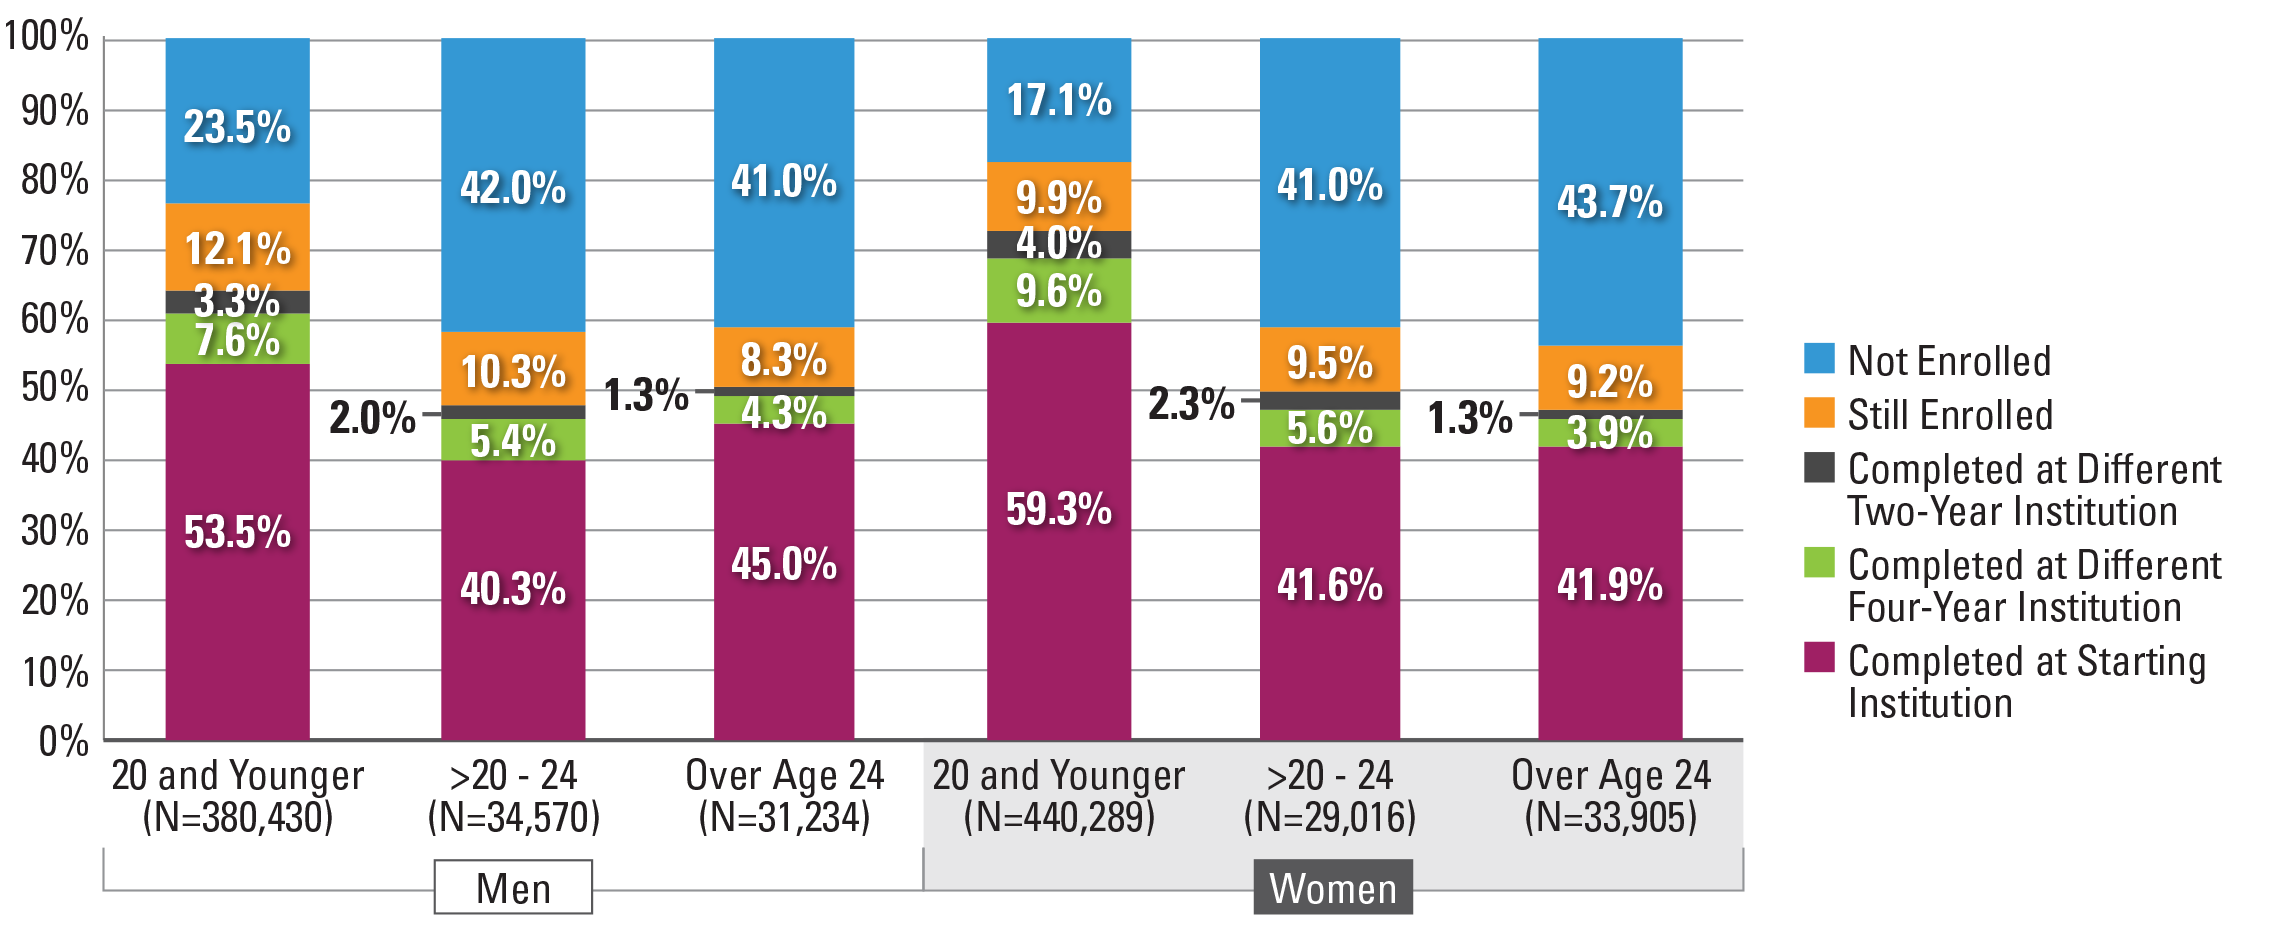
Figure 12. Six-Year Outcomes for Students Who Started at Four-Year Public Institutions by Age at First Entry (N=1,009,133)*

Note: Students with missing birth date data were excluded from the above figure.
*This figure is based on data shown in Appendix C, Table 31.
Figure 12. The outcomes for delayed entry and adult learners were similar, with completion rates of 50.4 percent and 50.6 percent, respectively, much lower than traditional-age students’ completion rate of 68.7.
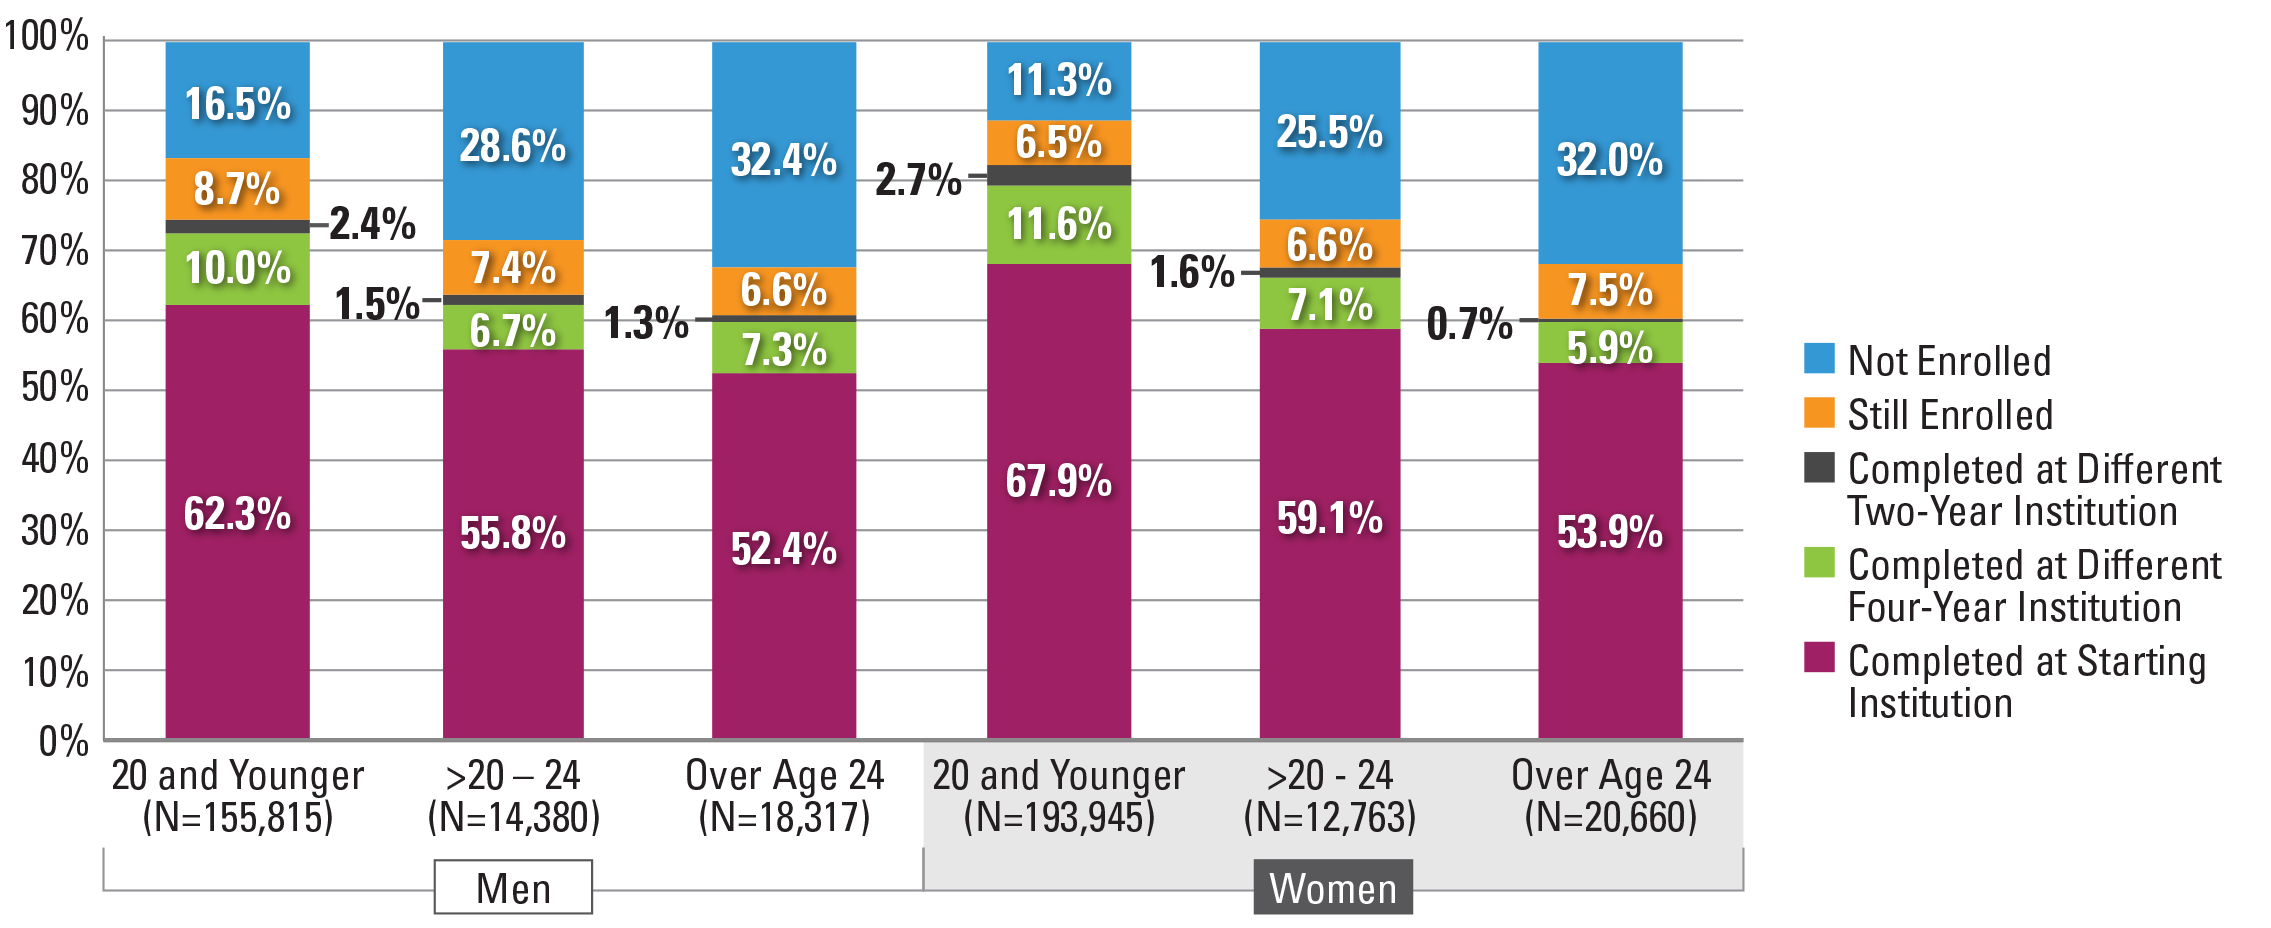
Figure 13. Six-Year Outcomes for Students Who Started at Four-Year Public Institutions by Gender and Age at First Entry (N=949,444)*
Note: Students with missing birth date or gender data were excluded from the above figure.
*This figure is based on data shown in Appendix C, Table 33.
Figure 13. In terms of age at first entry and gender, traditional-age students were more likely to complete a credential than delayed entry students or adult learners. The outcomes for delayed entry students and adult learners were similar and this pattern remained consistent regardless of gender. Although both traditional-age and delayed entry female students outperformed their male counterparts, among adult learners, men were more likely to complete a credential than women.
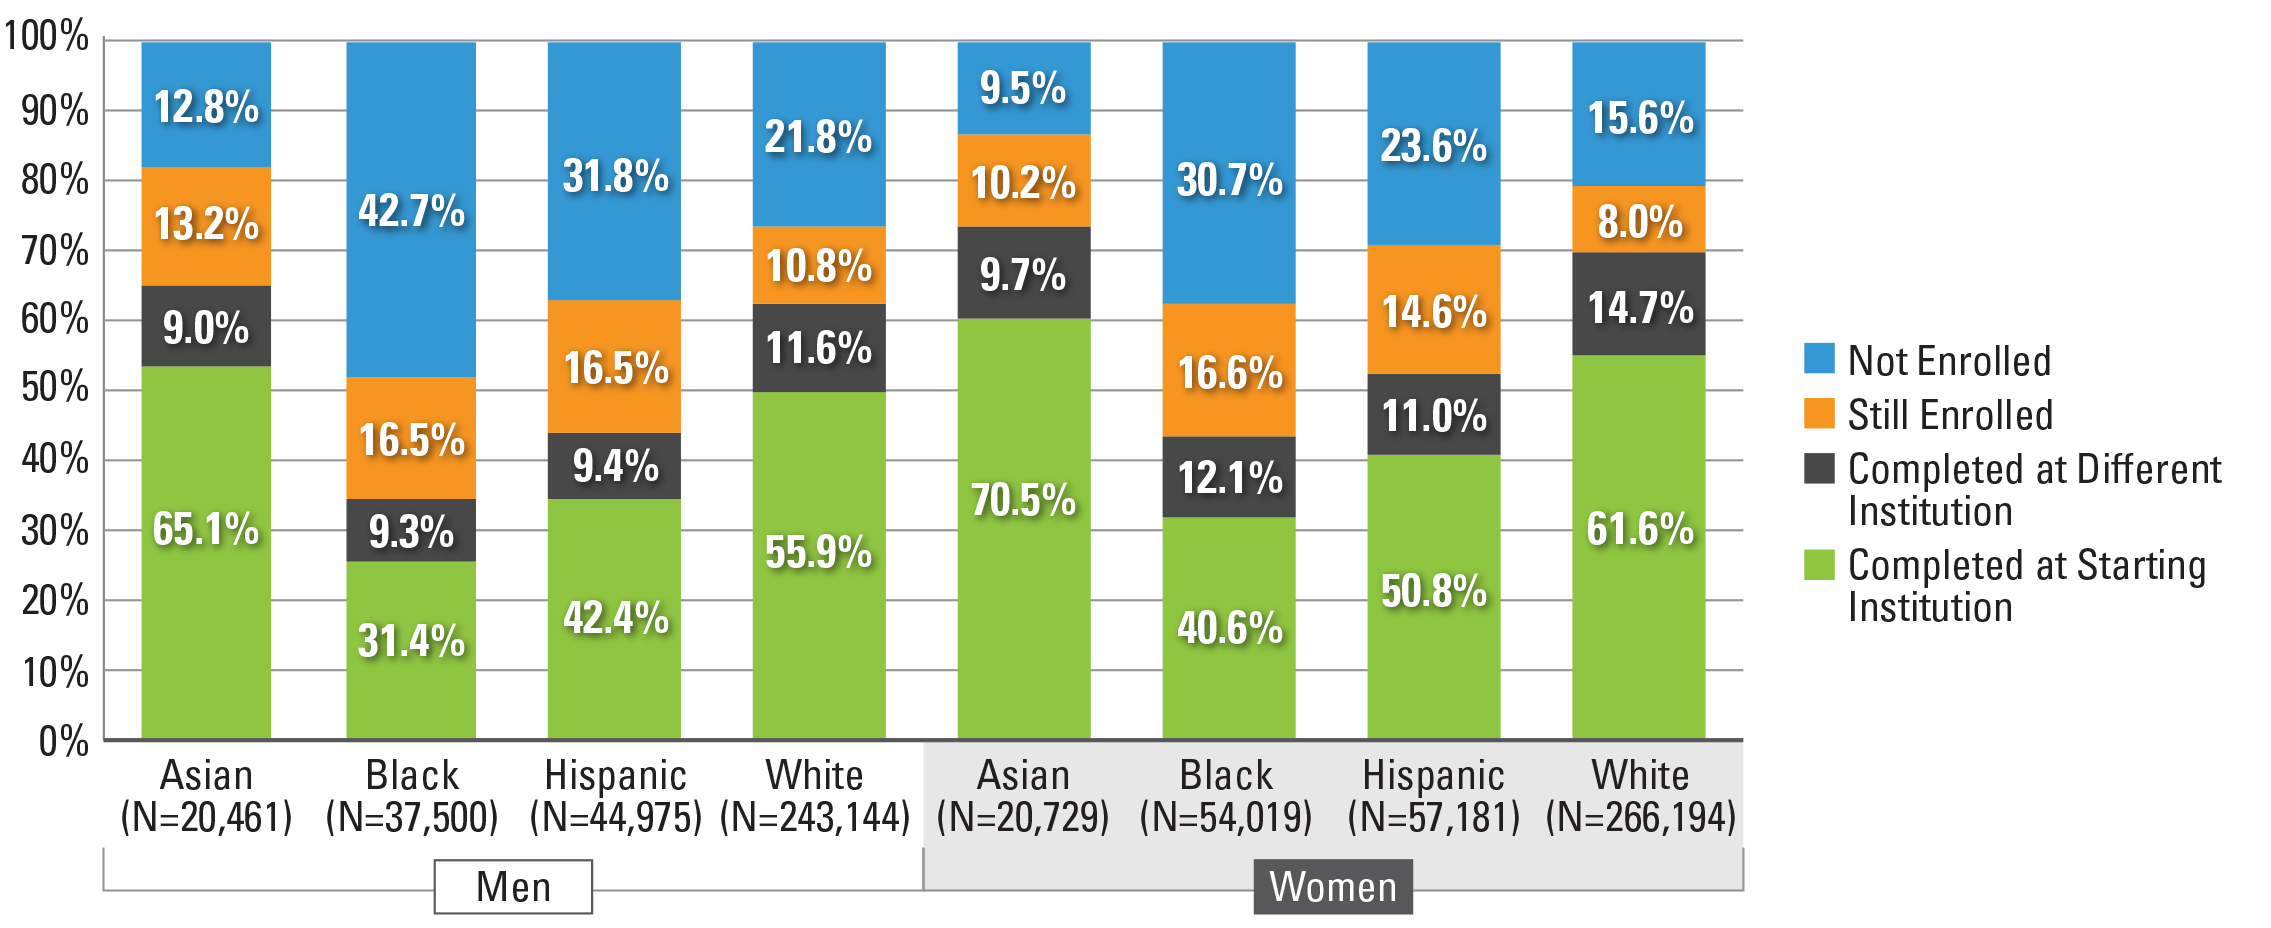
Figure 14. Six-Year Outcomes for Students Who Started at Four-Year Public Institutions by Race and Ethnicity and Gender (N=744,203)*
Note: Students with missing gender data were excluded from the above figure.
*This figure is based on data shown in Appendix C, Table 32.
Figure 14. Overall, Asian women (80.2 percent), followed by white women (76.3 percent) had higher completion rates than Asian men (74.1) and white men (67.5 percent). Black men had the lowest completion rate at 40.7 percent, as well as the highest stop-out rate at 42.7 percent in comparison to other racial/gender groups. When the results were further disaggregated by both age and gender, black men in delayed entry group had the lowest completion rate at 25.2 percent and highest stop-out rate at 59.9 percent (Appendix C, Table 35).
Outcomes for Students who Started at Two-Year Public Institutions
Two-year public institutions were the starting point for 33.4 percent of the students in the fall 2012 cohort. Overall, 39.2 percent of the students who began at a two-year public institution completed a degree within six years. Of those who completed, seven in ten students (71.1 percent) completed at their starting institution, while three in 10 students (28.9 percent) completed at a different institution. Slightly less than half of the students who began at a two-year public institution were no longer enrolled by the end of the study period (46.2 percent).
Figure 15. Six‐Year Outcomes and First Completion for Students Who Started at Two‐Year Public Institutions (N=752,206)*
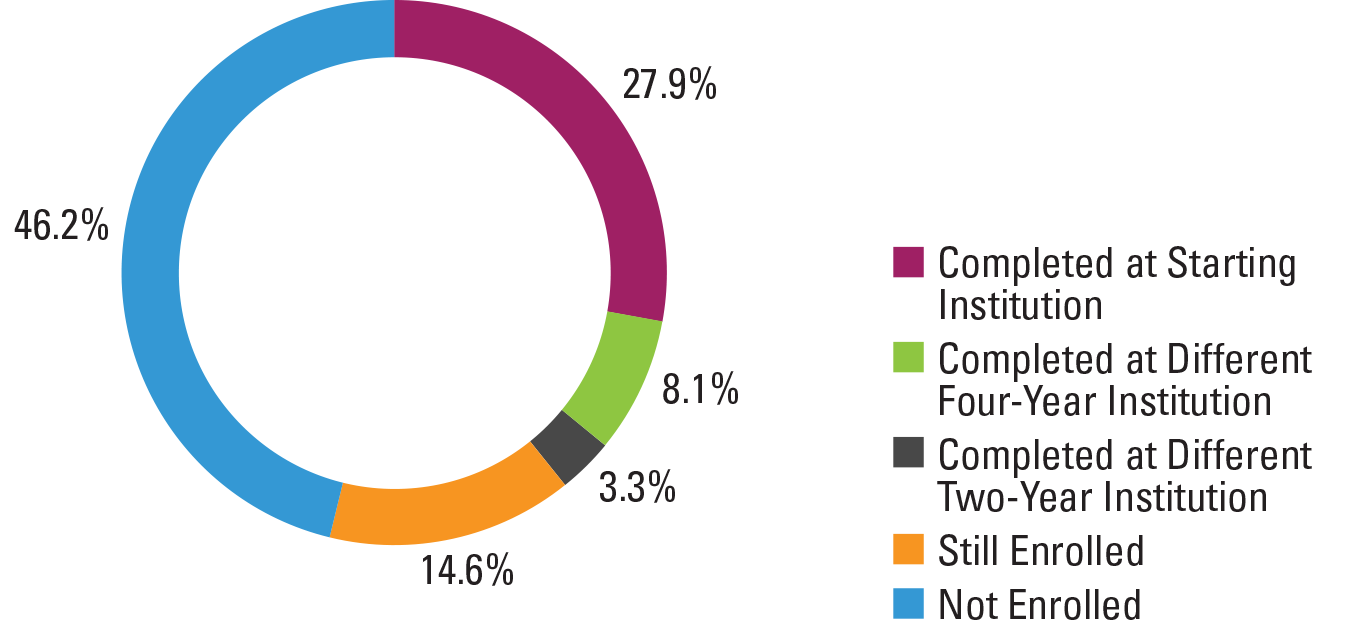
*This figure is based on data shown in Appendix C, Table 39.
*The total completion rate for students who started at two-year public institutions is 39.22%.
Figure 16. Six-Year Outcomes and First Completion for Students Who Started at Two-Year Public Institutions by Race and Ethnicity (N=543,849)*
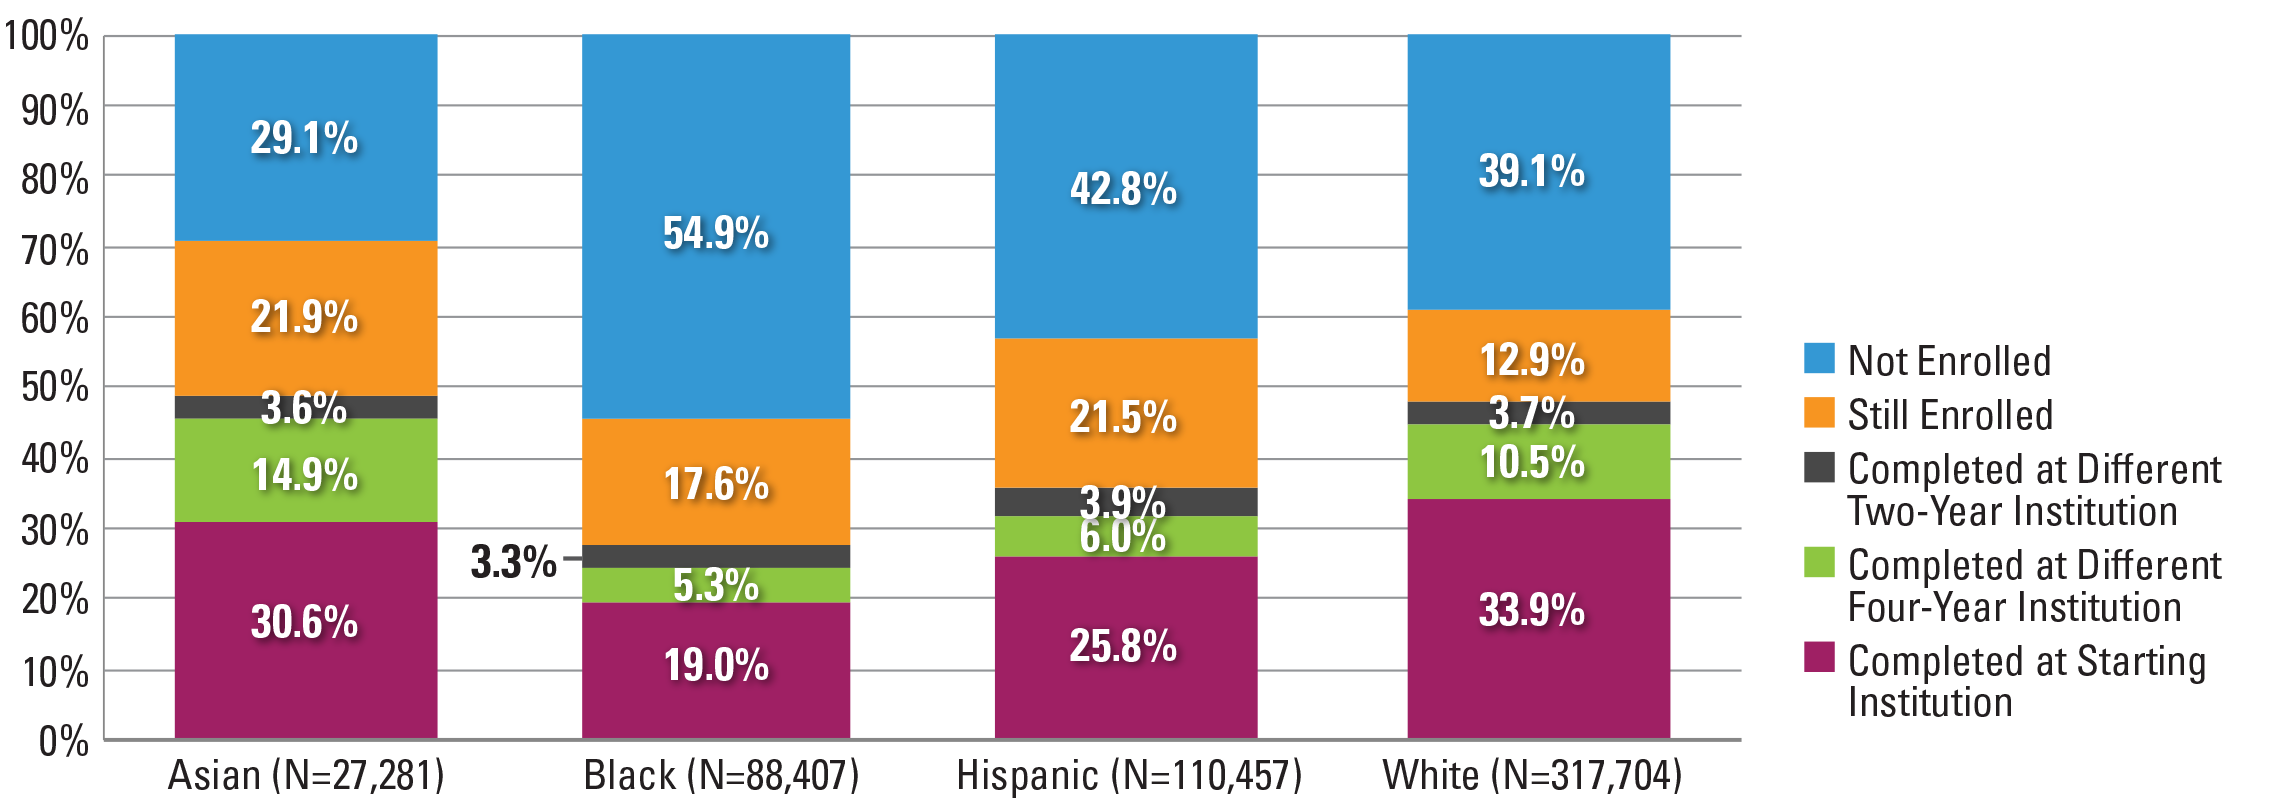
*This figure is based on data shown in Appendix C, Table 41a
*See Appendix C, Table 41b for completion outcomes of other race and ethnicity categories (e.g., non-resident alien, American Indian/Alaskan Native, and Native Hawaiian/Pacific Islander).
Figure 16. Similar to the patterns observed for four-year starters, Asian students who started at two-year public institutions had the highest completion rate (49.1 percent) followed closely by white students (48.1 percent). Hispanic students had a completion rate of 35.7 percent followed by black students (27.5 percent). Over half of all black students who started at a two-year public institution were no longer enrolled at any institution at the end of the study period (54.9 percent). The stop-out rates among Hispanic and white students were very similar (42.8 percent and 39.1 percent, respectively).
Figure 17. Completion at Four-Year Institutions for Students Who Started at Two-Year Public Institutions by Race and Ethnicity (N=543,849)*
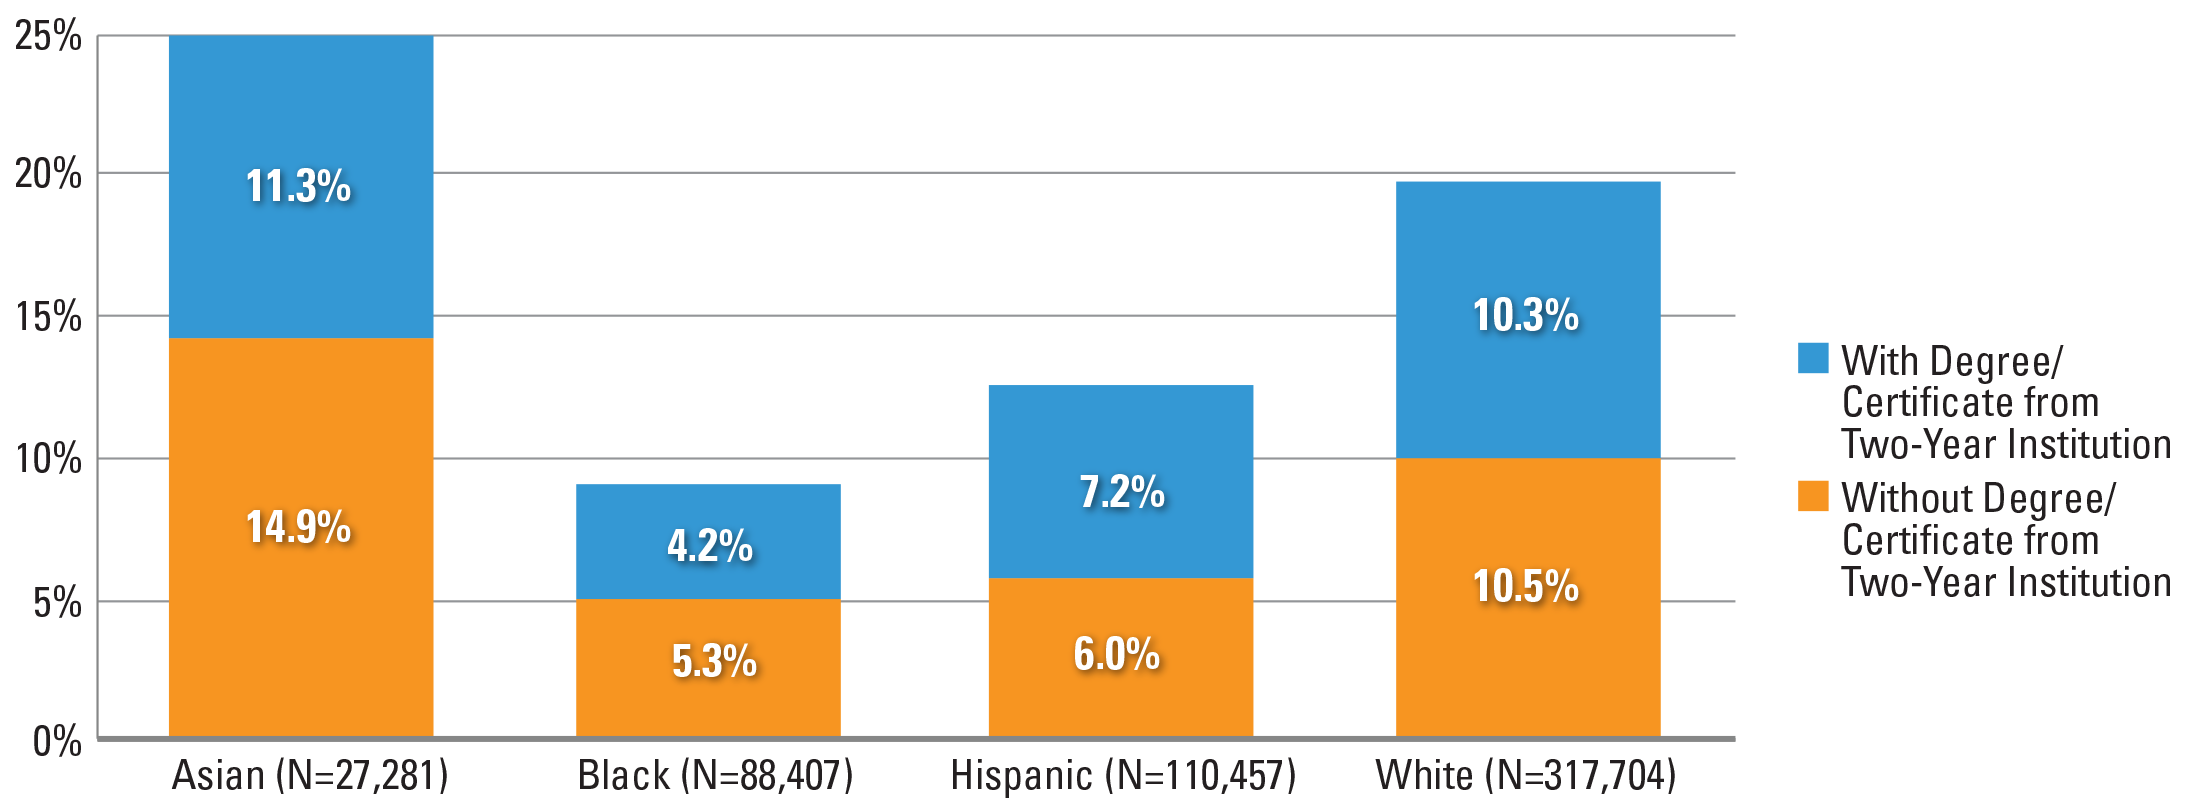
*This figure is based on data shown in Appendix C, Table 41a.
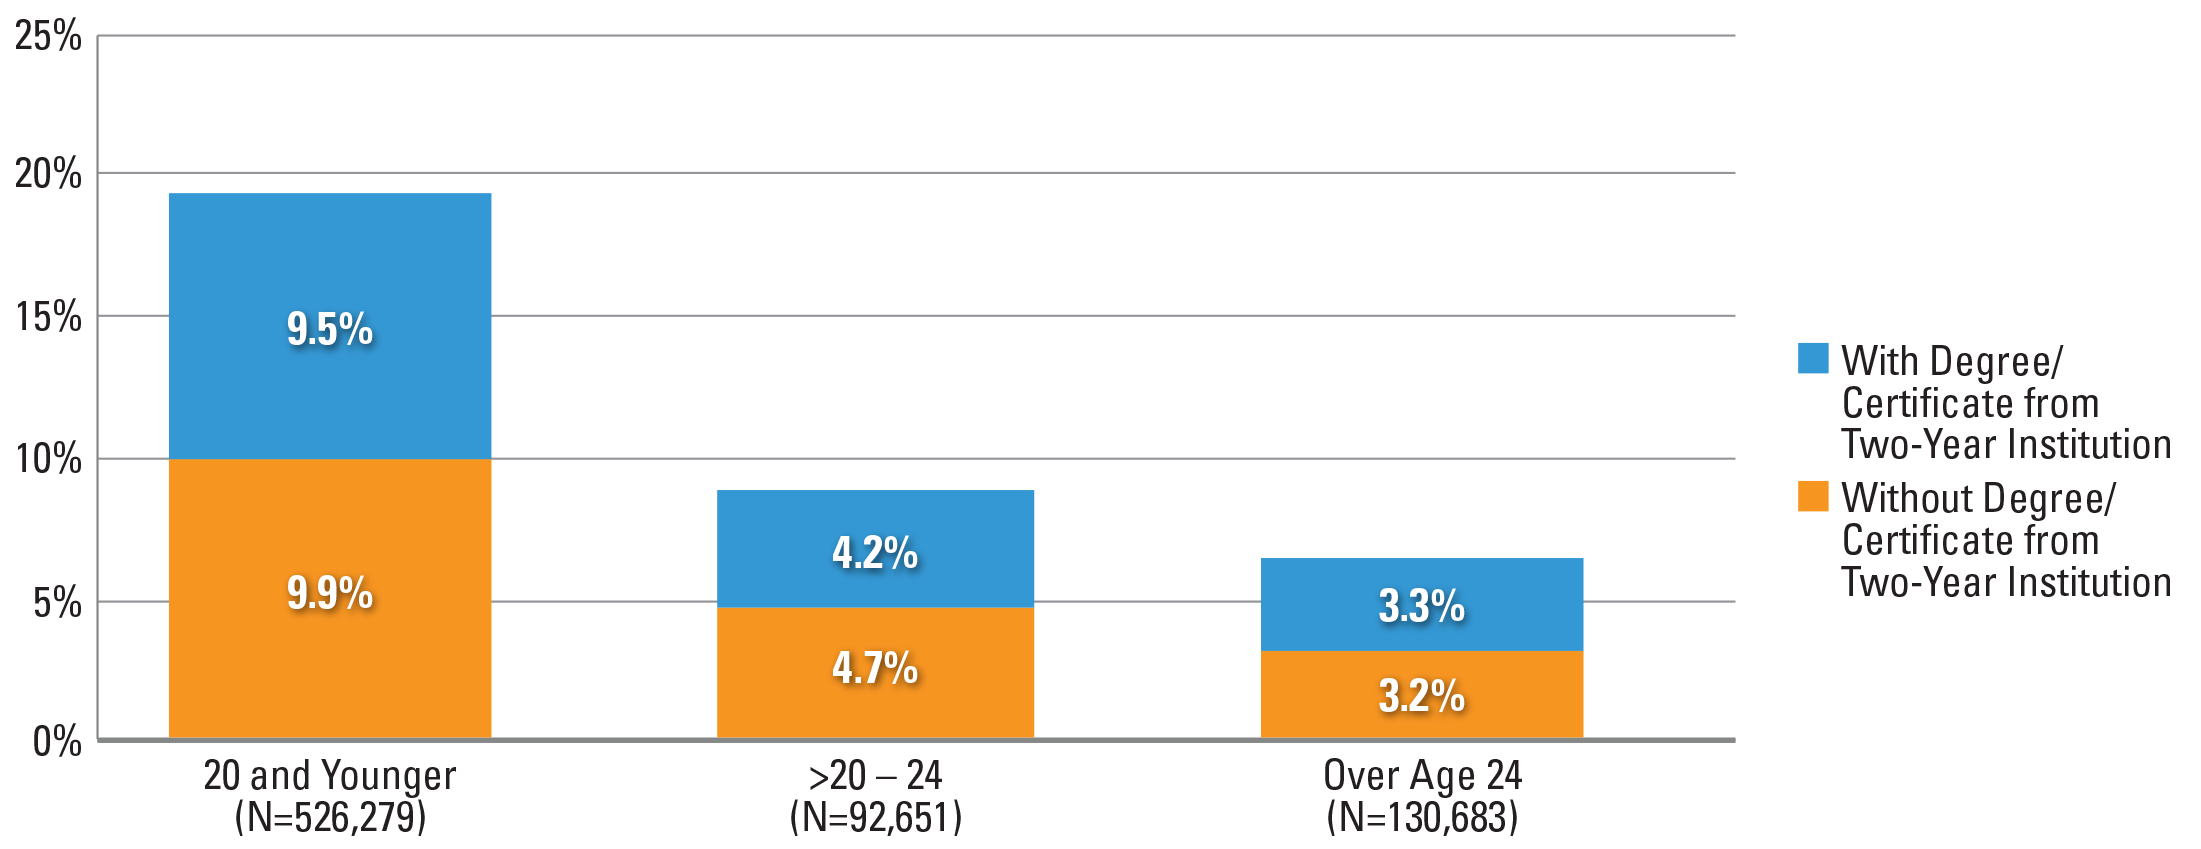
Figure 17. Over a quarter of Asian students who started in two-year public institutions (26.2 percent), and one in five white students completed at a four-year institution. These percentages were much lower for black and Hispanic students: just about one in 10 black students, and one in eight Hispanic students completed at a four-year institution (9.5 percent and 13.3 percent, respectively). Among Asian students, more students completed at a four-year institution without first completing a degree or certificate from the starting two-year institutions (14. 9 percent and 11.3 percent, respectively). The same pattern was also observed among black students. Hispanic students were more likely to complete at a four-year institution with a degree or certificate from the starting two-year institutions than without (7.2 percent and 6.0 percent, respectively).
Figure 18. Six‐Year Outcomes and First Completion for Students Who Started at Two‐Year Public Institutions by Age at First Entry (N=749,613)*
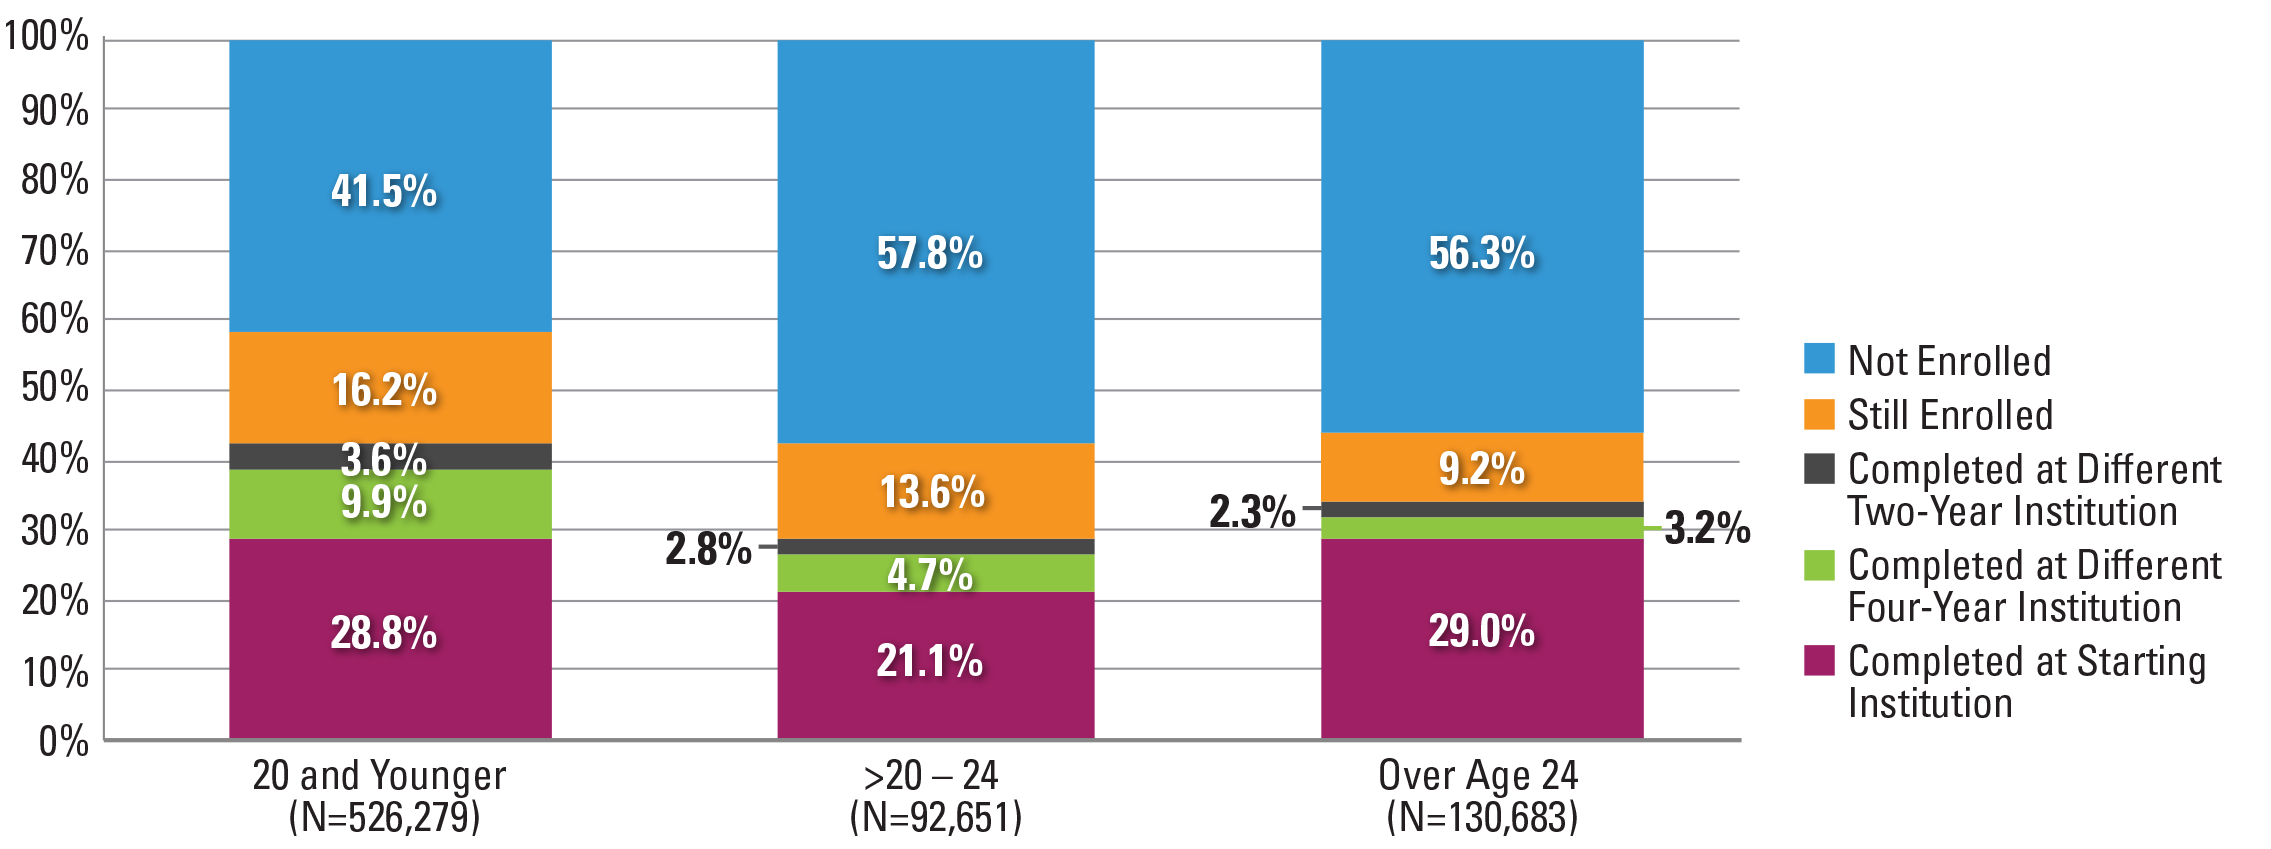
Note: Students with missing birth date data were excluded from the above figure.
*This figure is based on data shown in Appendix C, Table 43.
Figure 18. In terms of the results disaggregated by age, traditional-age students had the highest completion rate (42.4 percent) and the lowest stop-out rate (41.5 percent). This is followed by adult learners at 34.5 percent and delayed entry students at 28.6 percent. Delayed entry students and adult learners were more likely to stop-out by the end of six years than complete a credential.
Figure 19. Completion at Four-Year Institutions for Students Who Started at Two‐Year Public Institutions by Age at First Entry (N=749,613)*
Note: Students with missing birth date data were excluded from the above figure.
*This figure is based on data shown on Appendix C, Table 43.
Figure 19. Traditional-age students were twice as likely to complete a four-year degree or credential than any other age group. Regardless of age, half of those who completed a four-year degree did so without a two-year credential.
Figure 20. Six‐Year Outcomes and First Completion for Students Who Started at Two‐Year Public Institutions by Gender and Age at First Entry (N=708,632)*
Note: Students with missing birth date or gender data were excluded from the above figure.
*This figure is based on data shown in Appendix C, Table 45.
Figure 20. Similar to the national and four-year results, women overall completed a two-year credential at higher rates than men. The gap in completion rates between traditional-age students and adult learners was smaller among men than women. Among men, 39.9 percent of traditional-age students and 34.1 percent of adult learners finished a degree or certificate within six years, a gap of 5.8 percentage points. For women, the gap was 10.4 points (46.1 percent and 35.7 percent, respectively).
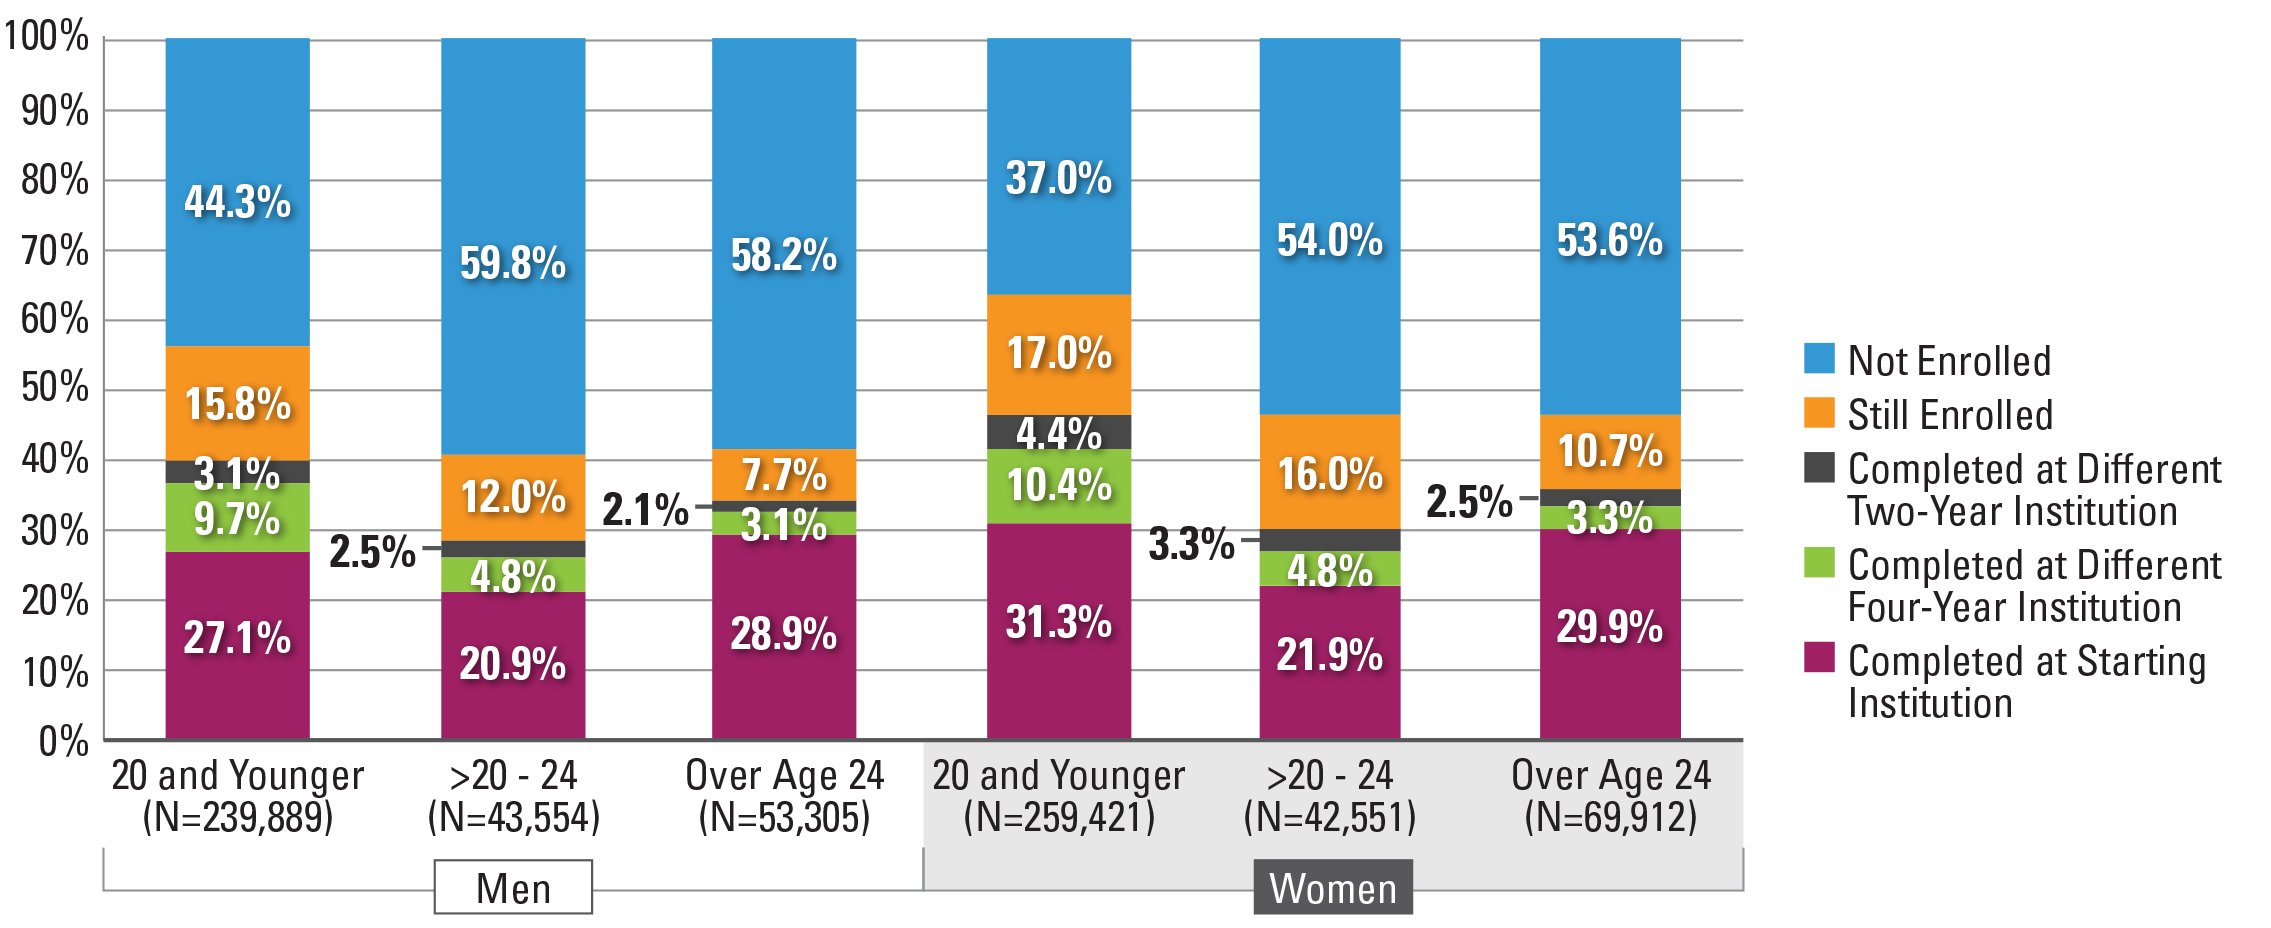
Figure 21. Six-Year Outcomes and First Completion for Students Who Started at Two-Year Public Institutions by Race and Ethnicity and Gender (N=523,530)*
Note: Students with missing birth date data were excluded from the above figure.
*This figure is based on data shown on Appendix C, Table 44.
Figure 21. In terms of race and ethnicity by gender differences, Asian women (54.5 percent) showed the highest completion rate, while black men (25.8 percent) had the lowest completion rates. Black and Hispanic men as well as black women were more likely to stop-out at the end of the study period than to complete a credential.
Outcomes for Students who Started at Four-Year Private Nonprofit Institutions
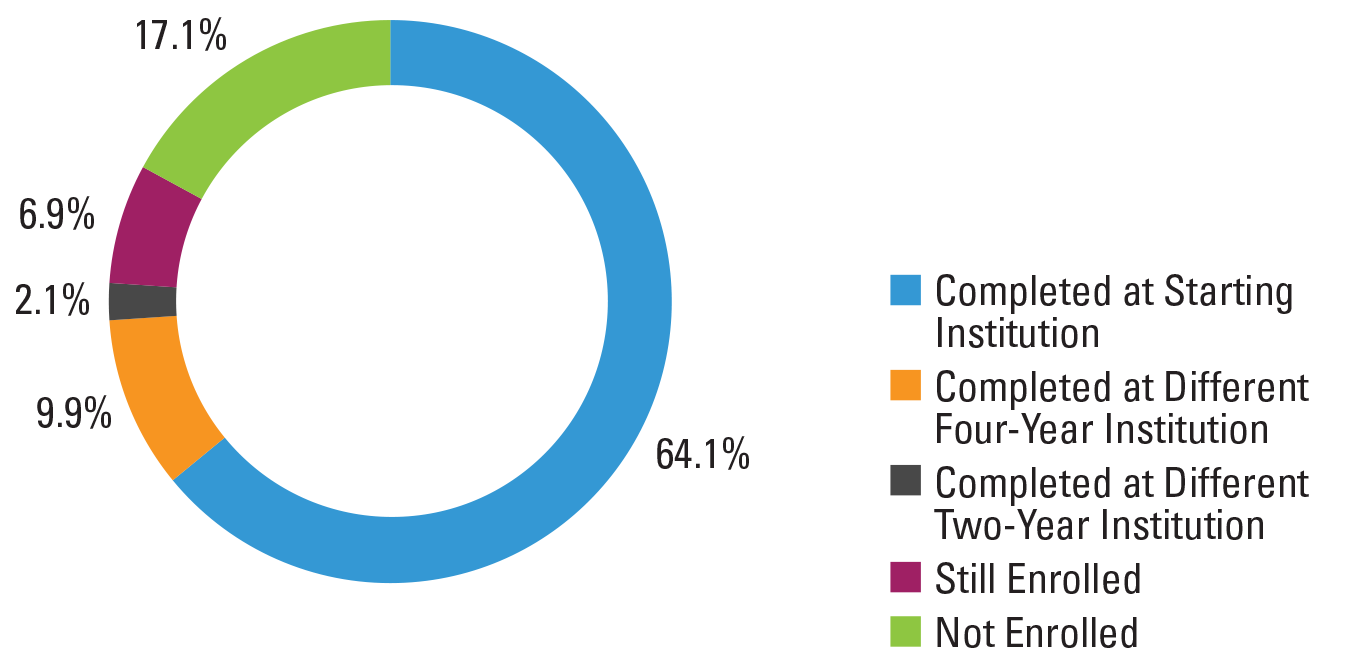
Overall, students who started at four year private nonprofit institutions represented 19.5 percent of the fall 2012 cohort. A total of 76.1 percent of the students who started at these institutions completed a postsecondary credential within six years. Of the students who completed a credential, over four in five (84.2 percent) completed at their starting institution.
Figure 22. Six‐Year Outcomes for Students Who Started at Four‐Year Private Nonprofit Institutions (N=442,773)*
*This figure is based on data shown in Appendix C, Table 51.
*The total completion rate for students who started at four-year private nonprofit institutions is 76.06%.
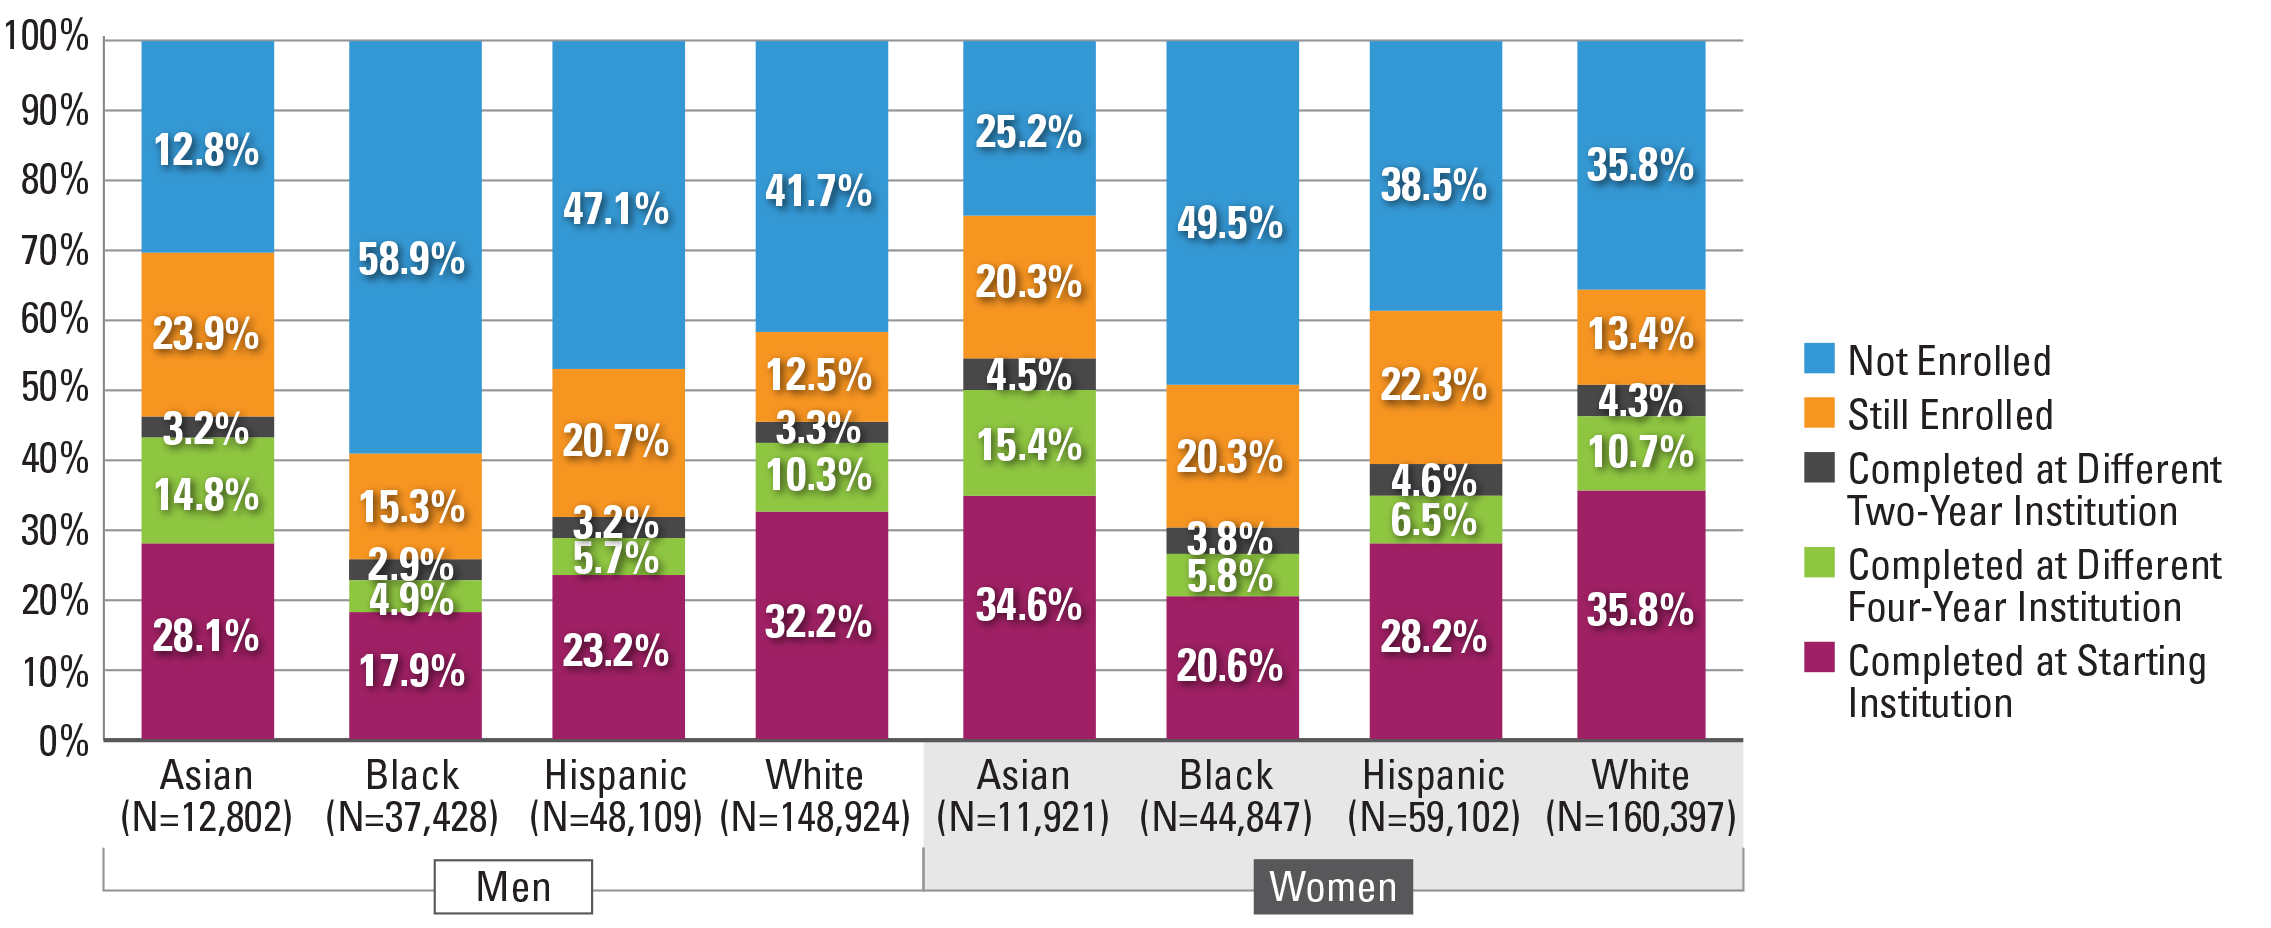
Figure 23. Six-Year Outcomes for Students Who Started at Four-Year Private Nonprofit Institutions by Race and Ethnicity (N=323,937)*
*This figure is based on data shown in Appendix C, Table 53.
*See Appendix C, Table 53b for completion outcomes of other race and ethnicity categories (e.g., non-resident alien, American Indian/Alaskan Native, and Native Hawaiian/Pacific Islander).
Figure 23. Similar to the overall, four-year public, and two-year public results, Asian students had the highest overall completion rate at 86.2 percent, followed by white students (82.1 percent), Hispanic students (72.3 percent) and black students (56.2 percent). Black and Hispanic students had much higher completion rates at four-year private nonprofit institutions than at four-year or two-year public institutions.
Figure 24. Six-Year Outcomes for Students Who Started at Four-Year Private Nonprofit Institutions by Gender and Race and Ethnicity (N=313,978)*
Note: Students with missing gender data were excluded from the above figure.
*This figure is based on data shown in Appendix C, Table 56.
Figure 24. In terms of the outcomes disaggregated by race, ethnicity and gender, the patterns were similar to results from other institution types, where Asian women had the highest completion rate (88.7 percent) and black men had the lowest completion rate (50.1 percent). However, the completion rate for black men represents the only instance where they are more likely to complete a credential (50.1 percent) than to stop-out (36.6 percent).
Figure 25. Six-Year Outcomes for Students Who Started at Four-Year Private Nonprofit Institutions by Gender and Age at First Entry (N=415,880)*
Note: Students with missing birth date or gender data were excluded from the above figure.
*This figure is based on data shown in Appendix C, Table 57.
Similar to previous outcomes, results disaggregated by gender and age show that among traditional-age and delayed entry students, women generally outperform their male counterparts. Among adult learners completion rates are very similar among men and women (61.0 percent and 60.5 percent, respectively).
Outcomes for Students who Started at Four-Year Private For-Profit institutions
Four-year private for-profit institutions represent the starting point for 2.3 percent of the students in the fall 2011 cohort. Among all institution types, students who started at four-year private for-profits had the lowest total completion rate (37.3 percent), with 26.4 percent completing at their starting institution and 10.9 percent completing at a different institution.
Figure 26. Six‐Year Outcomes for Students Who Started at Four‐Year Private For‐Profit Institutions (N=48,178)*

*This figure is based on data shown in Appendix C, Table 63.
*The total completion rate for students who started at four-year private for-profit institutions is 37.3%.
Figure 27. Six‐Year Outcomes for Students Who Started at Four‐Year Private For‐Profit Institutions by Age at First Entry (N=48,088)*
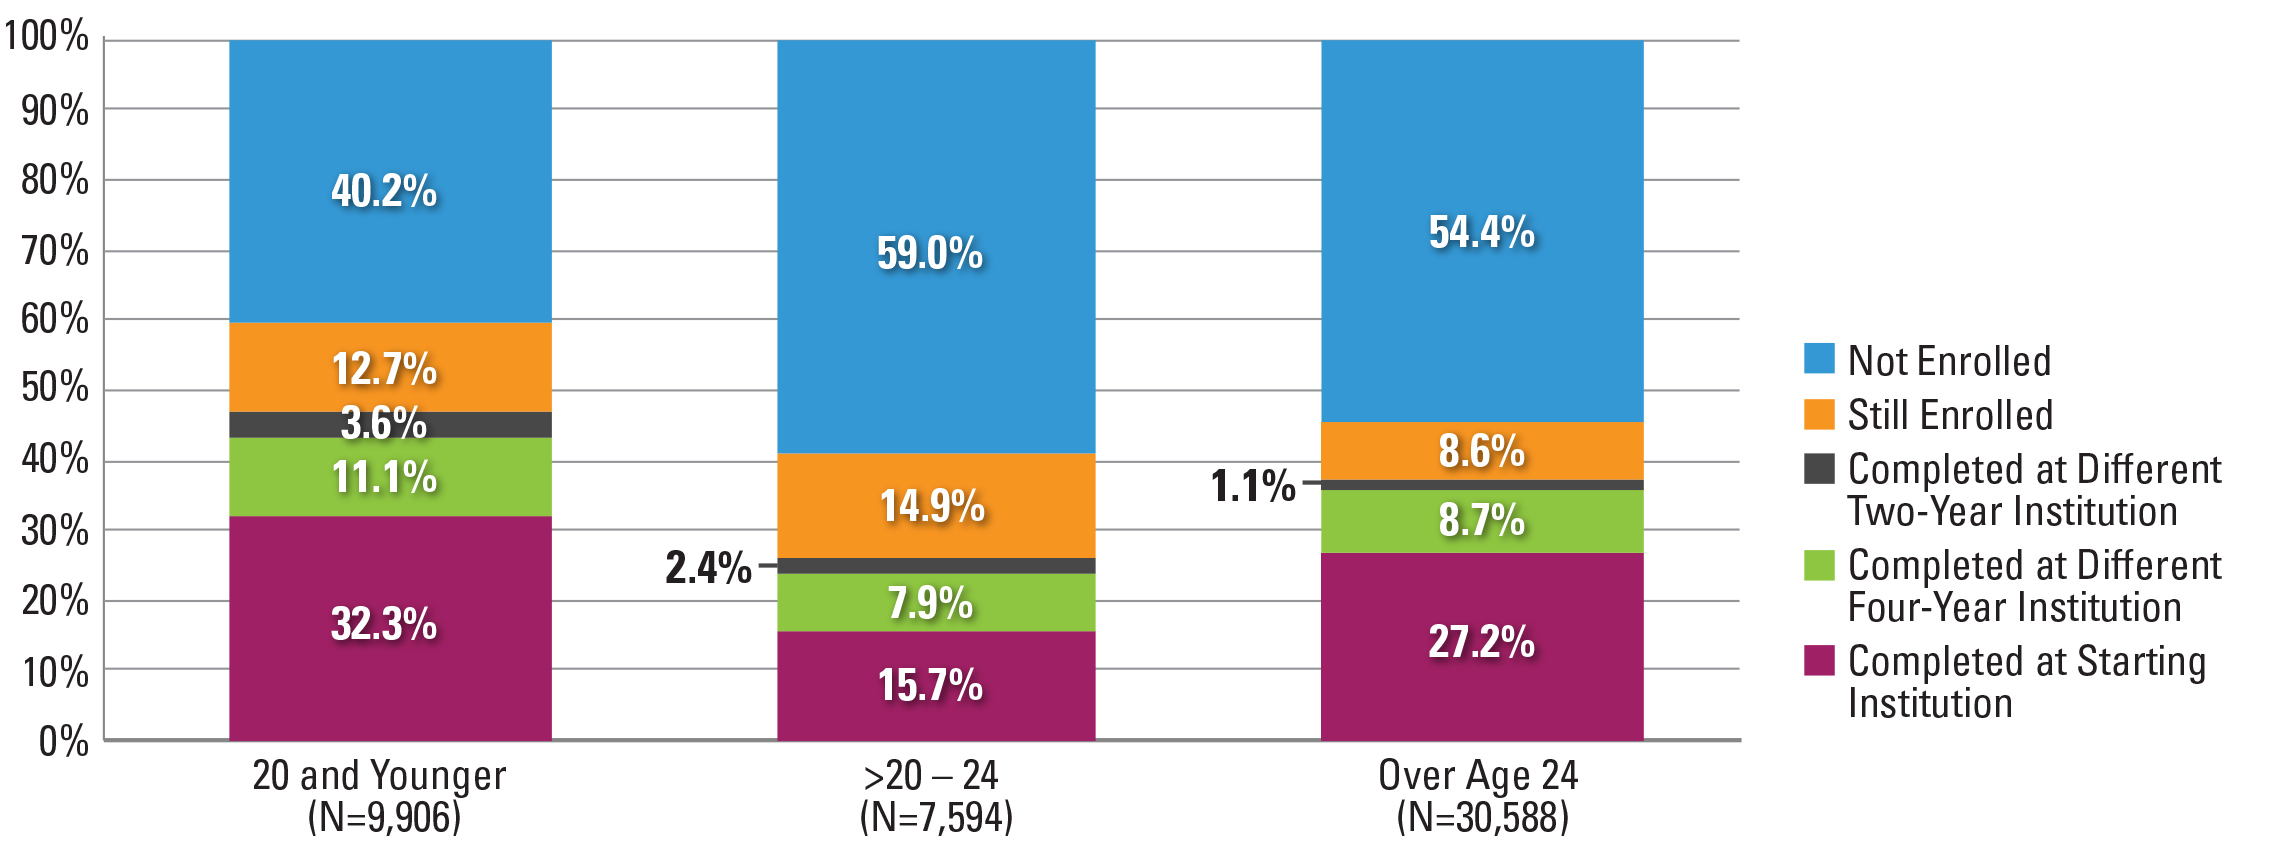
Note: Students with birth date data missing were excluded from the above figure.
*This figure is based on data shown in Appendix C, Table 66.
Figure 27. High completion rates among traditional-age students (47.0 percent), as discussed in previous sections, remained consistent at four-year private for-profit institutions. Both delayed entry students and adult learners had high stop-out rates, where over one in two students stopped out by the end of the study period.
Figure 28. Six‐Year Outcomes for Students Who Started at Four‐Year Private For‐Profit Institutions by Gender and Age at First Entry (N=46,588)*
Note: Students with missing gender data were excluded from the above figure.
*This figure is based on data shown in Appendix C, Table 56.
Figure 28. In terms of gender, a higher proportion of men than women stopped out, mainly stemming from the delayed entry and adult learner students, where over one in two students for both men and women end up stopping out by the end of the study period. Among the three age groups, regardless of gender, delayed entry students had lower completion rates than their traditional-age and adult learner counterparts.
Completion across State Lines
Figure 29. Completion Rates at Different Institutions Across State Lines by Enrollment Intensity (N=2,211,755)*
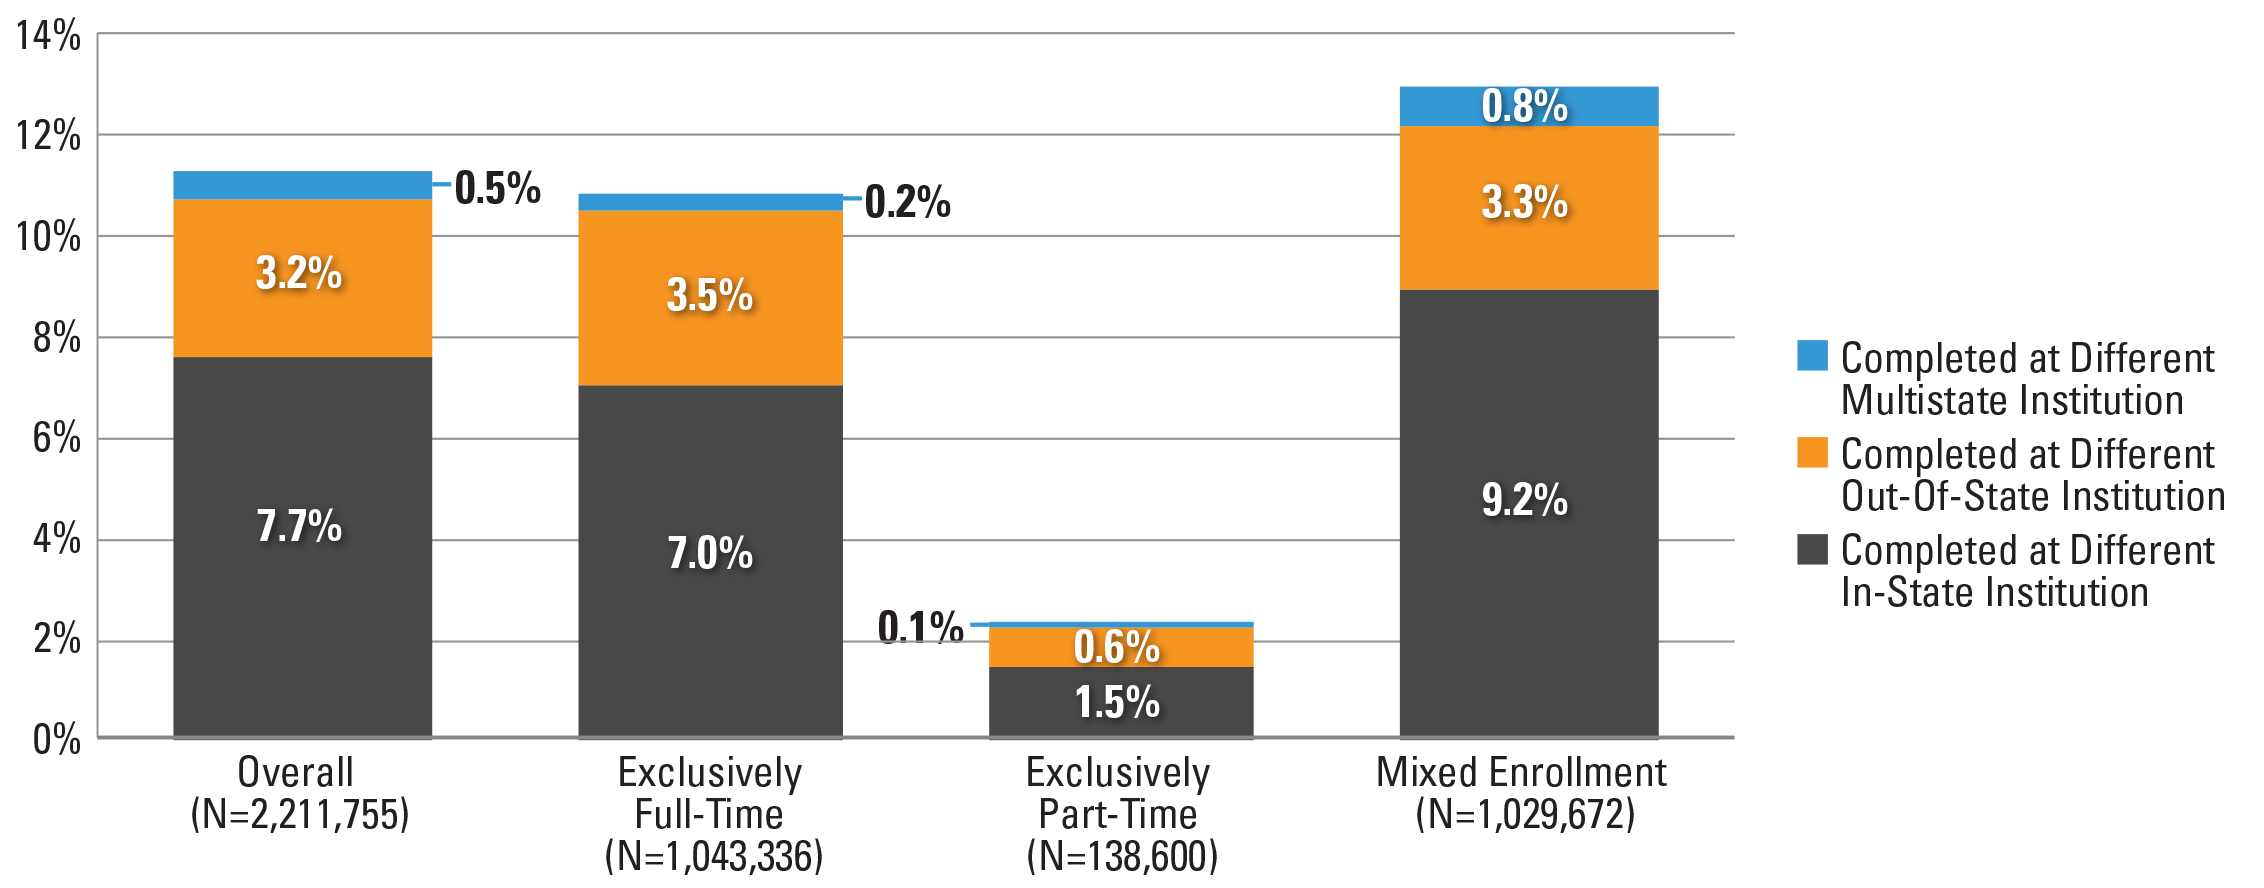
Note: Students who started at a multistate institution were excluded from the above figure.
*This figure is based on data shown in Appendix C, Table 70.
Figure 29. Overall, 11.4 percent of all students in the 2012 cohort completed their first credential at an institution other than their starting institution, including 7.7 percent at an institution in the same state where they started college, 3.2 percent in a different state, and 0.5 percent at a multistate institution. In other words, among those who completed at a different institution, more than one in four had transferred across state lines and completed at an institution out-of-state (28.3 percent, where multi-state institutions are not counted as out of state). This rate was highest among students who enrolled full-time, with 32.5 percent of those who completed elsewhere having done so in a different state.
Figure 30. Completion Rates at Different Institutions Across State Lines by Age at First Entry (N=2,197,348)*
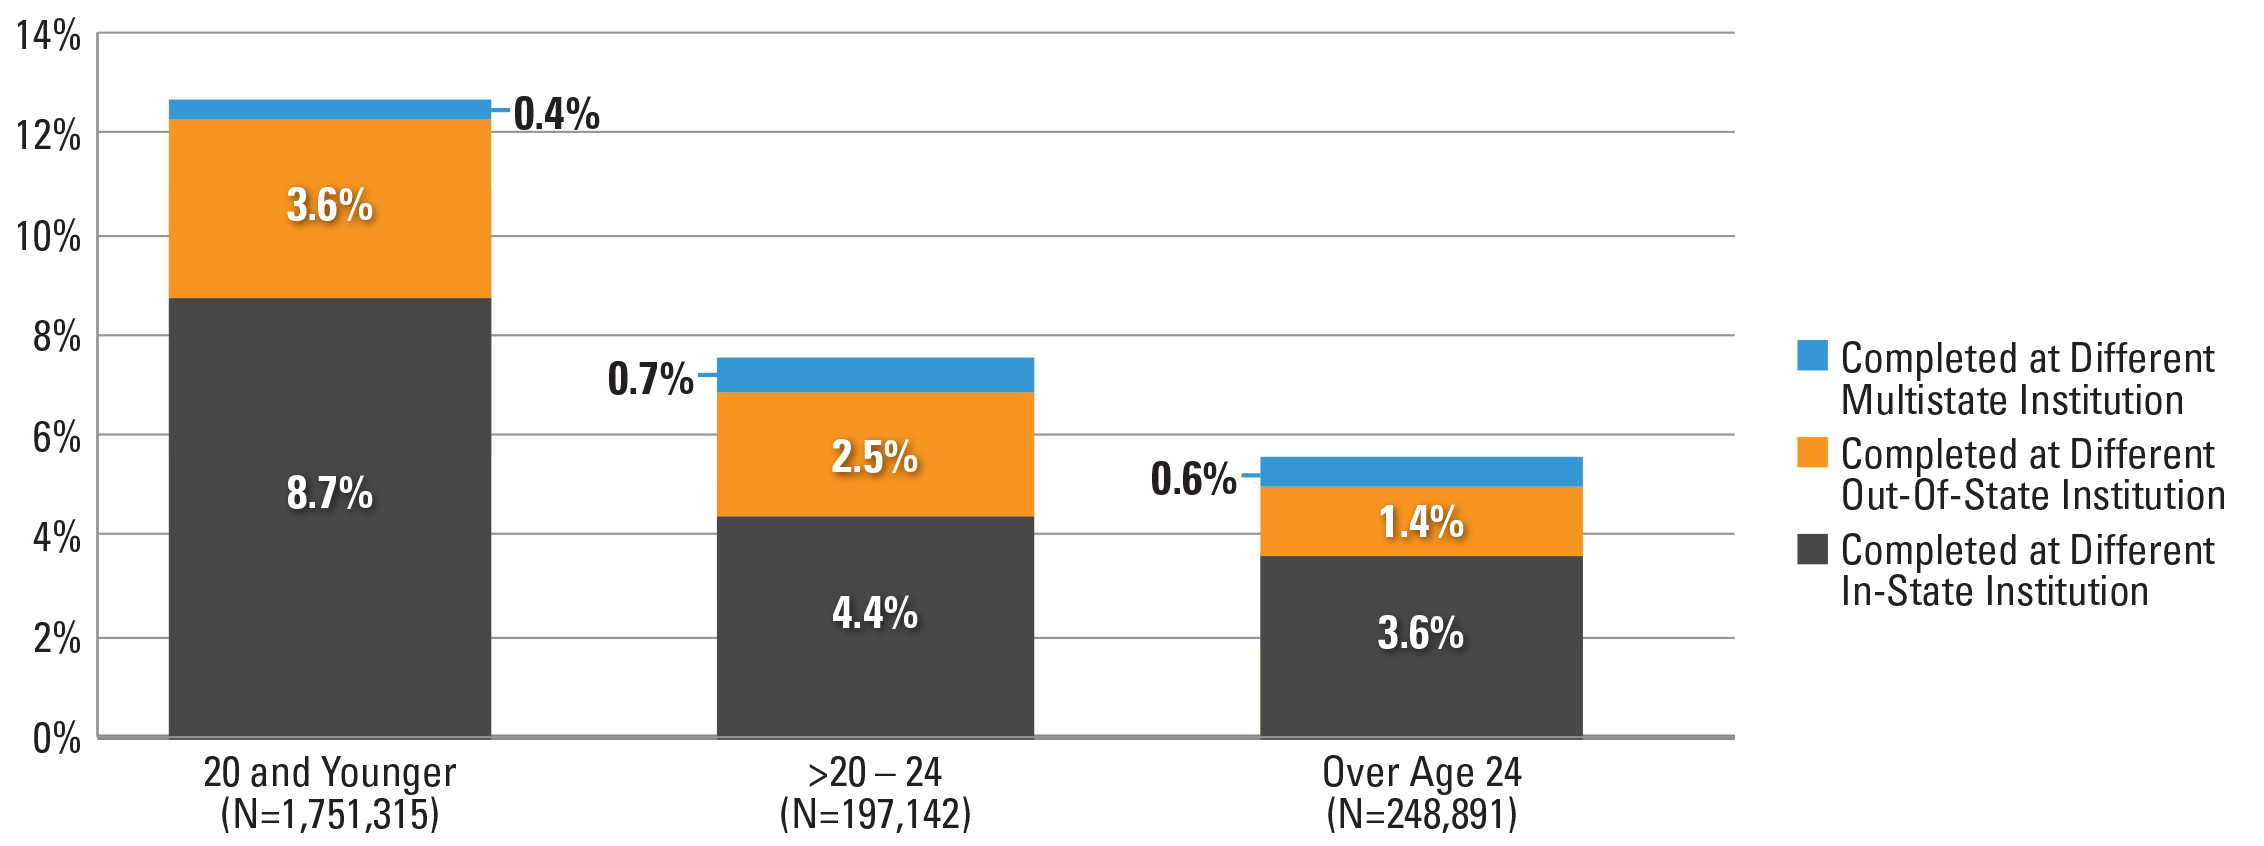
Note: Students with missing birth date data and those who started at a multistate institution were excluded from the above figure.
*This figure is based on data shown in Appendix C, Table 72.
Figure 30. Age was negatively associated with different out-of-state completions and different in-state completions. Specifically, younger, traditional-age students were more likely to complete at a different in-state (8.7 percent) and out-of state institution (3.6 percent) than delayed entry students or adult learners.
Appendix A: Methodological Notes
This report describes six-year college student success outcomes, focusing primarily on degree and certificate completion of a cohort of first-time-in-college, degree-seeking students who started their postsecondary education at U.S. colleges and universities in the fall of 2012. The study follows this cohort for six years, through June 30, 2018. The results presented in the report center on student outcomes over the six-year span, including completion (i.e., receipt of any postsecondary credential by the end of the study period), persistence (i.e., having enrollment records at any postsecondary institution during the last year of the study period), and stop-out without completion (i.e., having no enrollment records at any postsecondary institution during the last year of the study period). The report mainly focuses on students’ first completions, with further distinctions drawn between completions awarded at the institution where a student first enrolled (his or her starting institution) and those awarded at an institution other than their starting institutions. For students who started at a two-year public institution, this report also presents an overview of their completions at a four-year institution, either as a first completion (i.e., those who completed a four-year degree without having first earned a credential at a two-year institution1) or as a subsequent degree after a first completion awarded in the two-year sector. In addition to results on degree and certificate completion rates by enrollment intensity, age group, gender, race and ethnicity, and starting institution type, the report includes results on completion across state lines and for students who started at multistate institutions.
1 Throughout this report, “two-year institution” is used broadly to designate institutions offering both associate’s degrees and less-than two-year degrees and certificates.
National Coverage of the Data
The Clearinghouse is a unique and trusted source for higher education enrollment and degree verification. Since its creation in 1993, the participation of institutions nationwide in Clearinghouse data-collection programs has steadily increased. Currently, Clearinghouse data include more than 3,600 colleges and 96.8 percent of U.S. college enrollments. The Clearinghouse has a 25-year track record of providing automated student enrollment and degree verifications. Because of the Clearinghouse’s unique student-level record approach to data collection, the Clearinghouse data provide opportunities for robust analysis not afforded by the more commonly used institution-level national databases.
The enrollment data used in this report provide an unduplicated headcount for the fall 2012 first-time-in-college student cohort. Clearinghouse data track enrollments nationally and are not limited by institutional and state boundaries. Moreover, because this database is comprised of student-level data, researchers can use it to link concurrent as well as consecutive enrollments of individual students at multiple institutions — a capability that distinguishes the Clearinghouse database from national databases built with institution-level data. For instance, in the National Center for Education Statistics (NCES) and the Integrated Postsecondary Education Data System (IPEDS) — one of the most widely used national data sets in postsecondary education research — concurrent enrollments remain unlinked and are counted as representing separate individuals. There are nationally representative samples (e.g., National Education Longitudinal Study, NELS:88/2000; Beginning Postsecondary Students Longitudinal Study, Educational Longitudinal Study, ELS:02; etc.) that are based on student-level data. However, samples–by definition– have their limitations in terms of the currency of the data as well as its uses. For example, a nationally representative sample cannot be used to produce regional or state-level results. The Clearinghouse data do not have those limitations because of the frequency of the data collection and the near-census national coverage.
Cohort Identification, Data Cut, and Definitions
This report examines completion, over a span of six years, for the cohort of first-time-in-college degree-seeking students who started their postsecondary studies at U.S. colleges and universities in the fall of 2012 (through June 30th, 2018). To limit the cohort to first-time undergraduate students only, the study uses data from the Clearinghouse’s enrollment reporting and DegreeVerify services to confirm that students included in the study (1) showed no previous college enrollment prior to the first day of enrollment in fall 2012 (unless such prior enrollment happened before the student turned 18 years old i.e., dual enrollment); and (2) had not completed a college degree prior to the first day of enrollment in fall 2012 (unless the degree was awarded before the student turned 18 years old). Thus, former dual enrollment students (identified as first-time college students who had enrolled in college courses while still in high school), were included in the cohort for this study (see more on former dual enrollment students below).
In defining the study cohort, it was necessary to identify a coherent set of first-enrollment records that would as closely as possible represent a starting point for the fall 2012 cohort of first-time-in-college students. To define one initial fall 2012 enrollment record, we excluded enrollment records that were either (1) not clearly interpretable within the study’s framework and data limitations; and (2) inconsistent with the experiences of first-time college enrollment that were the focus of the analysis.
In addition, students who first enrolled in postsecondary study outside the U.S. or its territories (e.g., Guam, Puerto Rico, the U.S. Virgin Islands), or who started at non-IPEDS institutions, were excluded from the study.
Because our outcome of interest was completion, we chose analyses on degree-seeking students only. As a result, we attempted to exclude non-degree-seeking, casual course takers from the cohort. For students who first enrolled in four-year institutions, non-degree-seeking students were defined as those who had only one enrollment record with intensity of less than half time. Students who started at two-year institutions were excluded as non-degree-seeking students, if they failed to meet one of the following criteria: (1) one or more full-time enrollment before August 11, 2013; and (2) one or more three-quarter time status before December 31, 2013; and (3) two enrollment terms with half-time status before December 31, 20132.
In summary, the study cohort included students who fulfilled all of the following conditions:
- Enrolled in a Title IV institution in fall 2012.
- Did not have a previous enrollment record, as shown in the Clearinghouse data , prior to the first day of enrollment in the fall of 2012, unless the previous enrollment record was before the student turned 18 years old (dual enrollment);
- Did not receive any degree or certificate from a postsecondary institution prior to the first day of enrollment in fall 2012, according to Clearinghouse data unless the award date was before the student turned 18 years old (dual enrollment);
- Had at least one legitimate enrollment status throughout the study period; that is, enrolled for at least one term with full-time, part-time (i.e., halftime or less than half-time), or withdrawal status3;
- Showed intent to seek a degree or certificate. That is:
- For students who started at four-year institutions, enrolled at least one term with an intensity of half-time or higher.
- For students who started at two-year institutions, either:
- Enrolled full time for at least one term before August 11, 2013, or
- Enrolled three-quarter time for at least one term or half time for any two terms before December 31, 2013;
2 We excluded 307,423 students who began at two-year institutions, as non-degree-seeking students as a result.
3The Clearinghouse receives enrollment status data as full-time, half-time, less-than-half-time, withdrawal, or other statuses from its participating institutions
Change in Race and Ethnicity Data Coverage
The Research Center’s first completions report that included breakdowns by race and ethnicity (Signature Report 12b, April, 2016) was based on data collected from a random, nationally representative sample of institutions. In this report, increased reporting of race and ethnicity data allowed us to include nearly all institutions. However, the percentage of students with unknown or missing race and ethnicity data was 20.5 percent.
Former Dual Enrollment Students
The cohort used in this study includes former dual enrollment students: first-time college students who had previously taken dual enrollment courses. These are the students who enrolled in college courses prior to fall 2012 while still in high school. Students were identified as former dual enrollment students if their enrollment or degree record prior to fall 2012 was before the student turned 18 years old. Former dual enrollment students represent 18 percent of the fall 2012 cohort. As a proportion of the sample for each sector, former dual enrollment students represent 21 percent of the students who started in four-year public institutions, 15 percent of the students who started in two-year public institutions and 16 percent of those who started in four-year private nonprofit institutions. Only 6 percent of the students who started in four-year private for-profit institutions had prior dual enrollments.
3 The Clearinghouse receives enrollment status data as full-time, half-time, less-than-half-time, withdrawal, or other statuses from its participating institutions
Enrollment Intensity
In this report, enrollment intensity is classified as exclusively full time, exclusively part time, or mixed enrollment (including both full-time and part-time enrollments) throughout the study period. Each of the enrollment type is based on students’ enrollments across all terms in which the student was enrolled. Hence, the report does not exclude stop‐outs through the first completion or, for non-completers, through the entire study period. In establishing students’ enrollment intensity in this way, enrollments during summer terms (defined as terms with both the start date and the end date falling between May 1 and August 31 in any given year) and short terms (defined as terms lasting less than 21 days) were excluded from consideration.
For terms in which a student showed concurrent enrollment records (i.e., records that overlapped by 30 days or more), the two highest-intensity enrollments were considered. For example, a student concurrently enrolled half-time at two institutions was categorized as enrolled full-time for that term. In doing this, we create one single enrollment record from a set of concurrent enrollment records. The enrollment status for the single enrollment record is defined as full-time if (1) for terms with concurrent enrollments, the two highest-status enrollment records included at least one full-time enrollment, or one three quarter-time enrollment and one at least less than half-time enrollment; or (2) for terms with concurrent enrollments, the two highest-status enrollment records both reflected half-time enrollment. The enrollment status for the single enrollment record is defined as half-time, if for terms with concurrent enrollments, the two highest-status enrollment records included some combination of half-time and less than half-time enrollments, but no full-time enrollment, and no more than one half-time enrollment.
Overall, for each term under consideration (i.e., all terms except summer terms and short terms − less than 21 days − up through the first completion, or, if no completion, throughout the entire study period), the “exclusively full-time enrollment” designation was assigned to students whose enrollment showed exclusively full-time enrollment for all terms. The “part-time enrollment” designation was assigned to students whose enrollment for each term under consideration showed exclusively three quarter-time, half-time or less than half-time enrollment.
The category of mixed enrollment was applied to students who showed a combination of full-time and part-time enrollments across the terms under consideration. Finally, students who showed records indicating withdrawal but no full-time or part-time enrollments were randomly assigned to an enrollment intensity category.
Age Group
The study focused on three age groups: 20 years old or younger, between 21 and 24 years old, and older than 24 years old. The first group (20 years old or younger) is defined to approximate enrollment immediately after high school, while the second group (over age 20 through 24) is meant to represent students who delay entry into postsecondary education for a few years after finishing high school. The final category (older than 24 years old) included adult learners (defined as those who were older than 24 when they began college). For all categories, we define age as of the end of the 2012 calendar year (December 31, 2012). Students with birthdates of December 31, 1992, or later were placed in the first category. Those with birthdates between December 31, 1988, and December 30, 1992, inclusively, were categorized in the second group (“over age 20 through 24”). Students with birthdates before December 31, 1988, were placed in the final category (“over 24 years old”).
Concurrent Completion
For this report, we examined completion by first-time students at either two-year or four-year institutions. We defined completion as having obtained a degree or certificate at any institution within the six-year study period (i.e., by June 30, 2018). Clearinghouse data provide a unique headcount of U.S. college enrollments during each term, which allows for the tracking of individuals including those with concurrent completion. In preparing data for this report, a small number of individuals showed more than one completion awarded at multiple institutions on the same day. In these instances, a primary completion record was selected using decision rules specific to the sector of the student’s starting institution.
The first set of decision rules was applied to students with concurrent completions who started at a two-year institution:
- Concurrent Completions at Two Different Two-Year Institutions
- Same institution over different institution: Completions at the starting institution were selected over completions at other institutions.
- Random selection: If the first decision rule did not result in a single completion record being selected, then a completion record was selected at random.
- Concurrent Completions at a Two-Year Institution and a Four-Year Institution
- Two-year then four-year: The two-year degree completion was considered the first completion and the four-year degree completion was considered a subsequent completion.
- Concurrent Completions at Two or More Four-Year Institutions
- Random selection: If a student started at a two-year institution but later completed at two or more four-year institutions concurrently, then a completion record was selected at random.
The second set of decision rules was applied to students who started at four-year institutions and later showed concurrent completion records:
- Same institution over different institution: Completions at the starting institution were selected over completions at other institutions.
- Four-year over two-year: If the first decision rule did not result in the selection of a single completion record, then completions at four-year institutions were selected over those at two-year institutions.
- Random selection: If neither of the first two decision rules resulted in the selection of a single completion record, then a completion record was selected at random.
Imputation of Values for Gender
The Clearinghouse’s coverage of student gender has increased dramatically for enrollments occurring in recent years. However, imputation of gender for the majority of enrollment records is still necessary in order to use the data for research studies using older cohorts. To meet this need, the Research Center developed an imputation process based on first names. Previously submitted name gender pairs throughout the Clearinghouse database are used to determine the probability of any first name being associated with either gender. To increase the accuracy of the imputation process, the Research Center also draws on name‐gender data from the Social Security Administration (SSA) and the U.S. Census Bureau.
Because the Clearinghouse collects transactional data, its data contain many more unique first names than other sources. International students may also contribute to the large variety of first names submitted to the Clearinghouse. The imputation used only those pairs in which the name occurred in at least two instances and was associated with a single gender in at least 95 percent of the instances.
The SSA and Census data sets were used to ensure that name‐gender pairs were consistent across every data set in which they occurred and to enhance the imputation process by contributing name‐gender pairs that did not occur in the Clearinghouse data. Institutions reported student gender to the Clearinghouse for approximately half of all students included in this report. The imputation process that yielded additional gender codes produced a total gender coverage rate of 94 percent.
Imputation of Missing Data on Graduation Records
The Clearinghouse collects graduation information from its participating institutions via two data reporting services: Enrollment Reporting and DegreeVerify. Enrollment Reporting has higher data coverage rates, but includes only basic completion information such as graduation indicator and the date of graduation. For the fall 2012 cohort, Enrollment Reporting covered 94 percent of all the students in Title IV degree-granting institutions listed in IPEDS (including 99 percent of the students in public institutions, 92 percent in private nonprofit institutions, and 55 percent in private for-profit institutions). DegreeVerify includes enhanced information on completions, including degree title, major, level, and CIP code, but covered only 94 percent of enrollments in 2012. Institutions may participate either in Enrollment Reporting alone or in both services. Completions data for this report included information drawn from either service. An analysis conducted by the Clearinghouse on the 2012 cohort found that graduation data for the institutions that participated in DegreeVerify were relatively more complete for some of the years covered in this study than those for institutions that participated only in Enrollment Reporting, biasing completion rates slightly downwards for institutional sectors with lower participation rates in DegreeVerify.
To correct for this bias, the Research Center conducted a randomized imputation procedure for missing graduation data among students at non-DegreeVerify institutions who were no longer enrolled but for whom outcome data were missing (that is, for whom the institution had reported neither a graduation nor a withdrawal status in their Enrollment Reporting). This involved comparing the Enrollment Reporting and DegreeVerify records for institutions that participated in both services and estimating, for each institution type, the average percentage of students with missing outcomes in the enrollment data who had a reported graduation in the DegreeVerify data. We further specified these underreporting rates by taking into account student age and the academic year. We then used random assignment of graduation outcomes to students with missing data at the institutions that did not participate in DegreeVerify to match each institution’s underreporting rate for each student age group and for every year of the study to the average rate for similar students at institutions of the same type that did participate in DegreeVerify.
|
Percentage of the Starting Cohort With an Imputed Completion |
|
| Two-Year Private For-Profit | 0.14% |
| Two-Year Private Nonprofit | 0.44% |
| Two-Year Public | 0.22% |
| Four-Year Private For-Profit | 0.11% |
| Four-Year Private Nonprofit | 0.28% |
| Four-Year Public | 0.15% |
| Total | 0.20% |
This imputation was performed only for students with missing outcomes data at institutions that did not participate in DegreeVerify. It is based on the typical underreporting of graduation outcomes from similar institutions that participate in both Enrollment Reporting and DegreeVerify. The table below shows, for each institution type, the percentage of the starting cohort for whom graduation data were imputed:
Imputation of Missing Data through Weighting by State and Institution Type
The institutions participating in the Clearinghouse Enrollment Reporting service (i.e., providing the data coverage) is not 100 percent of all institutions for any individual year. Therefore, to account for possibilities of not capturing a student’s enrollment outcome because of non-coverage of Clearinghouse data, the analysis weights were calculated using 2017 coverage rate of the sector, control, and state of the institution where a student was enrolled for the last enrollment record. Last enrollment record was defined based on the first completion (for completers) or the last enrollment record either before stop-out (for students who had no enrollment records during the last year of the study) or before the end of the study period (for persisters). For students who completed a degree at the starting institution or were still enrolled at the starting institution by the end of the study period, a weight = one was applied. For all other students, two weights were created and applied in this study:
For students who completed a degree or were still enrolled at a different institution by the end of the study period, a “transfer” weight was applied. The transfer weight used was an over-weight based on the coverage of the sector, control, and state of the institution in which the student was enrolled for the last enrollment record, as calculated by the formula provided below:

For students who stopped out by the end of the study period, a “missing” weight was applied. The missing weight used was an under-weight based on the coverage of the sector, control, and state of the institution in which the student was enrolled for the last enrollment record, as calculated by the formula provided below:

Data Limitations
The data limitations in this report center mainly on the data coverage, the methods used for cohort identification, and the definition of key constructs (as outlined above). The representation of private for-profit institutions in the Clearinghouse data is lower than that of other institution types, with 64 percent coverage for four-year private for-profit institutions in fall 2012 compared to 93 percent and 99 percent respectively for four-year private nonprofit institutions and four-year public institutions. Despite the challenges presented by low participation in the early years covered in this report, current Clearinghouse data nevertheless offer near-census national coverage, representing 97 percent of U.S. postsecondary enrollments. In an effort to correct for coverage gaps in this study, data were weighted (as explained above).
Data limitations resulting from the cohort identification methods used in preparing this report should also be noted. Because the Clearinghouse data on designations for class year are incomplete, the researchers identified first-time undergraduate students via two indirect measures:
- No previous college enrollments recorded in the Clearinghouse data, and
- No previous degree awarded in the Clearinghouse’s historical DegreeVerify database.
Given these selection criteria, the sample for this report may include students who had more than 30 Advanced Placement (AP) or International Baccalaureate (IB) credits. It is also possible that a small number of graduate students are included in the study cohort because of inconsistencies in the historical depth of DegreeVerify database records.
Finally, although Clearinghouse data contain some demographic information on students, historical coverage rates for the demographic data elements are uneven. Consequently, results on gender are based partially on imputed values, as described above and one in five students in the cohort had the race/ethnicity value unknown or missing. No imputation was attempted for missing race/ethnicity data.