Science & Engineering Degree Attainment – By Gender – 2013
Growth in Science and Engineering (S&E) Bachelor’s Degrees by Gender
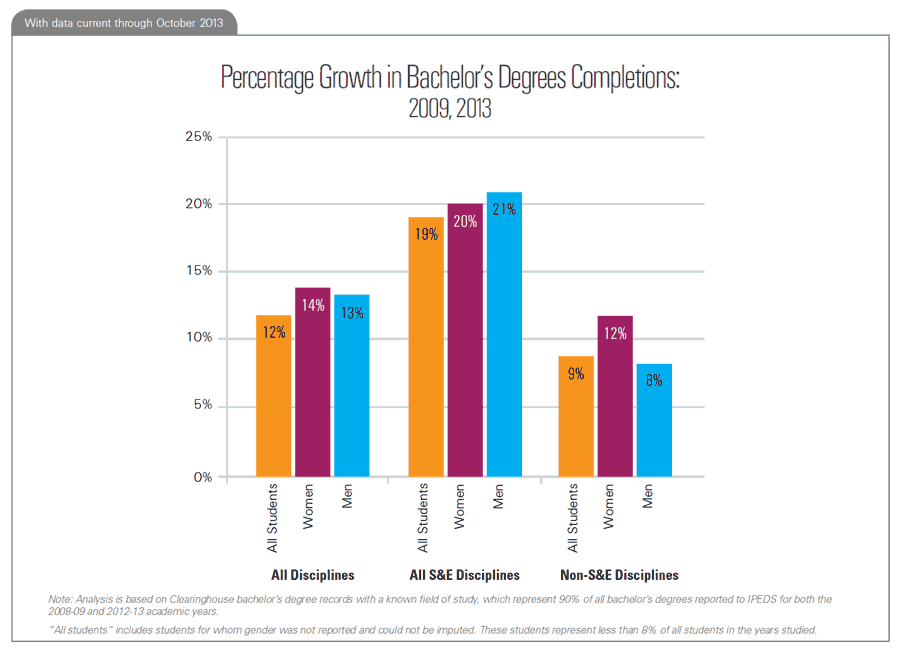
Between 2009 and 2013, S&E bachelor’s degree completions for both men and women had almost identical growth at 20% and 21%, respectively. With social sciences and psychology included, women accounted for 50% of all S&E bachelor’s degrees in both 2009 and 2013.
Bachelor’s Degrees in S&E Growing Twice as Fast as in Non-S&E Disciplines
- Over the last five years, the overall number of science and engineering (S&E) bachelor’s degree completions has grown by 19%, compared to 9% growth for non-S&E disciplines.
- Among women, S&E bachelor’s degree completions grew by 20%, compared to 12% growth for non-S&E disciplines.
- Among men, S&E bachelor’s degree completions grew by 21%, compared to 8% growth for non-S&E disciplines.
- The definition of science and engineering used in this snapshot includes social sciences and psychology and is based on classifications used by the National Science Foundation.
Women Earn Half of All S&E Bachelor’s Degrees
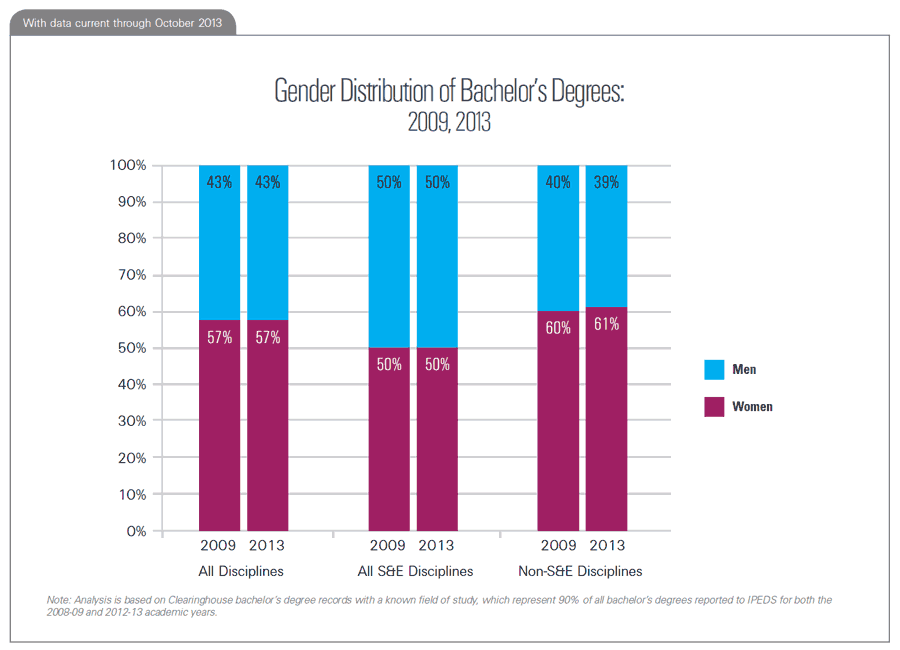
- In the 2012-13 academic year, women earned 57% of bachelor’s degrees in all disciplines, 50% of bachelor’s degrees in S&E, and 61% of bachelor’s degrees in non-S&E disciplines.
- In all three discipline categories, the percentage of bachelor’s degrees earned by women has remained largely unchanged over the last five academic years.
- The definition of science and engineering used in this snapshot includes social sciences and psychology and is based on classifications used by the National Science Foundation.
Gender Distributions in S&E Disciplines Largely Unchanged Since 2009
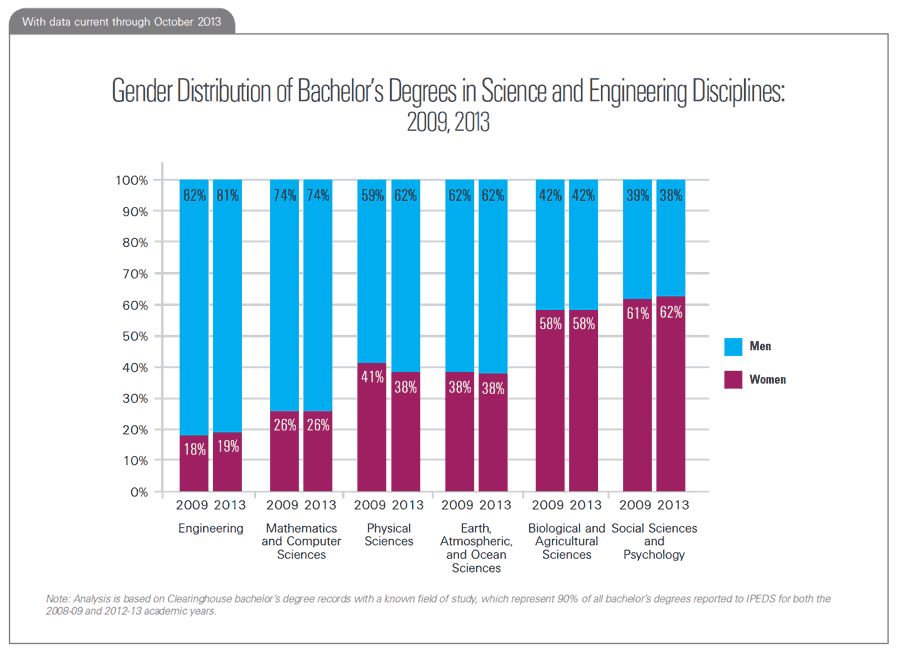
- In 2012-13, the majority of bachelor’s degrees in engineering, mathematics, computer science, and the physical sciences were completed by men.
- Women continued to earn the majority of bachelor’s degrees in the biological and agricultural sciences, social sciences, and psychology.
- With the exception of the physical sciences, the share of bachelor’s degrees earned by women in each of these disciplines has remained nearly constant since 2008-09. In the physical sciences, a decrease of three percentage points occurred over this time frame.
Growing Prevalence of S&E Bachelor’s Degrees among Both Genders
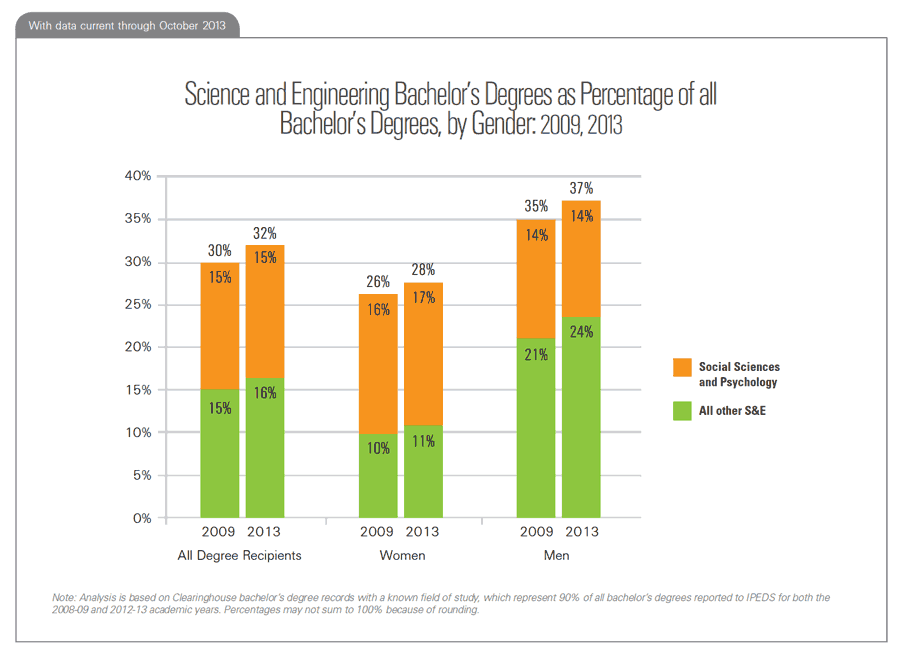
- In 2012-13, S&E bachelor’s degrees accounted for 32% of all bachelor’s degrees, up from 30% in 2008-09.
- In the 2012-13 academic year, 28% of all bachelor’s degrees earned by women were in S&E disciplines, compared to 37% of all bachelor’s degrees earned by men.
- Over the last five years, attainment of S&E degrees, as a percentage of all bachelor’s degrees, increased by two percentage points for both genders.
- Excluding social sciences and psychology, the remaining S&E disciplines accounted for 11% of all bachelor’s degrees earned by women, and 24% of all bachelor’s degrees earned by men in 2012-13.
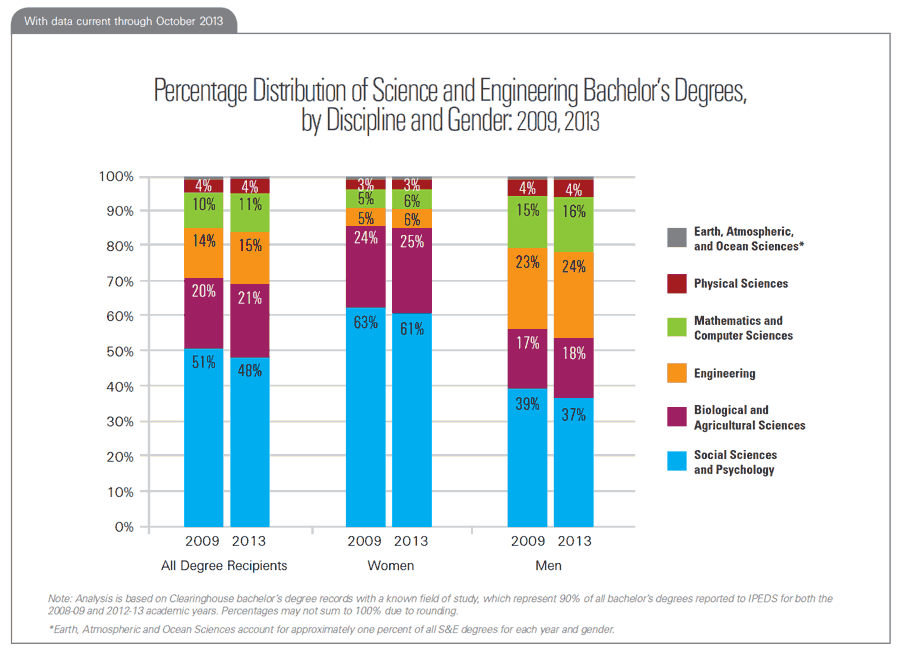
Within S&E, Choice of Discipline Varies by Gender
- In 2012-13, women and men each completed the largest share of their S&E bachelor’s degrees in social sciences and psychology: 61% of the degrees completed by women compared to 37% of the degrees completed by men.
- However, over the last five years, the percentage of S&E bachelor’s degrees accounted for by social sciences and psychology has slightly decreased for each gender.
- Biological and agricultural sciences was the second most common S&E category for women, accounting for 25% of their S&E bachelor’s degrees in 2012-13.
- Engineering was the second most common S&E category for men, accounting for 24% of their S&E bachelor’s degrees in 2012-13.
Sponsored in part by the Lumina Foundation, committed to enrolling and graduating more students from college.
Data analysis performed by Jason DeWitt, Research Manager, and Travis Maciejewski, Research Associate.
