

Persistence & Retention – 2017
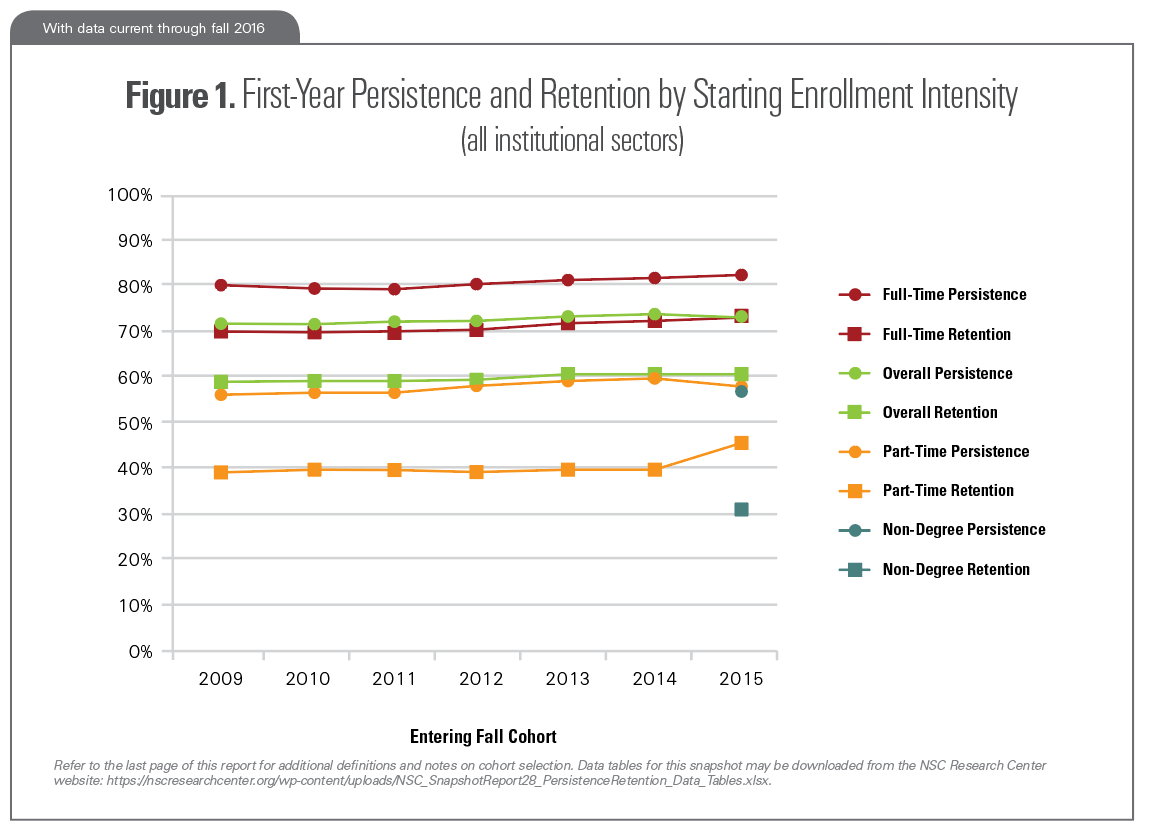
Of all students who started college in fall 2015, 73.4 percent persisted at any U.S. institution in fall 2016, while 61.1 percent were retained at their starting institution. The persistence rate is the percentage of students who return to college at any institution for their second year, while the retention rate is the percentage of students who return to the same institution.
Overall Persistence and Retention Rates
The overall persistence rate for the fall 2015 entering cohort was down 0.2 points from that of the previous cohort, but was up 1.9 points compared to fall 2009. For the included years, the overall persistence rate is about 13 percentage points higher, on average, than the retention rate. Thus, nearly one in eight students who start college in any fall term, transfer to a different institution by the following fall.
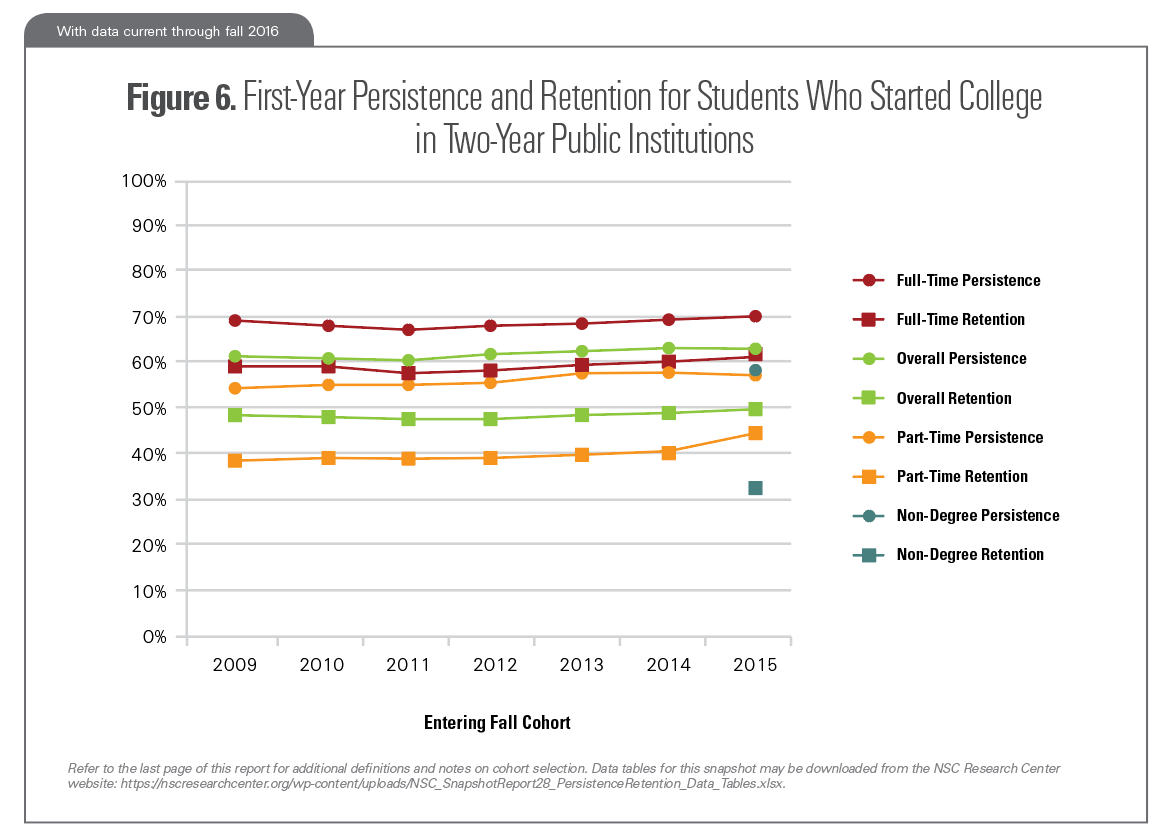
Note: In this report, the NSC Research Center was able to report non-degree-seeking students in a separate category from full-time and part-time students beginning with the fall 2015 entering cohort. For previous entering cohorts, non-degree-seeking students are included in the full-time and part-time categories. This change is the cause of the 2015 spike in part-time retention rate. Non-degree students are included in the overall rates for all years..
Refer to the last page of this report for additional definitions and notes on cohort selection. Download the data tables for this Snapshot.
Persistence and Retention by Race and Ethnicity
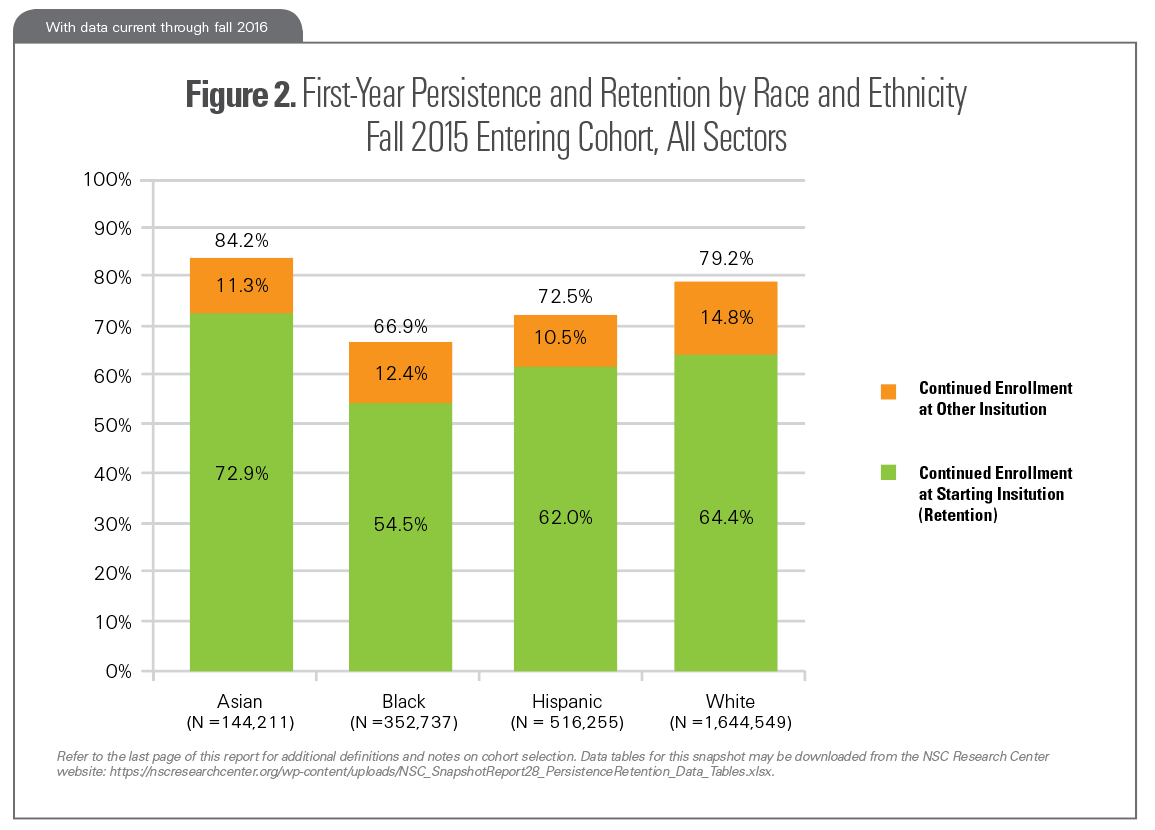
Among students who entered college in fall 2015, Asian students had the highest persistence rate (84.2 percent) with 72.9 percent returning to the starting institution and 11.3 percent returning to an institution other than the starting institution in fall 2016. Black students had the lowest persistence rate (66.9 percent): just over half of black students returned to the starting institution (54.5 percent) and an additional 12.4 percent returned to an institution other than the starting institution. Race and ethnicity data coverage in the Clearinghouse is not as complete as the full enrollment dataset. Institutions provided race and ethnicity data to the Clearinghouse for 79 percent of the students reported in the fall 2015 entering cohort.
Refer to the last page of this report for additional definitions and notes on cohort selection. Download the data tables for this Snapshot.
Persistence and Retention by Age at College Entry
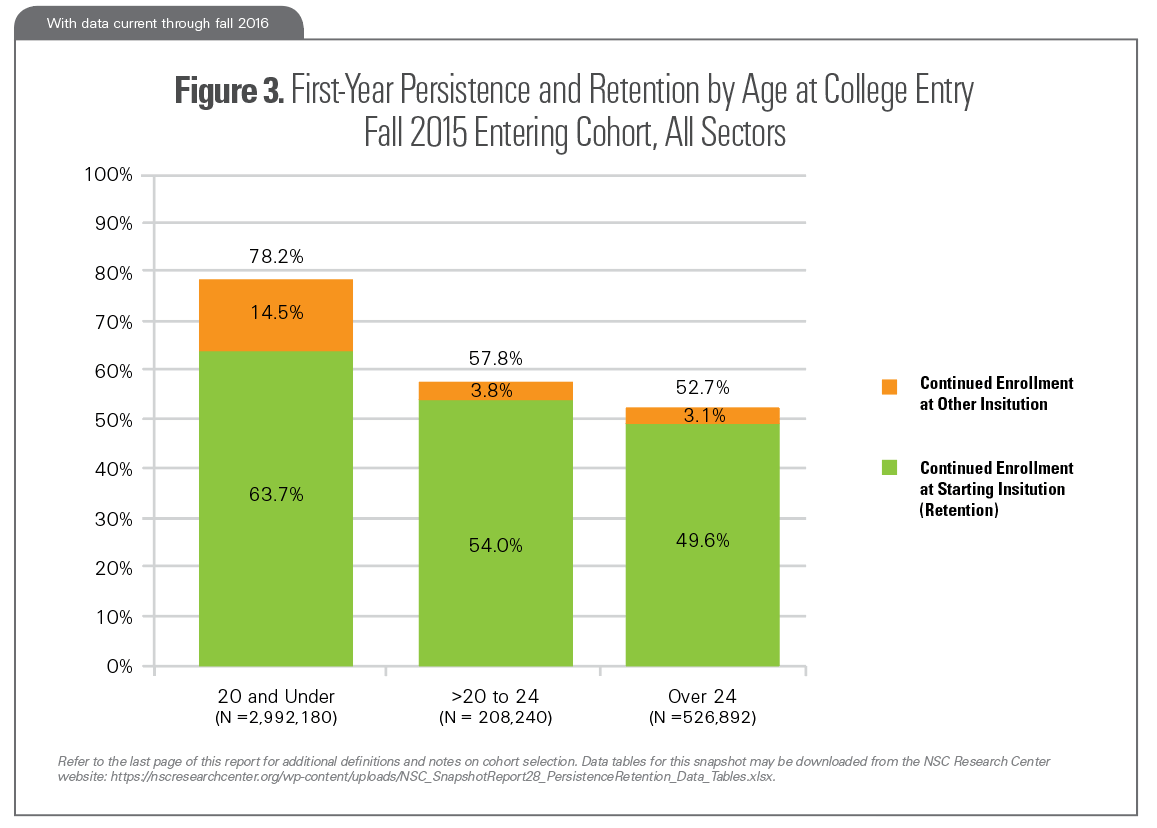
Fall 2015 entering college students who were in the in the 20 and under age group (at time of entry) had a persistence rate of 78.2 percent. This group showed the highest spread between persistence and retention rates, with 14.5 percent (about one in seven students) enrolling in a different institution in their second year. Fall 2015 entering students who were in the >20 to 24 age group had a persistence rate of 57.8 percent, while students who were over age 24 (at time of entry) had a persistence rate of 52.7 percent. For both of these groups, the vast majority of students who enrolled for their second fall term (or completed a credential) did so at their starting institution.
Refer to the last page of this report for additional definitions and notes on cohort selection. Download the data tables for this Snapshot.
Persistence and Retention: Four-Year Public Institutions
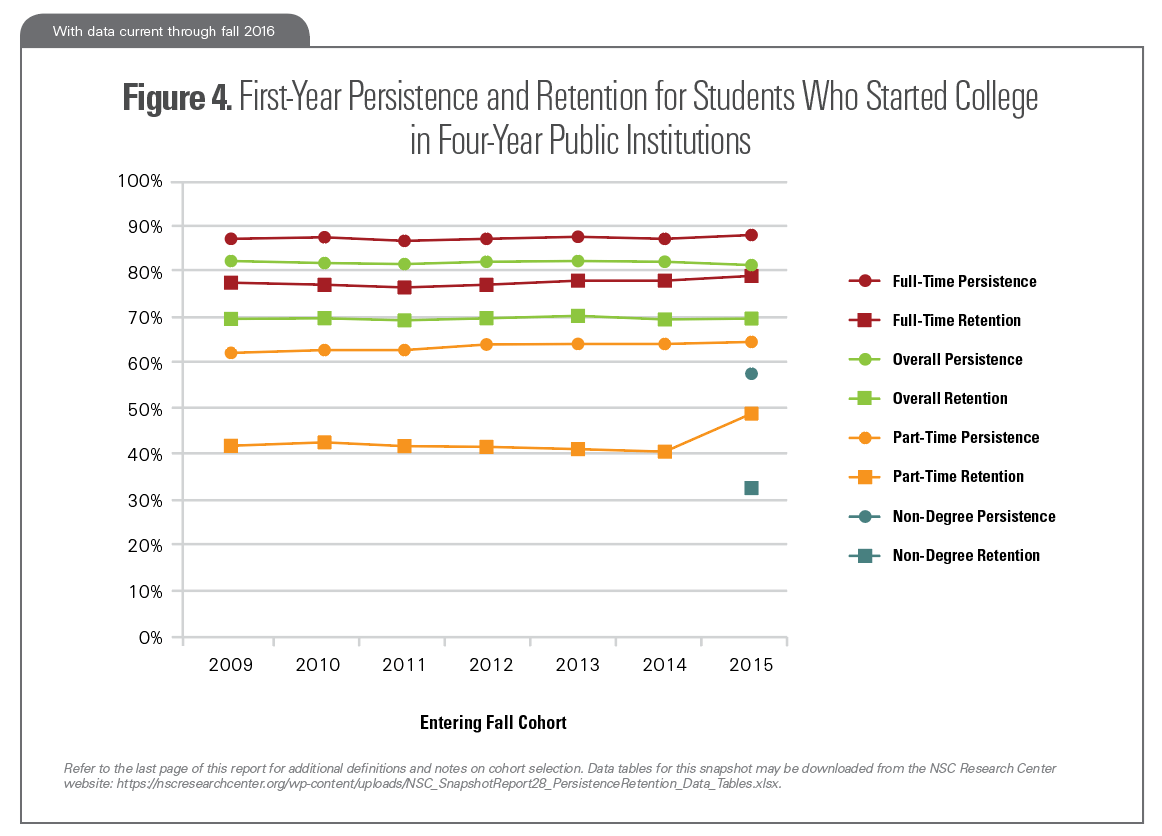
For students who started college in fall 2015 at four-year public institutions, the persistence rate was 81.7 percent, down 0.5 percentage points from the prior year, and down 0.6 percentage points in comparison to the fall 2009 cohort. The persistence rate was 88.4 percent for those who entered college on a full-time basis, compared to 64.8 percent for those who entered college on a part-time basis. Of all students who started college in this sector in fall 2015, 69.7 percent returned to the same institution in fall 2016.
Refer to the last page of this report for additional definitions and notes on cohort selection. Download the data tables for this Snapshot.
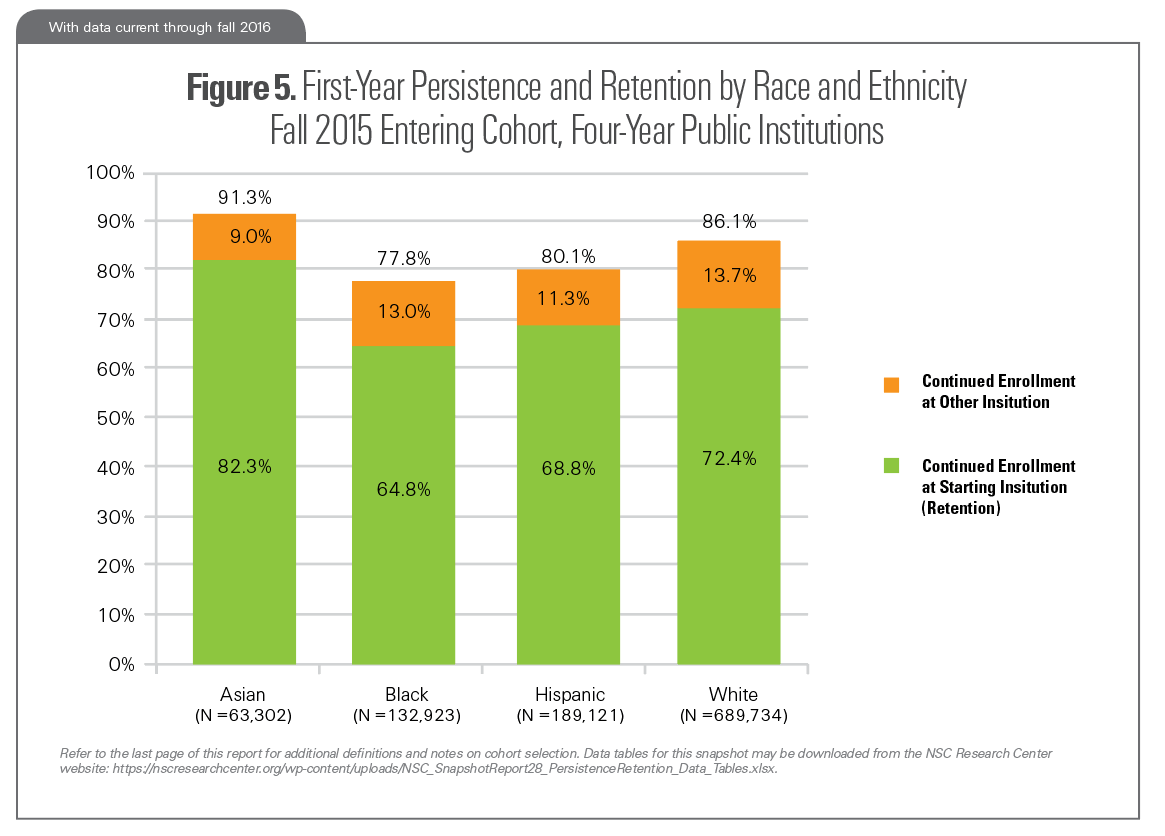
Persistence and Retention by Race and Ethnicity: Four-Year Public Institutions
Among those students who entered four-year public institutions in fall 2015, Asian students had the highest one-year retention rate, with 82.3 percent returning to the starting institution in fall 2016. Asian students also had the highest persistence rate with 91.3percent returning to any institution in fall 2016. White students had the highest share continuing college in fall 2016 at an institution other than the starting institution (13.7 percent). A similar share of black students continued college at a different institution (13.0 percent). Hispanic students and white students had similar one-year retention rates (68.8 percent and 72.4 percent, respectively.) For the four-year public sector, race and ethnicity data were present for 83 percent of the students in the fall 2015 entering cohort.
Refer to the last page of this report for additional definitions and notes on cohort selection. Download the data tables for this Snapshot.
Persistence and Retention: Two-Year Public Institutions
For students who started college in fall 2015 at two-year public institutions, the persistence rate was 62.7 percent, unchanged from the prior year, and up 1.7 percentage points in comparison to the fall 2009 cohort. The persistence rate was 70.2 percent for those who entered college on a full-time basis, compared to 56.9 percent for those who entered college on a part-time basis. Of all students who started college in this sector in fall 2015, 49.1 percent returned to the same institution in fall 2016.
Refer to the last page of this report for additional definitions and notes on cohort selection. Download the data tables for this Snapshot.
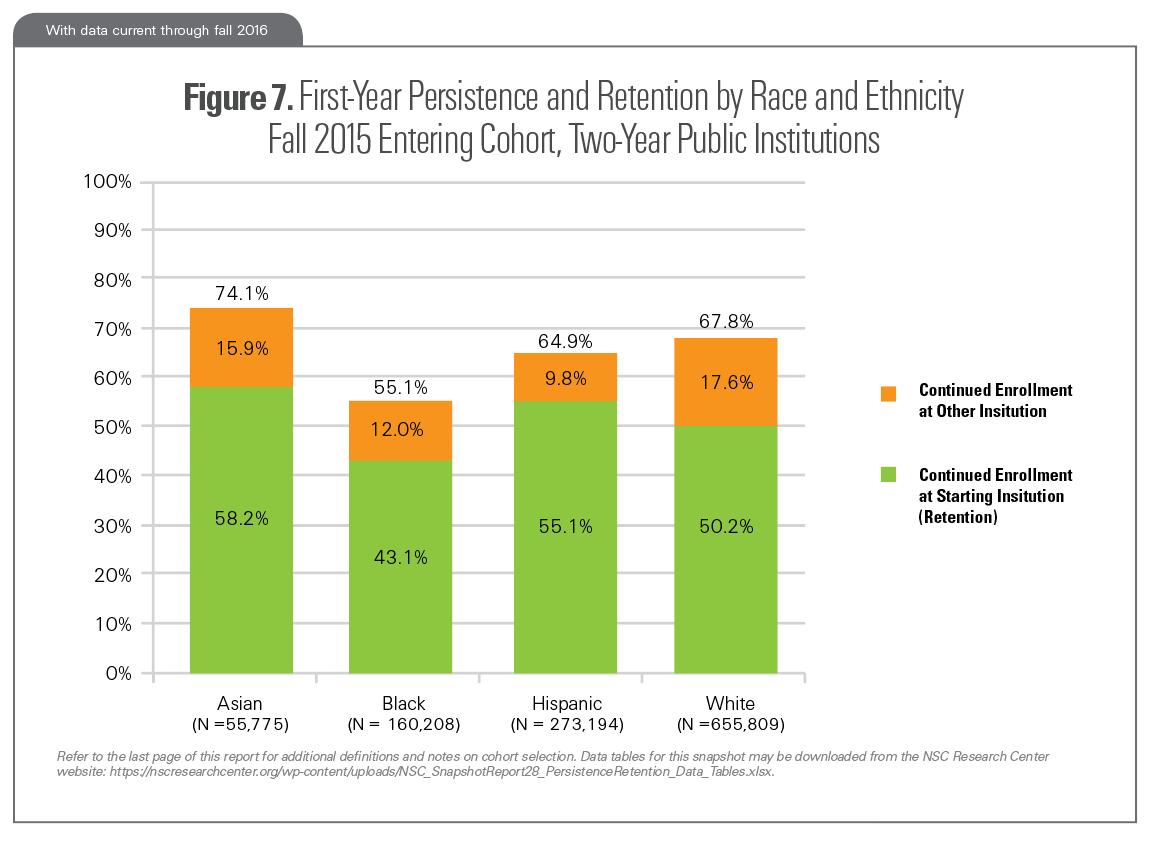
Persistence and Retention by Race and Ethnicity: Two-Year Public Institutions
Among students who entered two-year public institutions in fall 2015, Hispanic and white students had similar one-year persistence rates (64.9 percent and 67.8 percent, respectively). White students had a somewhat lower one-year retention rate (50.2 percent) than Hispanic students (55.1 percent). This reflects the fact that a higher share of white students transferred to four-year institutions by their second fall term. For the two-year public sector, race and ethnicity data were present for 76 percent of the students in the fall 2015 entering cohort.
Refer to the last page of this report for additional definitions and notes on cohort selection. Download the data tables for this Snapshot.
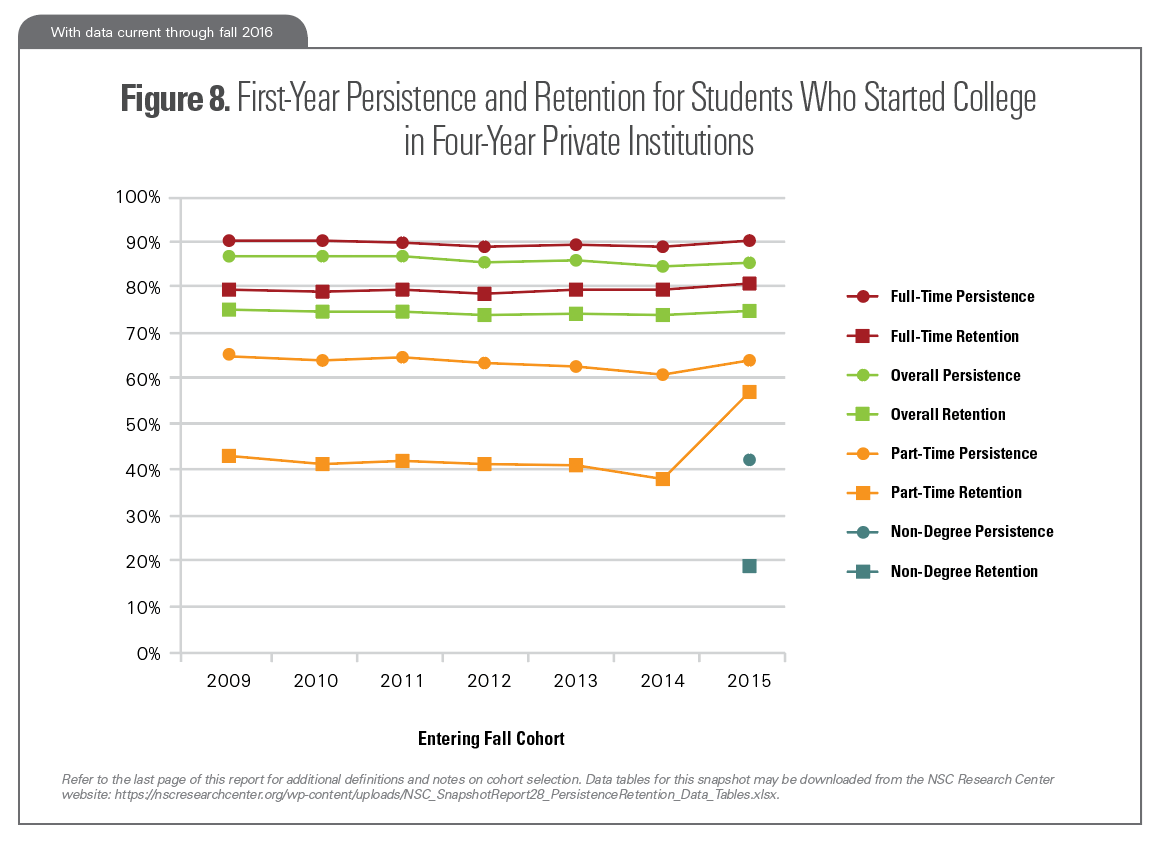
Persistence and Retention: Four-Year Private Institutions
For students who started college in fall 2015 at four-year private institutions, the persistence rate was 84.9 percent, down 0.4 percentage points from the prior year, and down 2.6 percentage points in comparison to the fall 2009 cohort. The persistence rate was 90.1 percent for those who entered college on a full-time basis, compared to 63.7 percent for those who entered college on a part-time basis. (Part-time students make up only seven percent of the sector’s degree-seeking cohort.) Of all students who started college in this sector in fall 2015, 74.7 percent returned to the same institution in fall 2016.
Refer to the last page of this report for additional definitions and notes on cohort selection. Download the data tables for this Snapshot.
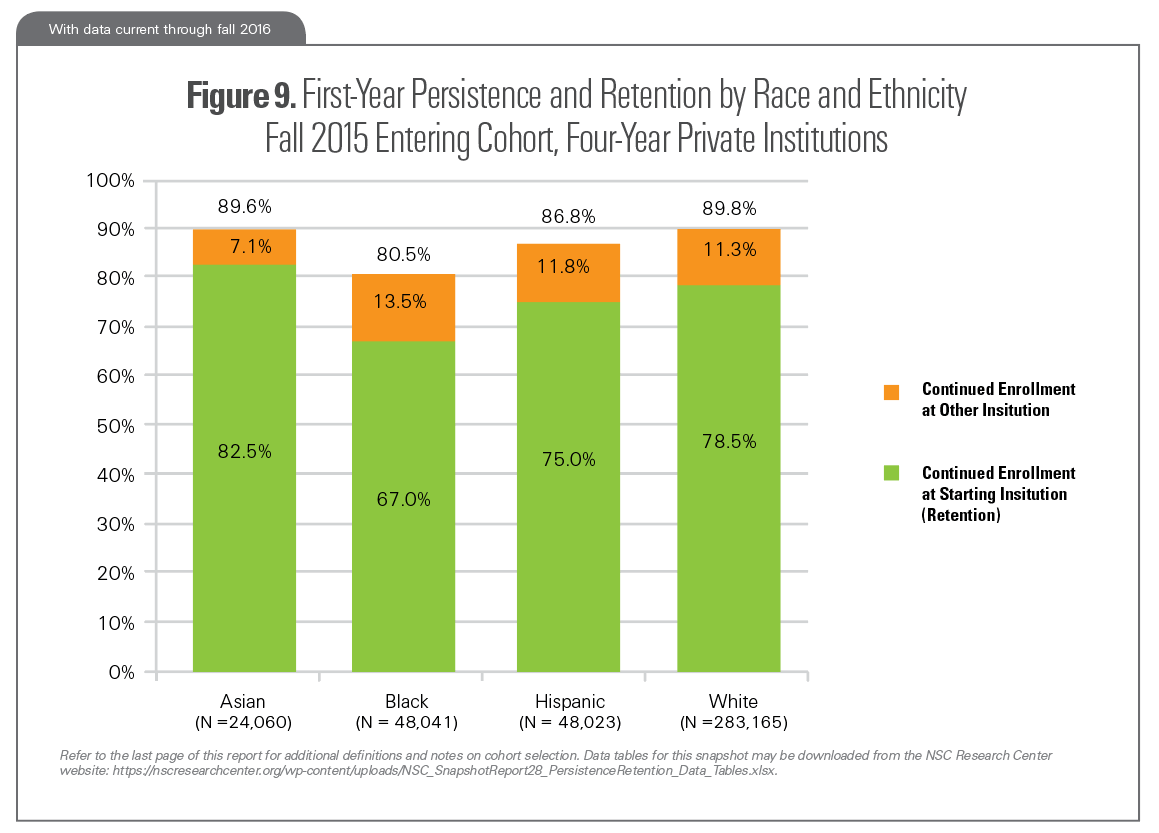
Persistence and Retention by Race and Ethnicity: Four-Year Private Institutions
Among students who entered four-year private institutions in fall 2015, all four race and ethnicity groups had persistence rates over 80 percent. White and Asian students had nearly identical one-year persistence rates (89.8 percent and 89.6 percent, respectively), but Asian students were more likely to continue college at their starting institution (82.5 percent). For the four-year private sector, race and ethnicity data were present for 79 percent of the students in the fall 2015 entering cohort.
Refer to the last page of this report for additional definitions and notes on cohort selection. Download the data tables for this Snapshot.
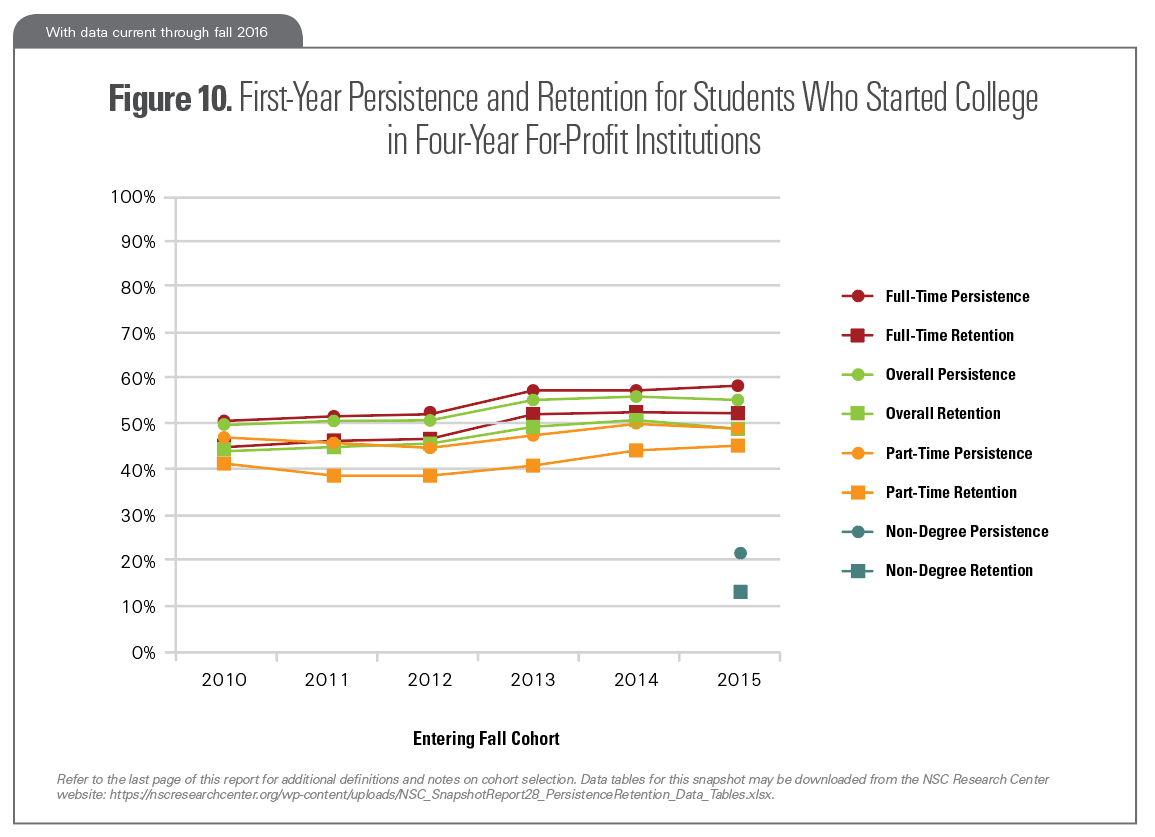
Persistence and Retention: Four-Year For-Profit Institutions
For students who started college in four-year for-profit institutions, the persistence rate was 55.7 percent, down 0.6 percentage points from the prior year, but up 5.5 percentage points in comparison to the fall 2010 cohort. The persistence rate was 58.7 percent for those who entered college on a full-time basis, compared to 50.2 percent for those who entered college on a part-time basis. Of all students who started college in this sector in fall 2015, 50.3 percent returned to the same institution in fall 2016.
Note: Race and Ethnicity data for the four-year for-profit sector were present for only 46% of the entering students in this sector, so this report does not include results disaggregated by race and ethnicity for this sector.
Refer to the last page of this report for additional definitions and notes on cohort selection. Download the data tables for this Snapshot.
First-Year Persistence and Retention: Definitions and Notes on Cohort Selection
Degree-Seeking Status
Beginning with the fall 2015 entering cohort, the NSC Research Center is able to report non-degree-seeking students in a separate category from full-time and part-time students. For previous entering cohorts, non-degree-seeking students are included in the full-time and part-time categories. Non-degree-seeking students are included in the overall rates for all entering cohort years.
International Students
Previous versions of this report excluded international students from the entering cohorts. In this version, international students are included in all entering cohort years and results for previous entering cohort years have been restated to reflect this.
Fixed Panel of Institutions
Previous versions of this report were limited to a fixed panel of institutions present in every entering cohort year of the report, but that limitation no longer applies. In this version, the institutions included in each entering cohort year may be slightly different due to institutional closures, mergers, or changes in Clearinghouse participation over time. Results from previous versions of the report have been restated to reflect this
Retention
Defined in this report as continued enrollment (or degree completion) within the same higher education institution in the fall semesters of a student’s first and second year.
Persistence
Defined in this report as continued enrollment (or degree completion) at any higher education institution — including one different from the institution of initial enrollment — in the fall semesters of a student’s first and second year.
Enrollment Intensity
A student is classified as having started college in a full-time status or part-time status based on their earliest reported enrollment intensity within the entering fall term. The part-time category comprises three-quarter-time, half-time and less-than-half-time students. For entering cohort years 2009 – 2014, the part-time category also includes non-degree-seeking students. Beginning with the 2015 entering cohort, non-degree students are reported in a separate category.
First-Time Status
This report uses historical Clearinghouse enrollment and degree data to confirm that students included in the study (1) showed no previous college enrollment in the four years prior to the entering cohort year and (2) had not previously completed a college degree.
Former Dual Enrolled Students
The cohorts used in this study include former dual enrollment students: first‐time college students who had taken college courses prior to graduating from high school. Students were identified as former dual enrollment students if their enrollment or degree record prior to the entering cohort year was before the student turned 18 years old.
Fall Enrollment
A student is counted as having been enrolled in the fall if they were enrolled for any length of time in a term that began between August 1 and October 31, inclusive.