

High School Benchmarks – 2015
National College Progression Rates for high schools participating in the National Student Clearinghouse StudentTracker service
Our third annual report provides new data on high school graduates’ college access, persistence, and completion outcomes, including completions in STEM fields. Data are presented for students from different types of high schools, such as low versus higher income and low versus high minority, to enable more focused discussions about low income and minority students traditionally not well served by higher education. A supplemental feature highlighting the differences in access and attainment for graduates from high- and low-poverty public non-charter high schools is also included.
Table of Contents
- Introduction
- Section 1: National Results
- Section 2: Results by High School Type
- How to Use this Section
- Results Tables & Figures
- Results for Public Non-Charter High Schools
- Low Income Schools
- High Minority, Urban High Schools
- Low Minority, Urban High Schools
- High Minority, Suburban High Schools
- Low Minority, Suburban High Schools
- High Minority, Rural High Schools
- Low Minority, Rural High Schools
- Higher Income Schools
- High Minority, Urban High Schools
- Low Minority, Urban High Schools
- High Minority, Suburban High Schools
- Low Minority, Suburban High Schools
- High Minority, Rural High Schools
- Low Minority, Rural High Schools
- Low Income Schools
- Results for Public Charter High Schools
- Results for Private High Schools
- Supplemental Feature: Results for Public Non-Charter High Schools
- High Poverty High Schools
- Low Poverty High Schools
- Results for Public Non-Charter High Schools
- References
- Appendix A: Methodological Notes
- Appendix B: Postsecondary Coverage Tables
- Appendix C: Tables for Section 1
Introduction
The third annual High School Benchmarks Report provides new data on high school graduates’ college access, persistence, and completion outcomes. Research projects demographic shifts among high school graduates (e.g., an increase in the number of Hispanic and Asian/Pacific Islander graduates and a decline in the number of White non-Hispanic students) in the next few years (Prescott & Bransberger, 2012). The data in this report are presented for students from different types of high schools, such as low versus higher income and low versus high minority, to enable more focused discussions, particularly about low income and minority students traditionally not well served by higher education.
Previous research has shown that high school context can lead students to make different educational choices regarding whether or not to enroll in college or what college to attend (CLASP, 2015 Wolniak & Engberg, 2010; Hurwitz, Smith, Howell, & Pender, 2012; Roderick, Coca & Nagaoka, 2011). Not only are high schools an important source of information for students making postsecondary education plans (Bell, Rowan-Kenyon, & Perna, 2009; Hossler, Schmidt, & Vesper, 1999), but they have a lasting effect on students, with some high school context variables continuing to be important for students even after they enroll in college (Black, Lincoln, Cullinove, & Vernon, 2012).
Some data on the college-going rates of high school students at the national level are available (Kena et al., 2015). Many schools and districts also have access to timely reports on the college access and persistence rates of their own graduates through the StudentTracker® service of the National Student Clearinghouse. This report is designed to enable those schools to benchmark their students’ outcomes to those of other schools with similar characteristics and that also use the StudentTracker service. Using the results reported here, high schools and districts can place their own StudentTracker results into context with the college access and persistence rates for schools with similar student populations in similar locales across the country.
This is a descriptive study. No causal inferences should be made based on these results alone. The data on which this report is based do not comprise a nationally representative sample of schools or high school graduates. Yet, it is a large and broad sample, covering about 4 million students from public and private high schools for five high school graduating classes, or 24 to 30 percent of all U.S. high school graduates each year. It includes data from all 50 states. In addition to providing reasonable benchmarks for individual schools and districts using StudentTracker reports, we believe it also significantly contributes to discussions amongst practitioners and policymakers at the school, district, state, and national levels about equitable access to, and attainment in, postsecondary education.
What To Find In This Report
The report provides college enrollment and persistence outcomes for public non-charter; public charter; and private high school graduates. This year’s report also provides, for the first time, six-year college completion rates for the high school class of 2008, highlighting the percentage of students with a STEM (Science, Technology, Engineering, and Mathematics) degree in particular. For students of public non-charter high schools, the rates are reported in 12 categories based on the school-level demographic and geographic characteristics:
- Low income, high minority, urban
- Low income, low minority, urban
- Low income, high minority, suburban
- Low income, low minority, suburban
- Low income, high minority, rural
- Low income, low minority, rural
- Higher income, high minority, urban
- Higher income, low minority, urban
- Higher income, high minority, suburban
- Higher income, low minority, suburban
- Higher income, high minority, rural
- Higher income, low minority, rural
These categories are defined by the aggregate characteristics of each high school, not by the characteristics of individual students.
However, it is important to note that the sample sizes for charter and private high schools are relatively smaller than those of the public non-charter schools. Therefore, the results for charter and private schools are subject to higher variance and uncertainty than the results for public non-charter schools. For this reason, we do not recommend comparing these categories or using the results to draw conclusions about the differences between the school types.
For the purpose of this report, low income schools are defined as schools where at least 50 percent of the students are eligible for a free or reduced-price lunch. Minority schools are defined as schools where at least 40 percent of the students are black or Hispanic. Locale is defined by the NCES urban-centric locale code. Schools with a code from 11 to 13 are defined as urban. Schools with a code from 21 to 23 are defined as suburban. And those with a code from 31 to 43, covering both town and rural areas, are defined as rural.
This report presents postsecondary outcomes for the high school graduating classes of 2008 and from 2011 through 2014. The tables and figures present:
- Total college-going rate for each of the 12 categories of public non-charter high schools as well as for public charter and private high schools, including:
- Enrollment in the first fall after high school graduation
- Enrollment at any time in the first year after high school graduation
- Enrollment at any time in the first two years after high school graduation
- Persistence from first to second year of college
- Six-year college completion rates, both overall and in the STEM fields in particular, expressed as the percentage of high school graduates who complete a degree at any college
College enrollment rates are calculated for the most recent two graduating classes for which data are currently available. Thus, the first fall outcome has been calculated for the classes of 2014 and 2013, the first year outcome calculated for the classes of 2013 and 2012, and the first two years’ outcomes calculated for the classes of 2012 and 2011. The persistence rates were calculated for the high school graduating class of 2012. The six-year college completion rates were calculated for the high school graduating class of 2008. Results are also broken down by the type of college attended: public and private institutions, two- and four-year institutions, as well as in-state and out-of-state institutions.
Supplemental Feature: High-Poverty and Low-Poverty Schools
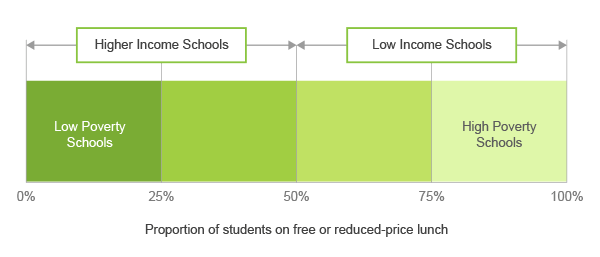
In addition to our standard results for schools in low income and higher income categories, this year’s report also includes a supplemental feature that presents postsecondary outcomes for graduates from a subset of low income schools defined as high-poverty schools. These are schools where at least 75 percent of the student population are eligible for free or reduced price lunch. At the opposite end of the scale, we also define a subset of higher income schools as low-poverty if less than 25 percent of the student population are eligible for free or reduced price lunch.
A complete explanation of definitions can be found in Appendix A.
Important Note On The Data
The data on high school graduates for this report were drawn from a voluntary sample of high schools participating in the StudentTrackerSM for High Schools service (STHS) administered by the National Student Clearinghouse (The Clearinghouse). High schools participating in this service pay a small annual fee (typically $425) to receive an extensive set of analytic data reports, three times per year, detailing the postsecondary access and success outcomes for up to eight cohorts of their graduating classes.
This is not a nationally representative sample of schools or of high school graduates. Compared to all U.S. high schools, participating STHS schools tend to have greater representation among schools with more low income students, more minority enrollments, and more urban locales.
All types of high schools, including public non-charter, public charter, and private schools can participate in the Clearinghouse STHS service. The sample includes schools from all 50 states and the majority of the 100 largest districts in the U.S., with a total of about 4 million high school graduates or 24 to 30 percent of all public high school graduates each year (for more detailed information about the sample, see Appendix A).
The data on college enrollments for this report, and for the STHS reports that the participating high schools receive, were drawn from the National Student Clearinghouse. The National Student Clearinghouse is the nation’s trusted source for education verification and student educational outcomes research.
Section 1: National Results
College Enrollment, Persistence, and Completion Rates for Graduates from Public Non-Charter High Schools
High schools are interested in the college access and success of their graduates, regardless of whether they enroll immediately or wait a year or longer. Immediate college enrollment is perhaps the outcome on which high schools have the most impact through the academic preparation and guidance they provide. Figure A shows the rates of immediate college enrollment in the first fall after high school graduation for the high school graduating class of 2014. Students from higher income, low minority, suburban schools had the highest college enrollment rate. Seventy-four percent of students who graduated from these high schools in 2014 enrolled in college immediately after high school graduation. In general, among the three school characteristics considered, the poverty level, measured by the proportion of students eligible for free or reduced price lunch, was the most consistent correlate to college enrollment rates. Students from high schools with a larger number of low income students (more than 50 percent eligible for free or reduced price lunch) had lower college enrollment rates than schools with mostly higher income students, regardless of the minority or geographic category that the school fell into. The highest immediate college-going rate across all six low income groups (58 percent) was still lower by six percentage points than the lowest college-going rate (64 percent) among students from higher income groups.
These patterns persist when the data are expanded to include students who delay their enrollment until spring and summer terms or the following year (see Appendix C, Tables 2-5)
Figure A. College Enrollment Rates in the First Fall after High School Graduation, Class of 2014
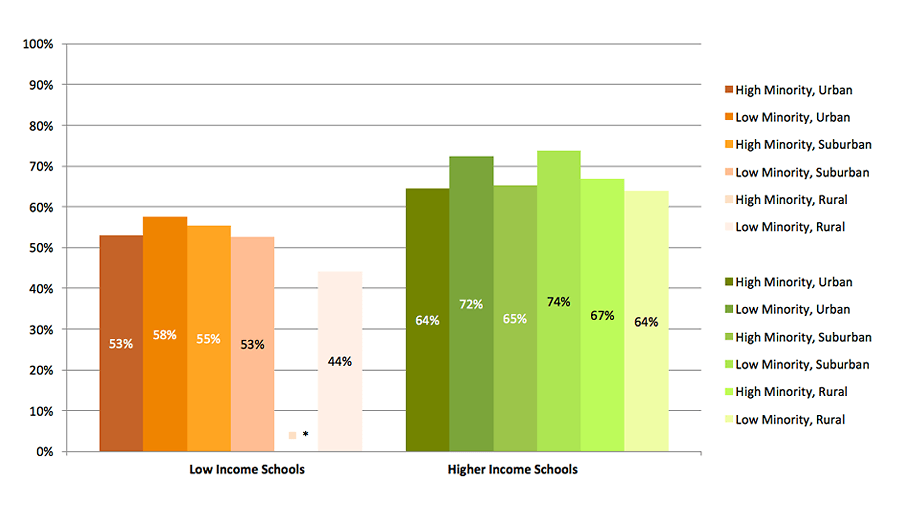
* Value not shown due to low coverage. This figure is based on data shown in Appendix C, Table 1.
Figure B shows the same data as Figure A, rates of immediate college enrollment in the first fall after high school graduation, but grouped differently by minority status to highlight differences by school locale. Within each income group, graduates from high minority schools had similar immediate college enrollment rates with limited variation introduced by locale. However, geographic locale stands out as a more prominent factor among graduates from low minority schools, with those from rural locales having the lowest college enrollment rates.
Figure B. College Enrollment Rates in the First Fall after High School Graduation by Locale, Class of 2014
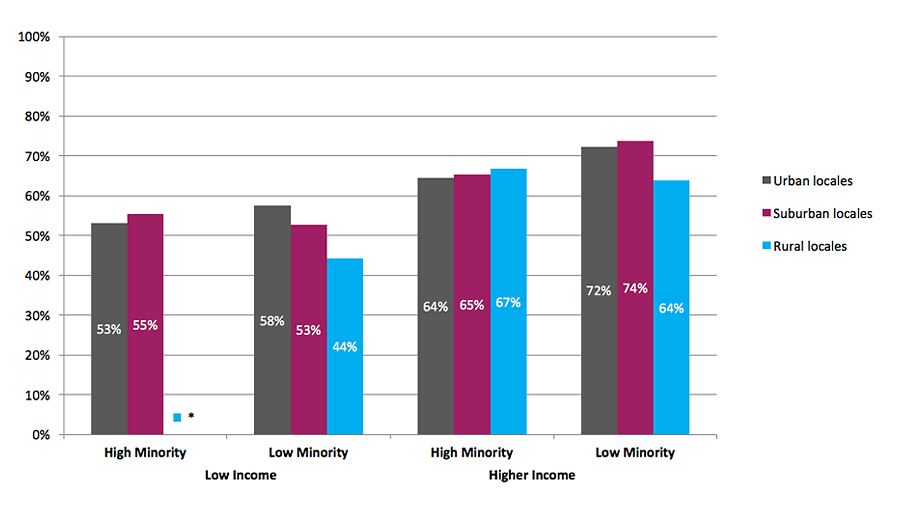
* Value not shown due to low coverage. This figure is based on data shown in Appendix C, Table 1.
High schools are also interested in the type of college their graduates are attending, particularly whether it is a two-year or a four-year college and, in some cases, a public or private college.
Large differences among students from low income and higher income high schools were found when looking at enrollment rates by the institution level. The range for the first fall enrollment rates at four-year colleges and universities was 25 to 32 percent for graduates from low income high schools, much lower than the 35 to 51 percent rates for graduates from higher income high schools (see Appendix C, Table 1). Enrollments at out-of-state institutions and private institutions, as a proportion of all enrollments, were also higher for students from higher income high schools (see Appendix C, Table 1).
To examine how well high schools equip students to succeed in college, we looked at the persistence rates from the first to the second year of college for the high school graduating class of 2012 (Figure C). This is the percentage of students who enrolled in postsecondary education during the first year after high school graduation and remained enrolled in the second year. It includes students who may have transferred or re-enrolled at a different institution from the one where they started. Persistence rates ranged from 73 to 89 percent for graduates of the high school class of 2012. Higher persistence rates (84 to 89 percent) were found for students from higher income high schools compared to those from low income high schools (73 to 82 percent). Regardless of high school type, persistence rates among students who enrolled in private colleges and universities were higher than those in public institutions. Persistence rates for all students were also higher in four-year institutions than in two-year institutions (see Appendix C, Table 7).
Enrollments at out-of-state institutions as a proportion of all enrollments were higher for students from higher income high schools. Eleven to 23 percent of the college-going graduates from higher income schools enrolled at out-of-state institutions, compared to just nine to 13 percent of those from low income high schools (see Appendix C, Table 1).
Figure C. Persistence Rates from First to Second Year of College, Class of 2012
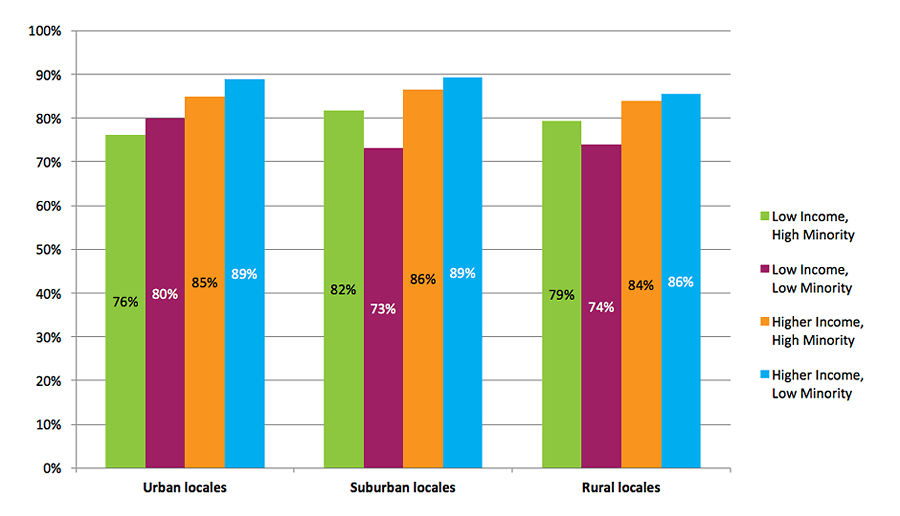
This figure is based on data shown in Appendix C, Table 7.
Some students do not make it to college in the fall immediately after high school, but enroll in the following winter, spring, or even summer terms. Across all groups, enrollment rates increased markedly when we counted all enrollments in the first year after graduation, compared to the first fall enrollments (see Figure D below and Appendix C, Tables 2 and 3). These increases were similar among graduates from low income and higher income schools. The increases were driven mostly by students attending two-year institutions, which is not surprising as two-year institutions allow more flexibility in start times.
Earlier in this section we shared our findings on students’ immediate college enrollment, which demonstrated that college access is lower for many students from low income schools. In this section, we present high school graduates’ college completion outcomes measured as the rate of completion among all high school graduates, not just those who enrolled in college. (This is different from the persistence measure, in which the rate is calculated as the percentage of students enrolled in the first year after high school graduation who remained enrolled in the second year.) As Figure D shows, there is a large gap in the college completion rates of high school graduates by school income level, but here minority status also appears to play an important role. The six-year college completion rate ranged from 22 to 33 percent among graduates from all low income schools as well as those from higher income, high minority schools. The lowest rate was for graduates of low income, high minority, urban schools: only 22 percent of the students who graduated from these high schools had completed a college degree six years later. Regardless of school locale, more than 40 percent of the graduates from higher income, low minority schools had completed a college degree six years later.
Figure D. College Completion Rates Six Years after High School Graduation, Class of 2008
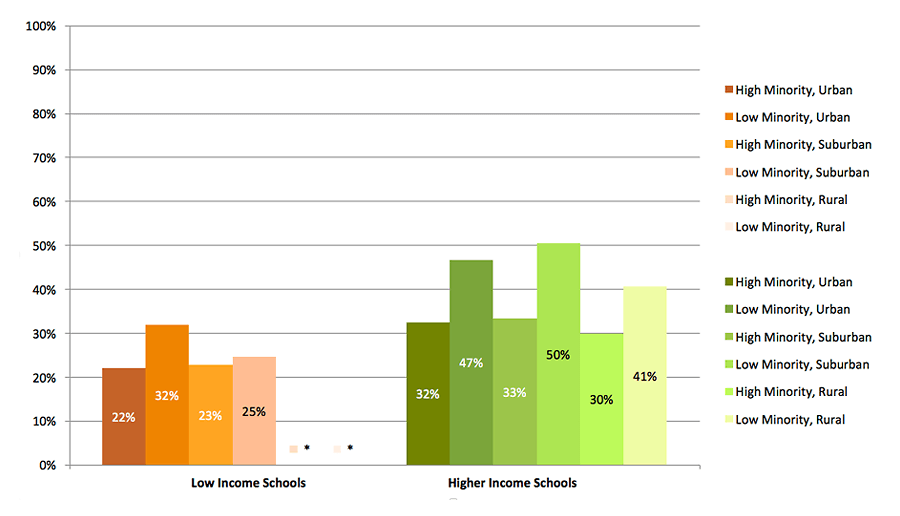
* Value not shown due to low coverage. This figure is based on data shown in Appendix C, Table 8.
Within each income group for graduates from high minority schools, locale was not an important contributor to the six-year completion rates. Figure E shows the same data as Figure D, but only for low minority schools to highlight the differences by locale within each income group.
Among graduates from low income, low minority high schools, those from urban schools had the highest completion rate (32 percent) followed by graduates from suburban schools (25 percent) and rural schools (21 percent). Among graduates from higher income, low minority high schools, those from suburban schools had the highest completion rate (50 percent) followed by graduates from urban schools (47 percent) and rural schools (41 percent).
Figure E. College Completion Rates Six Years after High School Graduation, Class of 2008, Low Minority Schools
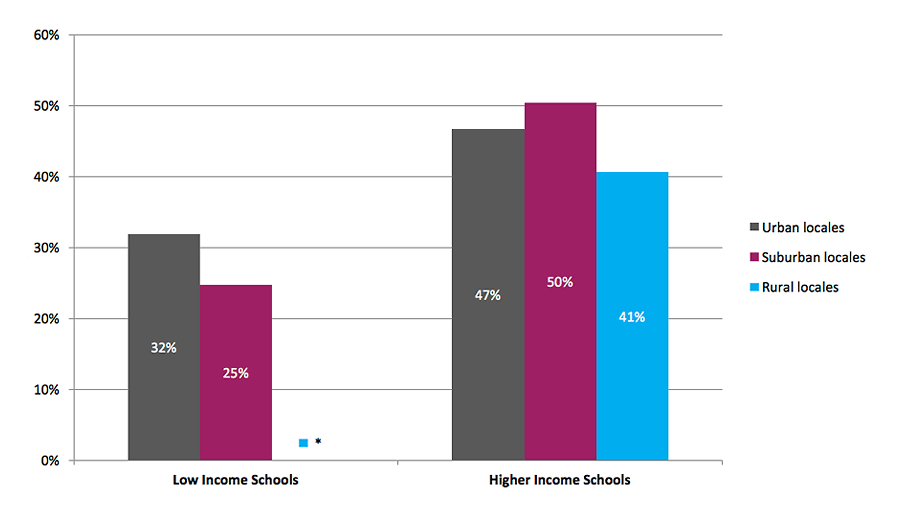
* Value not shown due to low coverage. This figure is based on data shown in Appendix C, Table 8.
As part of our commitment to this year’s White House Science, Technology, Engineering & Mathematics (STEM) initiatives, we analyzed completion rates in the STEM fields separately. This is the percentage of high school graduates for whom at least one completion record in a STEM field six years after high school graduation was found in the Clearinghouse data. The definition of STEM used in this analysis is based on a listing of six-digit CIP codes used by the National Science Foundation and includes social sciences and psychology (for a complete list, see Appendix A).
A recent report by the President’s Council of Advisors on Science and Technology emphasized the importance of STEM education as the determinant of success for the U.S to remain as a leader among nations (PCAST, 2010). The report points out that the effectiveness of STEM education in the country will determine whether we are able to find solutions to many challenges in areas, such as energy and health, and will ensure a better “understanding of ourselves, our planet, and the universe” (p. v). It is projected that the job growth in STEM occupations will be much higher than in non-STEM occupations and that, on average, they will have higher earnings (U.S. Department of Commerce, 2011). In light of the well-documented economic benefits of earning a STEM credential for both individuals and society, six-year completion rates in a STEM field were relatively low among high school graduates (Figure F). There were also large differences within groups. The highest percentages of high school graduates who had a degree in a STEM field were from higher income, low minority urban and suburban schools (17 and 16 percent, respectively). In contrast, only six percent of graduates from low income, high minority, urban schools had a STEM-related degree six years after high school graduation.
Figure F. College Completion Rates Six Years after High School Graduation, STEM Field of Study, Class of 2008
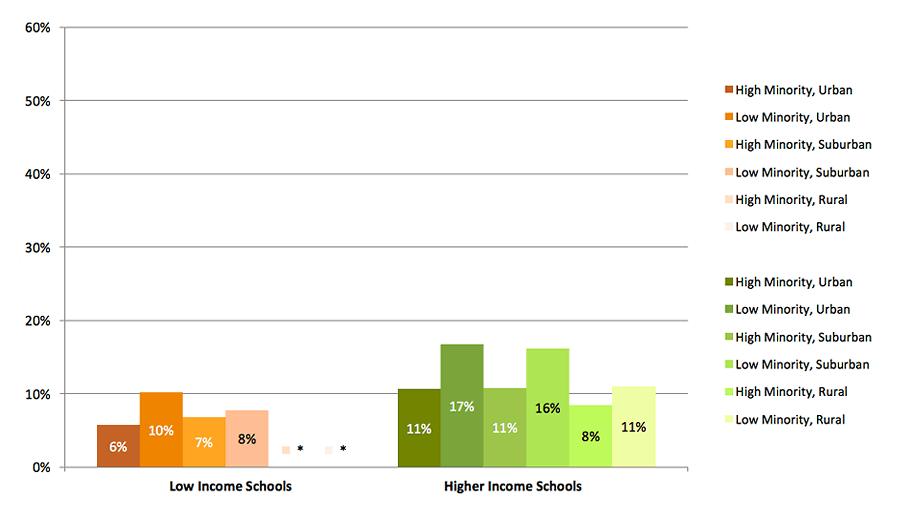
* Value not shown due to low coverage. This figure is based on data shown in Appendix C, Table 9.
Differences are even more pronounced when we look at the distribution of STEM degrees by discipline (Figure G). Overall, in seven out of the 12 high school categories, at least half of all STEM degrees earned were in social sciences and psychology. Graduates from higher income, low minority schools who had the lowest share of social sciences and psychology STEM degrees (42 to 47 percent) had the highest proportion of engineering STEM degrees (16 percent), regardless of the geographic category into which the school fell. The proportion of STEM degrees in mathematics ranged from 3 to 5 percent across all high school categories.
Figure G. College Completion Rates Six Years after High School Graduation, STEM Field of Study by Discipline, Class of 2008
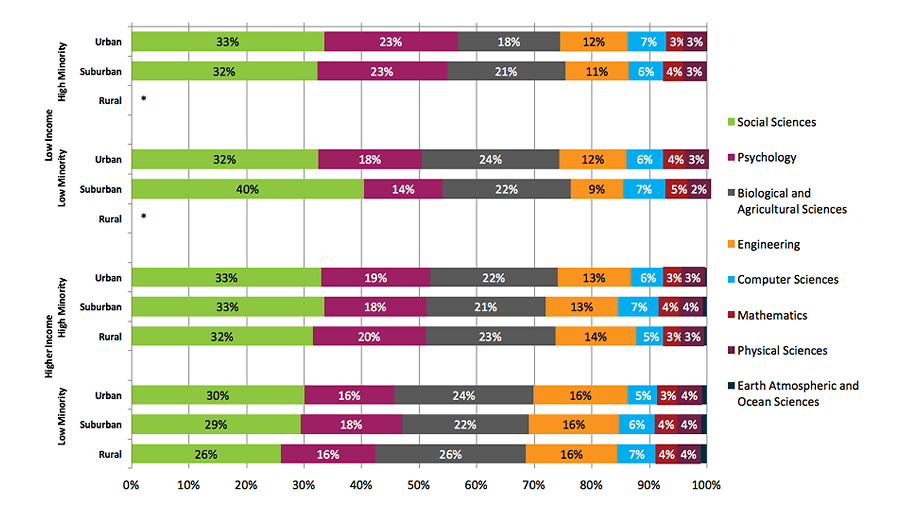
* Value not shown due to low coverage. This figure is based on data shown in Appendix C, Table 10.
Supplemental Feature: Differences in Access and Attainment for Graduates from High Poverty and Low Poverty Public Non-Charter High Schools
The main section of this report presents college access, persistence, and completion outcomes for graduates from low income and higher income high schools. This supplemental feature presents postsecondary outcomes for graduates of two additional school categories and is designed to further highlight the income-based gaps in postsecondary outcomes. The first is a subset of low income schools that we define as high-poverty, wherein at least 75 percent of the student population is eligible for free or reduced price lunch. The second is a subset of higher income schools that we define as low-poverty, wherein less than 25 percent of the student population is eligible for free or reduced price lunch.
Recent research has highlighted the differences in college preparation opportunities available to students based on their high school’s poverty level: high-poverty high schools are more likely to have less experienced and less qualified teachers and less likely to offer college prep courses or have guidance counselors (CLASP, 2015). While the main section of our report provides evidence of the gap in postsecondary access and success outcomes for students from low income schools, this section demonstrates a more alarming gap in access and attainment rates between students from high- and low-poverty schools. Below we highlight a few results from this analysis.
Figure S1. College Enrollment Rates in the First Fall after High School Graduation, Class of 2014, Public Non-Charter Schools by Poverty Level
* Value not shown due to low coverage. This figure is based on data shown in Appendix C, Table S1
Figure S1 shows the gaps in the immediate college enrollment rate between high- and low-poverty schools within each minority level and geographic category. These gaps range from 11 to 30 percentage points. The poverty-level gap is largest among graduates from low minority, suburban schools (a 30 percentage point difference). The gap is narrowest among graduates of high minority, urban schools (an 11 percentage point difference). The rate of immediate enrollment at four-year colleges and universities was 21 to 32 percent among high-poverty school graduates and 35 to 59 percent among low-poverty school graduates. Again, those from high minority, urban schools had the lowest enrollment rates in four-year institutions among graduates from all low-poverty high schools (See Appendix C, Table S1).
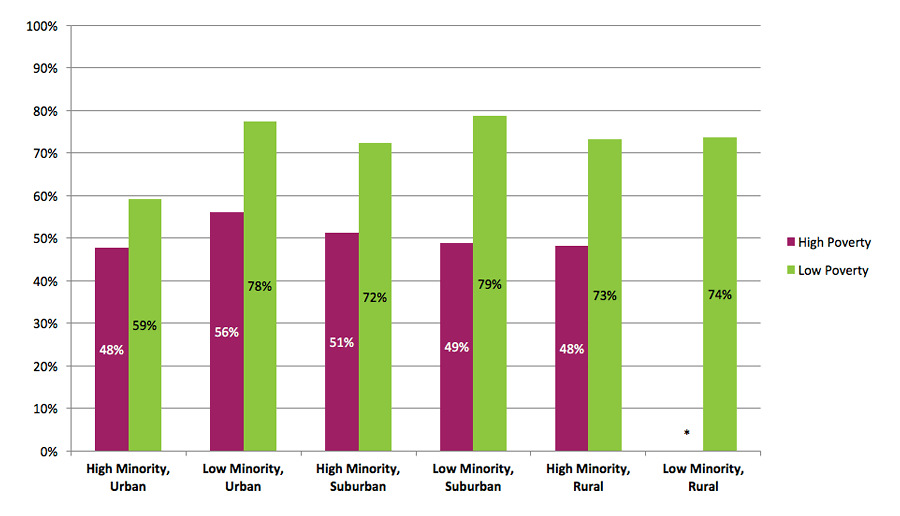
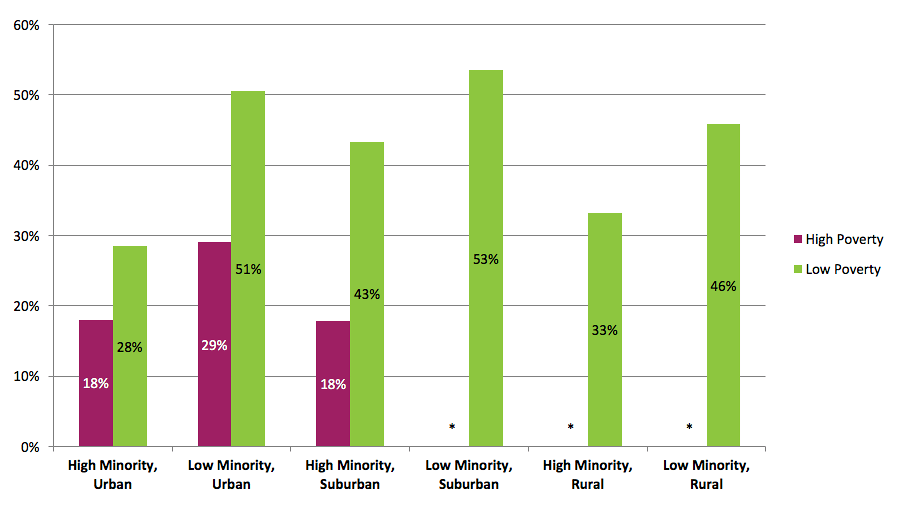
Figure S2. College Completion Rates Six Years after High School Graduation, Class of 2008, Public Non-Charter Schools by Poverty Level
* Value not shown due to low coverage. This figure is based on data shown in Appendix C, Table S8
Six-year completion rates demonstrate that the achievement gap between graduates of high- and low-poverty schools continues after college entry, as graduates from high-poverty schools completed degrees at much lower rates than those from low-poverty schools. Only 18 to 29 percent of graduates from high-poverty high schools graduated college within six years of finishing high school, compared to 28 to 53 percent of low poverty school graduates (Figure S2). The gap was the narrowest among graduates from high minority, urban schools (a 10 percentage point difference) because of the overall low completion rates for these students, regardless of the school’s poverty category. In fact, graduates from low-poverty, high minority, urban schools had a completion rate of only 28 percent, the lowest among all low-poverty schools.
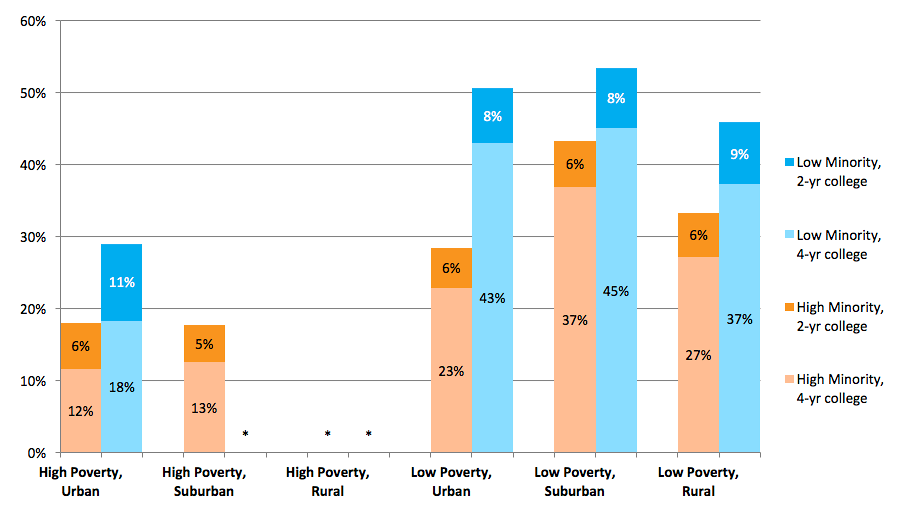
Figure S3. College Completion Rates Six Years after High School Graduation, Class of 2008, Public Non-Charter Schools by Minority Level
* Value not shown due to low coverage. This figure is based on data shown in Appendix C, Table S8
The minority category appears to be a strong contributing factor to the achievement gap for students from low poverty, urban schools: students from low minority schools had a completion rate 22 percentage points higher than those from high minority schools (51 percent and 29 percent, respectively). Most of this variance in the completion rate comes from the difference in completion rates from four-year institutions (43 and 23 percent, respectively) (Figure S3).
Section 2: Results by High School Type
Guidance on How to Interpret the Outcomes in this Section
This section provides detailed results for schools in low income and higher income categories as well as in high poverty and low poverty categories.
Outcomes are provided in two different ways: student-weighted totals and school percentile distributions.
Tables with student-weighted totals are designed to enable individual schools and districts to compare their StudentTracker results directly to the national benchmarks. Totals are calculated by computing the mean among all schools within the category, weighted by the size of each school’s graduating class. By placing their own results into the context of these aggregate totals, practitioners can better understand the meaning of their students’ college access and persistence outcomes.
Tables with school percentile distributions are designed to enable individual schools and districts to identify the approximate percentile rank of their students’ college-going rate. These distributions are calculated by ranking schools on outcome without considering school size or number of graduates. Thus, if a school’s college-going rate is the same as the rate at the 75th percentile, the school is said to have a college-going rate equal to or higher than that of 75 percent of all StudentTracker schools in that category.
Results Tables & Figures
- Results for Public Non-Charter High Schools (.xlsx)
- Results for Public Charter High Schools (.xlsx)
- Results for Private High Schools (.xlsx)
- Supplemental Feature: Results for Public Non-Charter High Schools
- High Poverty High Schools (.xlsx)
- Low Poverty High Schools (.xlsx)
References
Bell, A. D., Rowan-Kenyon, H.T., & Perna, L.W. (2009). College knowledge of 9th and 11th grade students: Variation by school and state context. The Journal of Higher Education 80(6), 663‐685.
Black, S.E., Lincove J.A., Cullinane, J., & Veron, R. (2014). Can you leave high school behind? Retrieved from National Bureau of Economic Research website http://www.nber.org/papers/w19842
CLASP. (June 2015). Course, counselor, and teacher gaps: Addressing the college readiness challenge in high-poverty high schools. Retrieved from https://www.clasp.org/blog/addressing-college-readiness-challenge-high-poverty-schools/
Hossler, D, Schmit, J., & Vesper, N. (1999). Going to college: How social, economic, and educational factors influence the decisions students make. Baltimore, MD: The Johns Hopkins University Press.
Hurwitz, M., Smith, J.I., Howell, J., & Pender, M. (2012). The role of high schools in students’ postsecondary choices. (Advocacy & Policy Center Research Brief). New York, NY: The College Board.
Kena, G., Musu-Gillette, L., Robinson, J., Wang, X., Rathbun, A., Zhang, J., Wilkinson-Flicker, S., Barmer, A., & Dunlop Velez, E. (2015). The Condition of Education 2015 (NCES 2015-144). U.S. Department of Education, National Center for Education Statistics. Washington, DC. Retrieved from http://nces.ed.gov/pubsearch.
PCAST. (September 2010). Prepare and inspire: K-12 education in Science, Technology, Engineering, and Math (STEM) for America’s future. Retrieved from https://web.archive.org/web/20170112161456/https://www.whitehouse.gov/sites/default/files/microsites/ostp/pcast-stem-ed-final.pdf
Prescott, B. T. & Bransberger, P. (2012). Knocking at the college door: Projections of high school graduates (8th ed.). Boulder, CO: Western Interstate Commission for Higher Education.
Roderick, M., Coca, V., & Nagaoka, J. (2011). Potholes on the road to college: High school effects in shaping urban students’ participation in college application, four-year college enrollment, and college match. Sociology of Education 84(3), 178‐211.
U.S. Department of Commerce, Economics and Statistics Administration. (July 2011). STEM: Good jobs now and for the future. Retrieved from http://www.esa.doc.gov/Reports/stem-good-jobs-now-and-future
Wolniak, G. C. & Engberg, M. E. (2010). Academic achievement in the first year of college: Evidence of pervasive effects of high school context. Research in Higher Education, 51, 451‐467.
Appendix A: Methodological Notes
This report contains college enrollment and persistence outcomes for high school graduating classes of 2008, 2011, 2012, 2013, and 2014. The results presented in the report center on the following outcomes:
- College enrollment in the
- first fall after high school graduation;
- first year after high school graduation; and
- first two years after high school graduation
- Persistence from the first to the second year of college.
- College completion within six years after high school graduation.
The outcomes are presented by type of college attended, including public and private institutions, two-year and four-year institutions, and in-state and out-of-state institutions. These characteristics are defined by IPEDS Institutional Characteristics data as of 2012. In-state designations are defined relative to the state in which the high school is located, not the residency of individual students.
The high school dataset used for this report is based on a voluntary sample and is not a nationally representative sample of schools or of high school graduates. High school diploma data are submitted to the National Student Clearinghouse (the Clearinghouse) by schools and districts that participate in the StudentTracker for High Schools (STHS) service. High schools participating in this service pay a small fee (typically $425) to receive a packet of reports with postsecondary access and success outcomes for their graduating classes. In general, the participating schools tend to have greater representation among schools with lower income, higher minority enrollments, and urban locales.
This report is based on the data submitted to the Clearinghouse on graduating classes of 2008, 2011, 2012, 2013, and 2014. Table A1 below shows the number of participating high schools and high school graduates included in this report compared to the total number of US high schools and high school graduates. All types of high schools, including both public and private schools, participate in the Clearinghouse STHS service.
Table A1. Number of Public, Non-Charter High Schools and Public, Non-Charter High School Graduates Included in the Report
| Academic Year1 | Number of Participating High Schools | Percent of All U.S. Public High Schools2 | Percent of U.S. Grade 12 Enrollment Represented3 | Total N (Number of graduates in participating high schools) |
| 2007-2008 | 2,653 | 16% | 23.60% | 654,017 |
| 2010-2011 | 3,204 | 19% | 28.80% | 822,491 |
| 2011-2012 | 3,390 | 20% | 29.50% | 845,268 |
| 2012-2013 | 3,461 | 21% | 29.70% | 843,049 |
| 2013-2014 | 3,032 | 18% | 26.90% | 742,557 |
1Academic year is defined as the period between September 1-August 31.
2The total number of schools used in the denominator of this calculation was obtained from NCES’ Elementary and Secondary Information System (ELSi). The public school information is available from the Common Core of Data through 2012-13. The number of public, non-charter schools for 2013-14 is an estimate, equal to the number from 2012-13.
3The numbers used in both the denominator and numerator of this calculation were obtained from NCES’ Elementary and Secondary Information System (ELSi). Grade 12 enrollment information is available from the Common Core of Data through 2012-13. The numbers for 2013-14 are estimates, equal to the numbers from 2012-13.
Table A2. Number of Public, Charter High Schools and Public, Charter High School Graduates Included in the Report
| Academic Year1 | Number of Participating High Schools | Percent of All U.S. Public High Schools2 | Percent of U.S. Grade 12 Enrollment Represented3 | Total N (Number of graduates in participating high schools) |
| 2007-2008 | 155 | 12% | 17.70% | 11,739 |
| 2010-2011 | 238 | 16% | 20.60% | 17,625 |
| 2011-2012 | 265 | 16% | 20.50% | 20,802 |
| 2012-2013 | 281 | 15% | 20.60% | 22,404 |
| 2013-2014 | 253 | 14% | 18.30% | 21,261 |
1Academic year is defined as the period between September 1-August 31.
2The total number of schools used in the denominator of this calculation was obtained from NCES’ Elementary and Secondary Information System (ELSi). The public school information is available from the Common Core of Data through 2012-13. The number of public, charter schools for 2013-14 is an estimate, equal to the number from 2012-13.
3The numbers used in both the denominator and numerator of this calculation were obtained from NCES’ Elementary and Secondary Information System (ELSi). Grade 12 enrollment information is available from the Common Core of Data through 2012-13. The numbers for 2013-14 are estimates, equal to the numbers from 2012-13.
Table A3. Number of Private High Schools and Private High School Graduates Included in the Report
| Academic Year1 | Number of Participating High Schools | Percent of All U.S. Private High Schools2 | Percent of U.S. Grade 12 Enrollment Represented3 | Total N (Number of graduates in participating high schools) |
| 2007-2008 | 209 | 4% | 11.90% | 30,446 |
| 2010-2011 | 266 | 4% | 14.30% | 38,519 |
| 2011-2012 | 261 | 4% | 14.30% | 35,749 |
| 2012-2013 | 244 | 4% | 13.10% | 32,487 |
| 2013-2014 | 194 | 3% | 10.70% | 26,334 |
1Academic year is defined as the period between September 1-August 31.
2The total number of schools used in the denominator of this calculation was obtained from NCES’ Elementary and Secondary Information System (ELSi). The private school information is available from the Private School Survey, which is collected every two years through 2011-12. The number of private schools for 2010-11, 2012-13, and 2013-14 are estimates, equal to the number from the previous available year.
3The numbers used in both the denominator and numerator of this calculation were obtained from NCES’ Elementary and Secondary Information System (ELSi). Grade 12 enrollment information is available from the Private School Survey, which is collected every two years through 2011-12. The numbers for 2010-11, 2012-13, and 2013-14 are estimates, equal to the numbers from the previous available year.
Definitions of Public, Non-Charter High School Categories
We used the Common Core of Data (CCD) to construct the sampling frame of schools. The CCD is the Department of Education’s primary database on public elementary and secondary education in the United States. From the CCD, we created a sample frame that contains all regular public schools with a 12th grade.
In order to enable public, non-charter high schools to compare their own outcomes with those of similar high schools, the outcomes in this report are presented on the basis of school-level characteristics: low income and higher income, high minority and low minority, urban and rural. Membership in these categories for each academic year is based on CCD data for the corresponding year with one exception: for the academic year of 2013-2014, the categories are based on the information from the same source for 2012-2013.
Low income schools are defined as schools where at least 50 percent of the entire student population (not just graduating seniors) is eligible for free or reduced price lunch. Minority schools are defined as those schools where at least 40 percent of the students are Black or Hispanic. Locale is defined by the NCES urban-centric locale code. Schools with a code from 11 to 13 are defined as urban. Schools with a code from 21 to 23 are defined as suburban. And those with a code 31 to 43, covering both town and rural areas, are defined as rural.
Combinations of these characteristics results in 12 groups of high schools. Thus, the outcomes are presented for the following categories of high schools:
- Low income, high minority, urban
- Low income, low minority, urban
- Low income, high minority, suburban
- Low income, low minority, suburban
- Low income, high minority, rural
- Low income, low minority, rural
- Higher income, high minority, urban
- Higher income, low minority, urban
- Higher income, high minority, suburban
- Higher income, low minority, suburban
- Higher income, high minority, rural
- Higher income, low minority, rural
Table A4. Number of Public, Non-Charter High Schools and Public, Non-Charter High School Graduates Included in the Report by Category of High Schools
| Group | Academic Year | Number of Participating High Schools | Percent of U.S. Grade 12 Enrollment Represented | Number of States Represented | Total N (Number of graduates in sample) |
| Low Income, High Minority, Urban | 2007-08 | 325 | 32.60% | 32 | 71,175 |
| 2010-11 | 518 | 36.60% | 35 | 109,597 | |
| 2011-12 | 494 | 38.80% | 36 | 98,706 | |
| 2012-13 | 581 | 40.50% | 34 | 126,981 | |
| 2013-14 | 548 | 38.70% | 34 | 121,483 | |
| Low Income, Low Minority, Urban | 2007-08 | 40 | 43.60% | 15 | 9,833 |
| 2010-11 | 77 | 46.10% | 26 | 21,929 | |
| 2011-12 | 81 | 46.70% | 27 | 22,778 | |
| 2012-13 | 84 | 42.80% | 26 | 23,251 | |
| 2013-14 | 78 | 42.10% | 26 | 22,629 | |
| Low Income, High Minority, Suburban | 2007-08 | 70 | 22.40% | 19 | 21,147 |
| 2010-11 | 164 | 31.90% | 27 | 59,875 | |
| 2011-12 | 131 | 28.90% | 28 | 45,424 | |
| 2012-13 | 225 | 33.20% | 29 | 83,511 | |
| 2013-14 | 190 | 28.30% | 29 | 69,842 | |
| Low Income, Low Minority, Suburban | 2007-08 | 20 | 22.50% | 10 | 2,838 |
| 2010-11 | 43 | 26.00% | 14 | 9,059 | |
| 2011-12 | 49 | 27.10% | 15 | 11,258 | |
| 2012-13 | 80 | 33.20% | 19 | 20,656 | |
| 2013-14 | 75 | 33.20% | 17 | 20,811 | |
| Low Income, High Minority, Rural | 2007-08 | 25 | 6.00% | 10 | 5,401 |
| 2010-11 | 69 | 13.00% | 17 | 18,781 | |
| 2011-12 | 69 | 10.90% | 23 | 15,148 | |
| 2012-13 | 67 | 10.90% | 20 | 13,882 | |
| 2013-14 | 53 | 9.30% | 18 | 11,751 | |
| Low Income, Low Minority, Rural | 2007-08 | 199 | 9.10% | 16 | 7,396 |
| 2010-11 | 300 | 10.30% | 29 | 18,011 | |
| 2011-12 | 357 | 12.40% | 27 | 23,227 | |
| 2012-13 | 371 | 12.50% | 30 | 24,689 | |
| 2013-14 | 327 | 12.30% | 28 | 22,429 | |
| Higher Income, High Minority, Urban | 2007-08 | 196 | 30.80% | 21 | 46,778 |
| 2010-11 | 168 | 43.40% | 20 | 51,320 | |
| 2011-12 | 197 | 37.50% | 19 | 64,713 | |
| 2012-13 | 146 | 37.50% | 20 | 41,615 | |
| 2013-14 | 138 | 33.70% | 19 | 36,494 | |
| Higher Income, Low Minority, Urban | 2007-08 | 338 | 39.30% | 40 | 126,356 |
| 2010-11 | 323 | 47.90% | 42 | 123,776 | |
| 2011-12 | 318 | 49.60% | 42 | 122,729 | |
| 2012-13 | 328 | 47.50% | 43 | 126,189 | |
| 2013-14 | 301 | 42.90% | 38 | 110,969 | |
| Higher Income, High Minority, Suburban | 2007-08 | 112 | 26.90% | 18 | 44,425 |
| 2010-11 | 112 | 37.80% | 21 | 48,520 | |
| 2011-12 | 159 | 40.50% | 18 | 67,427 | |
| 2012-13 | 113 | 36.90% | 20 | 47,357 | |
| 2013-14 | 101 | 33.90% | 21 | 42,490 | |
| Higher Income, Low Minority, Suburban | 2007-08 | 530 | 27.60% | 42 | 200,168 |
| 2010-11 | 553 | 31.90% | 41 | 213,372 | |
| 2011-12 | 550 | 33.00% | 41 | 213,537 | |
| 2012-13 | 626 | 32.00% | 41 | 238,396 | |
| 2013-14 | 545 | 28.00% | 39 | 198,123 | |
| Higher Income, High Minority, Rural | 2007-08 | 31 | 10.90% | 14 | 8,225 |
| 2010-11 | 47 | 23.80% | 14 | 15,404 | |
| 2011-12 | 66 | 27.50% | 18 | 22,427 | |
| 2012-13 | 29 | 21.90% | 14 | 7,435 | |
| 2013-14 | 22 | 19.70% | 13 | 7,102 | |
| Higher Income, Low Minority, Rural | 2007-08 | 767 | 13.60% | 44 | 110,275 |
| 2010-11 | 830 | 18.00% | 46 | 132,847 | |
| 2011-12 | 919 | 18.80% | 47 | 137,894 | |
| 2012-13 | 811 | 15.90% | 45 | 89,087 | |
| 2013-14 | 654 | 14.40% | 44 | 78,434 |
The numbers used in both the denominator and numerator of this calculation were obtained from NCES’ Elementary and Secondary Information System (ELSi). The denominator is the number of grade 12 enrollments for all schools in a particular category of high schools. The numerator is the number of grade 12 enrollments for participating public high schools in the category. Grade 12 enrollment information is available from the Common Core of Data through 2012-13. The numbers for 2013-14 are estimates, equal to the numbers from 2012-13.
Supplemental Feature
In addition to our standard results for schools in low income and higher income categories, this year’s report also includes a supplemental feature that presents postsecondary outcomes for graduates from a subset of low income schools defined as high-poverty schools and a subset of higher income schools defined as low-poverty schools. High poverty schools are defined as those where at least 75 percent of the student population is eligible for free or reduced price lunch. Low poverty schools are defined as those where less than 25 percent of the student population is eligible for free or reduced price lunch. The outcomes for high poverty and low poverty schools are presented for the following categories of high schools:
- High poverty, high minority, urban
- High poverty, low minority, urban
- High poverty, high minority, suburban
- High poverty, low minority, suburban
- High poverty, high minority, rural
- High poverty, low minority, rural
- Low poverty, high minority, urban
- Low poverty, low minority, urban
- Low poverty, high minority, suburban
- Low poverty, low minority, suburban
- Low poverty, high minority, rural
- Low poverty, low minority, rural
Table A5. Number of Public, Non-Charter High Schools and Public, Non-Charter High School Graduates in High Poverty and Low Poverty Schools Included in the Report by Category
| Group | Academic Year | Number of Participating High Schools | Percent of U.S. Grade 12 Enrollment Represented | Number of States Represented | Total N (Number of graduates in sample) |
| Low Income, High Minority, Urban | 2007-08 | 133 | 37% | 20 | 24,984 |
| 2010-11 | 287 | 39% | 31 | 47,902 | |
| 2011-12 | 288 | 42% | 33 | 48,497 | |
| 2012-13 | 346 | 44% | 31 | 65,068 | |
| 2013-14 | 323 | 42% | 31 | 59,802 | |
| Low Income, Low Minority, Urban | 2007-08 | 5 | 74% | 3 | 823 |
| 2010-11 | 8 | 49% | 6 | 1,256 | |
| 2011-12 | 6 | 51% | 3 | 1,339 | |
| 2012-13 | 12 | 58% | 8 | 2,422 | |
| 2013-14 | 12 | 58% | 8 | 2,433 | |
| Low Income, High Minority, Suburban | 2007-08 | 6 | 11% | 4 | 979 |
| 2010-11 | 37 | 30% | 14 | 11,877 | |
| 2011-12 | 37 | 28% | 15 | 10,598 | |
| 2012-13 | 84 | 33% | 18 | 28,764 | |
| 2013-14 | 68 | 27% | 18 | 24,120 | |
| Low Income, Low Minority, Suburban | 2007-08 | 2 | 25% | 2 | 413 |
| 2010-11 | 4 | 21% | 2 | 401 | |
| 2011-12 | 8 | 31% | 4 | 772 | |
| 2012-13 | 11 | 60% | 6 | 2,534 | |
| 2013-14 | 12 | 63% | 7 | 2,819 | |
| Low Income, High Minority, Rural | 2007-08 | 8 | 7% | 5 | 1,733 |
| 2010-11 | 19 | 13% | 9 | 5,394 | |
| 2011-12 | 18 | 9% | 12 | 3,138 | |
| 2012-13 | 23 | 12% | 13 | 5,196 | |
| 2013-14 | 19 | 10% | 12 | 4,696 | |
| Low Income, Low Minority, Rural | 2007-08 | 79 | 7% | 5 | 530 |
| 2010-11 | 97 | 11% | 8 | 1,745 | |
| 2011-12 | 101 | 14% | 13 | 2,324 | |
| 2012-13 | 116 | 11% | 13 | 1,959 | |
| 2013-14 | 93 | 9% | 10 | 1,418 | |
| Higher Income, High Minority, Urban | 2007-08 | 25 | 36% | 7 | 7,770 |
| 2010-11 | 43 | 65% | 8 | 13,914 | |
| 2011-12 | 58 | 39% | 7 | 20,744 | |
| 2012-13 | 28 | 25% | 9 | 4,591 | |
| 2013-14 | 27 | 25% | 8 | 4,222 | |
| Higher Income, Low Minority, Urban | 2007-08 | 189 | 44% | 37 | 79,238 |
| 2010-11 | 148 | 52% | 34 | 61,264 | |
| 2011-12 | 145 | 55% | 34 | 60,591 | |
| 2012-13 | 144 | 51% | 33 | 61,188 | |
| 2013-14 | 135 | 47% | 32 | 55,917 | |
| Higher Income, High Minority, Suburban | 2007-08 | 14 | 20% | 6 | 5,639 |
| 2010-11 | 15 | 32% | 5 | 7,407 | |
| 2011-12 | 55 | 41% | 6 | 24,201 | |
| 2012-13 | 8 | 30% | 5 | 3,947 | |
| 2013-14 | 6 | 25% | 4 | 3,362 | |
| Higher Income, Low Minority, Suburban | 2007-08 | 374 | 28% | 37 | 149,650 |
| 2010-11 | 374 | 33% | 35 | 150,409 | |
| 2011-12 | 364 | 35% | 37 | 145,461 | |
| 2012-13 | 392 | 34% | 38 | 156,877 | |
| 2013-14 | 331 | 29% | 36 | 127,730 | |
| Higher Income, High Minority, Rural | 2007-08 | 7 | 11% | 5 | 1,755 |
| 2010-11 | 7 | 25% | 5 | 3,098 | |
| 2011-12 | 18 | 31% | 6 | 7,286 | |
| 2012-13 | 3 | 48% | 3 | 1,453 | |
| 2013-14 | 3 | 48% | 3 | 1,277 | |
| Higher Income, Low Minority, Rural | 2007-08 | 342 | 17% | 40 | 61,835 |
| 2010-11 | 282 | 22% | 40 | 59,650 | |
| 2011-12 | 305 | 23% | 41 | 61,723 | |
| 2012-13 | 243 | 20% | 32 | 33,317 | |
| 2013-14 | 177 | 17% | 30 | 26,755 |
The numbers used in both the denominator and numerator of this calculation were obtained from NCES’ Elementary and Secondary Information System (ELSi). The denominator is the number of grade 12 enrollments for all schools in a particular category of high schools. The numerator is the number of grade 12 enrollments for participating public high schools in the category. Grade 12 enrollment information is available from the Common Core of Data through 2012-13. The numbers for 2013-14 are estimates, equal to the numbers from 2012-13.
Postsecondary Data
College enrollment, persistence, and completion outcomes are determined by matching the graduate files received from high schools each year, to the postsecondary enrollment data held by the National Student Clearinghouse. The National Student Clearinghouse is a unique and trusted source for higher education enrollment and degree verification. Currently, Clearinghouse data include more than 3,600 postsecondary institutions and 98 percent of U.S. postsecondary enrollments (for detailed coverage of postsecondary enrollments see Appendix B). Because the database is comprised of student-level data, researchers can use it to link concurrent as well as consecutive enrollments of individual students at multiple institutions — a capability that distinguishes the Clearinghouse data from national databases built with institution-level data.
In order to preserve comparability to the reports that schools and districts receive on their graduates’ college access, persistence, and completion rates through the Clearinghouse’s StudentTracker service, results have not been adjusted to account for a student’s outcome not being captured due to noncoverage by Clearinghouse data.
Definitions of Outcomes
College enrollment in the first fall after high school graduation: Percentage of high school students who enrolled in a two- or four- year postsecondary institution in the fall semester immediately following graduation. The fall semester immediately following graduation is defined as any enrollment that occurs between August 15 and October 31.
College enrollment in the first year after high school graduation: Percentage of high school students who enrolled in a two- or four-year postsecondary institution in the academic year immediately following graduation. The first year after high school includes any enrollment that occurs between August 15 of the graduation year and August 14 of the following year.
College enrollment in the first two years after high school graduation: Percentage of high school students who enrolled in a two- or four-year postsecondary institution in the first two years following graduation. The first two years after high school includes any enrollment that occurs between August 15 of the graduation year and August 14 of the second year.
Persistence from first to second year of college: Percentage of students enrolled in the first year after high school graduation who remained enrolled in postsecondary education in the second year. This is the percentage of students who re-enrolled at any postsecondary institution, not necessarily the same one they started in. Thus, it is different from the typical measure of retention at the same institution.
College completion within six years after high school graduation: Percentage of high school students who attained a degree in a two- or four-year postsecondary institution in the six academic years immediately following graduation. Only associate’s, bachelor’s, and advanced degrees are counted in these rates. Certificates are not included.
STEM College Completions
Analysis is based on degree records that were awarded to students within six years of high school graduation. Only associate’s, bachelor’s, and advanced degrees are considered. Certificates are not included. The field of study, whenever reported by the postsecondary institution, is mapped to the NCES’ Classification of Instructional Programs (CIP) code. NCES classifies instructional programs by a six-digit CIP code at the most granular level and organizes them into CIP families by their two-digit prefix.
The definition of STEM (science, technology, engineering, and math) used in this analysis is based on a listing of six-digit CIP codes used by the National Science Foundation, and it includes the following disciplines:
- Biological and Agricultural Sciences
- Computer Sciences
- Earth, Atmospheric, and Ocean Sciences
- Engineering
- Mathematics
- Physical Sciences
- Psychology
- Social Sciences
If a student is awarded more than one degree and at least one of them is in a STEM discipline, the earliest STEM degree is considered for this analysis.