
Completing College – National – 2013
This second annual report on national college completions rates continues to respond to the limitations of institution-based research by focusing on student-level data, tracking the completion of postsecondary certificates and degrees among first-time degree-seeking students who started their postsecondary education in fall 2007 and tracking their enrollments nationwide for six years, through the spring of 2013. The report also introduces an enhancement to the first Completions Report by including in the cohort students who entered college with prior experience in college-level courses through dual enrollment opportunities while still in high school.
Suggested Citation: Shapiro, D., Dundar, A., Ziskin, M., Yuan, X., & Harrell, A. (2013, December). Completing College: A National View of Student Attainment Rates-Fall 2007 Cohort (Signature Report No. 6). Herndon, VA: National Student Clearinghouse Research Center.
Table of Contents
- About This Report
- Executive Summary
- Introduction
- Results
- EXTRA: Completing College: A National View of Student Attainment Rates — Fall 2007 Cohort
- Completion Rates for Dual Enrollment Students
- Overall Six-Year Outcomes
- Six-Year Outcomes by Enrollment Intensity
- Six-Year Outcomes by Age at First Entry
- Six-Year Outcomes by Age at First Entry and Enrollment Intensity
- Six-Year Outcomes by Starting Institutions Type
- Students Who Started at Four-Year Public Institutions
- Students Who Started at Two-Year Public Institutions
- Students Who Started at Four-Year Private Nonprofit Institutions
- Students Who Started at Four-Year Private For-Profit Institutions
- Discussion
- Completion Rates Beyond the Starting Institution
- Completion Rates by Age at First Entry
- Six-Year Outcomes by Gender
- Four-Year Completions for First-Time Students Who Started at Two-Year Public Institutions
- Completion Rates for Dual Enrollment Students
- Out-of-State Completions
- Seven-Year Outcomes for Fall 2006 National Cohort
- Implications for Public Policymaking
- References
- Appendix A: Methodological Notes
- Appendix B: Coverage Tables
- Appendix C: Results Tables
About This Report
AUTHORS
National Student Clearinghouse Research Center
- Doug Shapiro
- Afet Dundar
Project on Academic Success, Indiana University
- Mary Ziskin
- Xin Yuan
- Autumn Harrell
ACKNOWLEDGEMENTS
The authors would like to thank Peter Ewell and Patrick Kelly, of the National Center for Higher Education Management Systems (NCHEMS), for their thoughtful comments and suggestions; Robin LaSota, Post-Doctoral Research Associate from the University of Illinois at Urbana-Champaign for her assistance with writing and editing sections of the report; Vijaya Sampath, Jason DeWitt, and Diana Gillum from the National Student Clearinghouse Research Center for their work to make the Clearinghouse data analysis-ready and sharing their deep knowledge of the data with the authors; and the members of the Project on Academic Success team, Youngsik Hwang and Sarah Martin, for their efforts and thoughtful comments. Of course, any remaining errors or omissions are solely the responsibility of the authors.
SPONSOR
This report was supported by a grant from the Lumina Foundation. Lumina Foundation, an Indianapolis-based private foundation, is committed to enrolling and graduating more students from college — especially 21st century students: low-income students, students of color, first-generation students and adult learners. Lumina’s goal is to increase the percentage of Americans who hold high-quality degrees and credentials to 60 percent by 2025. Lumina pursues this goal in three ways: by identifying and supporting effective practice, through public policy advocacy, and by using our communications and convening power to build public will for change. For more information, log on to www.luminafoundation.org.
Executive Summary
This second annual report on national college completions rates continues to respond to the limitations of institution-based research by focusing on student-level data, tracking the completion of postsecondary certificates and degrees among first-time degree-seeking students who started their postsecondary education in fall 2007 and tracking their enrollments nationwide for six years, through the spring of 2013. The report also introduces an enhancement to the first Completions Report by including in the cohort students who entered college with prior experience in college-level courses through dual enrollment opportunities while still in high school.
The six-year outcomes examined in this report include completions at students’ starting institutions and transfer institutions, as well as persistence for those who had not earned a degree within six years. The report emphasizes students’ first completions throughout. For students whose first credential was awarded by a two-year institution, however, subsequent completions at four-year institutions are also reported. Six-year outcomes are presented by students’ gender, age, enrollment intensity, and the type of institution where first enrolled. This report expands on the two age groups reported previously by splitting the 24 and under age group into those older and younger than 20 years at the time of entry. We continue to present results for three categories of enrollment intensity: those enrolled exclusively full time throughout the study period, those enrolled exclusively part time, and those with a mix of full-time and part-time enrollments.
The tables and figures presented in this report explore the following:
- Six-year outcomes for the fall 2007 cohort overall and broken out by enrollment intensity;
- Six-year outcomes by student age at first entry overall and further broken out by enrollment intensity;
- Six-year outcomes by type of starting institution overall;
- Six-year outcomes by type of starting institution further broken out by age at first entry, enrollment intensity, and gender focusing on the students who started at four types of institutions specifically:
- Four-year public institutions,
- Two-year public colleges,
- Four-year private nonprofit institutions, and
- Four-year private for-profit institutions; and also
- Certificate and degree completions that occurred at institutions other than students’ starting institution, broken out by location within the same state as the starting institution, outside the state, or at a multistate institution.
For comparison to the 2006 cohort, which was the focus of the 2012 report, this report includes selected results for the fall 2007 cohort excluding former dual enrollment students. A supplemental feature also explores follow-up seven-year outcomes for the fall 2006 cohort.
PRINCIPAL FINDINGS AND IMPLICATIONS
The patterns revealed in this study reflect both the complexity of students’ postsecondary pathways and the distinctive enrollment behaviors among students following non-traditional pathways. The results suggest that conventional approaches to understanding college effectiveness and student success, limited to students’ enrollment at the starting institution only, fail to fully capture national completion rates. It also demonstrates that, as students attend multiple institutions on the way to their first completion, each of these institutions is likely to have contributed, in its own way, to each student’s pursuit and achievement of their educational goals. The findings help point the way to policies that recognize and promote such student success while also crediting the institutions that contribute to it.
Figure A. Six-Year Outcomes by Enrollment Intensity (N=2,386,291)
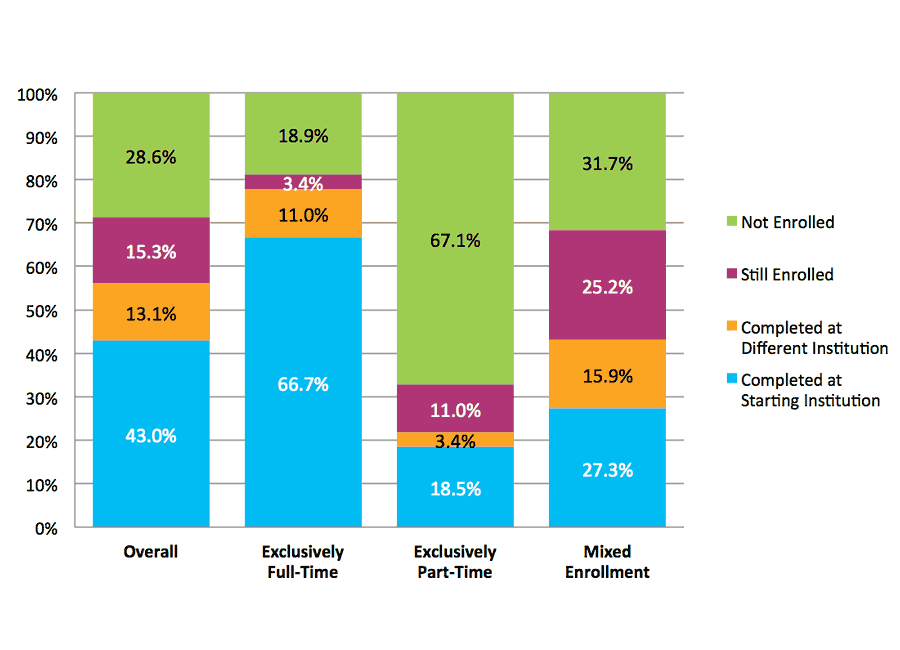
*This figure is based on data shown in Appendix C, Table 7.
More than a half (56.1 percent) of first-time degree-seeking students who enrolled in fall 2007 completed a degree or certificate within six years, including 13.1 percent who completed at an institution other than their starting institution. Completion rates varied considerably depending on enrollment intensity (Figure A) ranging from about 22 percent for exclusively part-time students to 77.7 percent among exclusively full-time students. Six years is sufficient for most exclusively part time students to complete a two-year degree, of course, but not a four-year degree. Nonetheless, only 11 percent of the exclusively part-time students were still enrolled or persisting during the final year of the study.
Figure B. Six-Year Outcomes by Starting Institution Type
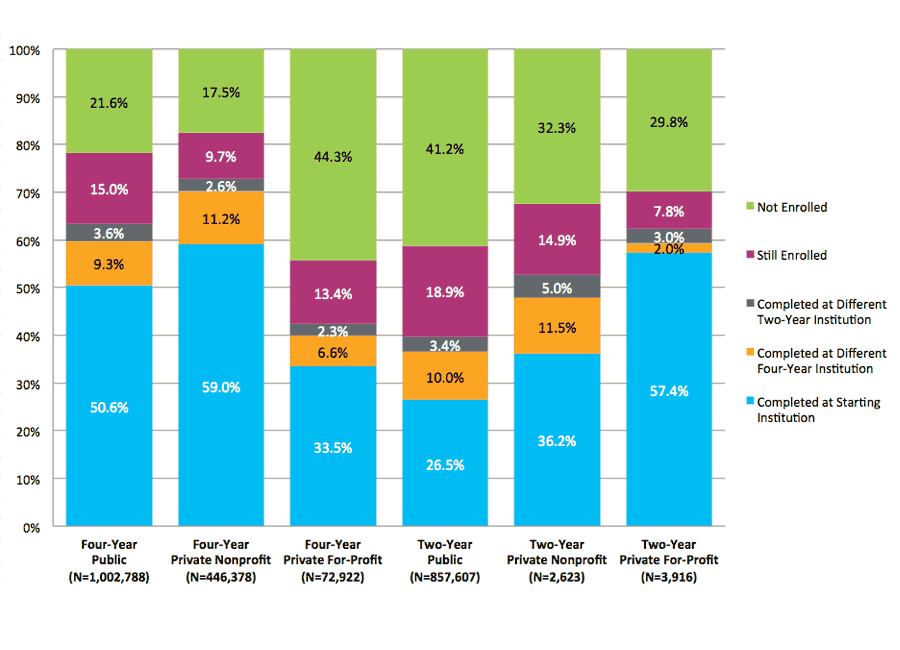
*This figure is based on data shown in Appendix C, Table 14.
The total completion rates for students who started at each of the three largest institution categories ranged from 40 percent for students who started at two-year public institutions to 63 percent for those who started at four-year public institutions and 73 percent for students who started at four-year private nonprofit institutions (Figure B). The proportion of students completing elsewhere, however, was roughly the same for students who started at any of these three largest institution types – about 13 to 14 percent of the starting cohort.
Comprehensive Completion Rates Beyond the Starting Institution
Accounting for completions beyond the starting institution raises the overall six-year completion rate above the halfway point, from 43 percent to 56 percent. Nationwide, nearly one in four students who completed a degree or certificate (23.4 percent) did so at an institution different from where they first enrolled. That figure was slightly higher (24.7 percent) for traditional-age students and was one in three (33.6 percent) for students who started in public two-year institutions. Accounting for these mobile students increased the completion rate for every institution type and student subgroup we studied. The increases ranged from 3 percentage points for exclusively part-time students to 11 percentage points for exclusively full-time students and 16 percentage points for students who attended both full time and part time during the six years.
Completion Rates Across Age Groups
Figure C. Six-Year Outcomes by Age at First Entry (N=2,373,802)
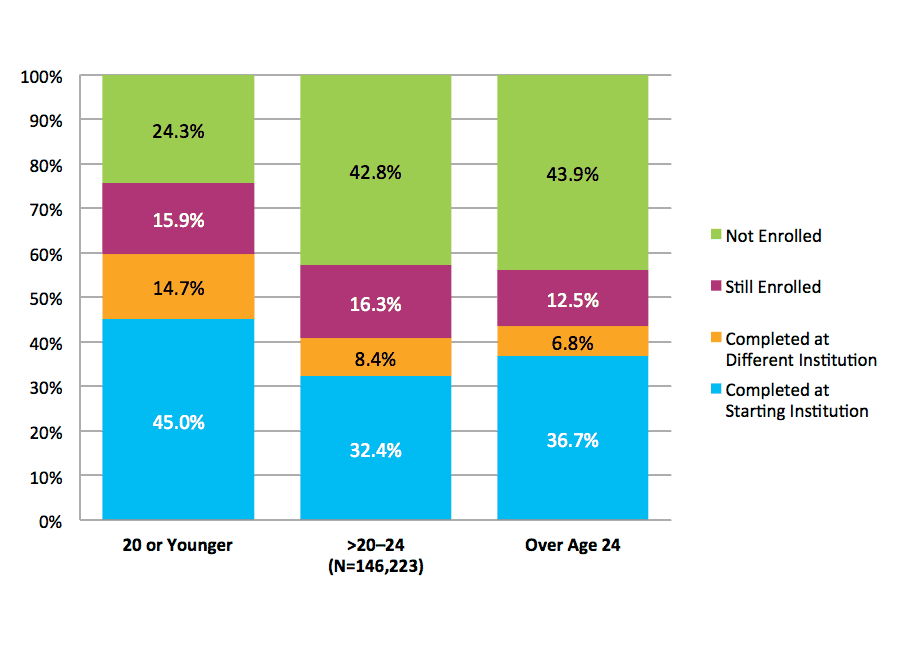
NOTE: Student with gender data missing were excluded from the above figure. This figure is based on data shown in Appendix C, Table 9.
In this study we introduced a new age category, hypothesizing that the outcomes of students who delayed entry by just a few years after high school would be different from those of traditional-age students and adult learners. We found that the persistence and completion rates for this group were notably lower than those of students in the traditional-age group, more closely resembling instead those of adult learners who entered college after age 24.
Gains from completions at institutions other than the starting institution were greater for students age 20 or younger at first entry into college than they were for older students: 14.7 percentage points, compared to 8.4 and 6.8 percentage points for the delayed entry and adult learner groups, respectively (Figure C). This left a sizable gap between the overall six-year completion rates of traditional-age students and adult learners, with the latter having a much lower total completion rate (43.5 percent vs. 59.7 percent). The total completion rate was lower still (40.8 percent) for delayed entry students. Disaggregating results by both age and enrollment intensity showed that exclusively part-time students over age 24 actually had a higher completion rate than did part-time students in either of the two younger age groups, contrary to the trend for full-time and mixed enrollment students. An important takeaway from these findings is that institutions may want to consider differentiated approaches appropriate to students who delay entry as well as for traditional age students and adult learners.
Compared to those of younger students, the success rates of adult learners varied greatly depending on the type of institution they attended. Full-time students who started at four-year private for-profit institutions, for example, completed at their starting institution at a rate more than 17 percentage points higher than their traditional-age counterparts. This pattern was reversed, however, for adult learners who started at any other type of institution, where full-time adult learners completed at lower rates than traditional-age students. These findings suggest that adult learners may be engaged differently across institutional contexts. Institutions in each of these sectors may benefit from comparing the outcomes of their own students to those of national and sector benchmarks, and perhaps adjusting their strategies for supporting adult learners to address their particular patterns of success.
Six-Year Outcomes by Gender
This report introduces data on student gender to the Clearinghouse’s measurement of completion rates, providing a new tool for understanding trends in student success that was not available in our 2012 report. Overall six-year completion rates for the fall 2007 national cohort showed a gender gap of 6.7 percentage points in favor of women. However, when results were disaggregated by age at first entry the advantage to women was concentrated among traditional-age students, with relatively small to nonexistent gaps among older students. When examined across institution types, the advantage of women among traditional-age students remained consistent, but other patterns emerged among older students. For example, the six-year completion rate for women adult learners who started at four-year public institutions was slightly lower than that for their male counterparts.
Four-Year Completions for First-Time Students Who Started at Two-Year Public Institutions
For students who started at two-year public institutions we examined the overall completion rates as well as completions at four-year institutions, giving particular attention to whether they received their four-year degree with or without first earning a credential at a two-year institution. Overall, 17.1 percent of two-year starters completed a degree at a four-year institution by the end of the study period, and over half of these did so without first obtaining a two-year degree. These students transferred and graduated from a four-year institution without receiving any credential from their starting (or from any other) two-year institution. Traditional graduation rate measures that focus only on completions at the starting institution do not account for this type of outcome, even though it is a well-worn pathway receiving increasing attention in today’s resource-constrained policy environment.
Completion Rates for Dual Enrollment Students
As an enhancement to the first Completions Report, this report introduces a larger study cohort by including former dual enrollment students, first-time college students who had enrolled in college courses while still in high school. When these students were added to the cohort, the overall completion rate jumped from 54 percent to 56 percent. Analysis of the postsecondary outcomes of former dual enrollment students showed a completion rate of 66 percent for this group, 12 percentage points higher than the rate for students with no prior dual enrollment experience. This descriptive study cannot speak to the effectiveness of dual enrollment programs per se, since there are undoubtedly strong selection effects in the sample of students who participate in these programs for which the data in this report does not account. Nonetheless, the results show that including students with prior dual enrollments in the starting cohort clearly increases the observed national college completion rate.
Seven-Year Outcomes for Fall 2006 National Cohort
Finally, this report looks at seven-year outcomes for the fall 2006 cohort, tracking their enrollment patterns through spring 2013. Within seven years, 43.7 percent of this cohort completed at their starting institution, while an additional 14.4 percent completed at a different institution, for a total completion rate of 58.1 percent nationally – a 4 percentage point increase over the six-year rate reported in our 2012 report. The largest increase was among students with mixed enrollment, whose total completion rate increased by 5.6 percentage points with the additional year. The seventh year of tracking also captured a larger proportion of completions for mobile students, who can often take longer to finish degrees. Nearly one quarter (24.7 percent) of the completers had earned their first credential somewhere other than their starting institution, compared to 22.4 percent of the same cohort when measured at the six-year point. These results suggest that tracking students for a longer period better captures outcomes for non-traditional students, such as those with mixed enrollments and multiple institutions in their pathways to the degree.
Exploring college completions at the student level provides an alternate, more comprehensive view of student progress and success in U.S. postsecondary education that captures the complexity of students’ postsecondary pathways. Moving in this direction can facilitate a shift in public and institutional policies that acknowledges and responds to student pathways that include institutional mobility, part-time and mixed enrollment, a gender gap that varies by age, and entry into college at different ages and life circumstances. This kind of shift will, moreover, allow policymakers to measure and credit the contributions of institutions that serve students who transfer or who enroll part time.
As higher education policy increasingly focuses on measuring student outcomes, it is important to ensure that we capture the full range of student enrollment, persistence, and completion behaviors. The findings highlighted in this report show the value and power of using comprehensive national student-level data, such as used for this report.
Introduction
FRAMING THE COLLEGE COMPLETION AGENDA
“By 2020, America will once again have the highest proportion of college graduates in the world” (Obama, 2009). More than four years after President Obama proposed the goal that has defined the national college completion agenda, college completion continues to be a prime focus for federal and state education policy in 2013. Notably, however, policy discussions and practical reforms currently driving the national completion agenda have shifted from focus on economic competitiveness to an emphasis on transparency, accountability, and affordability in higher education (Belfield, Crosta, & Jenkins, 2013; Jaschik, 2013). President Obama’s recent speeches and proposals on higher education accountability and ratings exemplify this shift in thought (Blumenstyk, 2013; Jaschik, 2013; Lewin, 2013), as do state-level discussions focused on performance-based funding for public institutions in general (National Conference of State Legislatures [NCSL], 2013; Petrick, 2012).
As part of the national impetus for higher education attainment and economic competitiveness, education policymakers have pressed for increased completions as well as for improvements in college affordability (Blumenstyk, 2013; Jaschik, 2013; Lewin, 2013). In March 2011, the U.S. Department of Education released the College Completion Tool Kit, outlining seven low-cost strategies based on promising state and local practices for governors to consider. The recommended strategies for postsecondary institutions included developing an action plan, embracing performance-based funding, aligning high school standards with college entrance and placement standards, making it easier for students to transfer, using data to drive decision making, accelerating learning and reducing costs, and targeting adult students. The Department of Education viewed these strategies not as requiring major financial investments, but rather as calling for “new ways of doing business and leadership that inspires new levels of collaboration among various stakeholders” (2011a, p. 4). In addition to funding various grant programs to promote student learning outcomes and college completion, the Department of Education has also set up state targets for increasing the number and percentage of college graduates (U.S. Department of Education, 2011c).
Recent research on the economic and social benefits of a postsecondary education, as well as gaps in college attainment between the various population subgroups, offers empirically grounded guidance for efforts to increase college completion in the United States (Baum, Ma, & Payea, 2013; Carnevale, Rose, & Cheah, 2011; Schneider, 2013; U.S. Bureau of Labor Statistics, 2013). Bachelor’s degree recipients earned $21,100 more than high school graduates ($56,500 and $35,400, respectively) in median annual earnings working full time, based on 2011 data (Baum et al., 2013). College-educated adults also have documented advantages in health insurance and pension coverage by employers, higher engagement in volunteerism and voting, healthier lifestyles (lower rates of smoking and obesity), and more time spent engaged with their children’s activities (Baum et al., 2013). Because of inequalities in college access and success, however, these economic and social benefits of postsecondary education are not evenly distributed across U.S. population groups, i.e., among children and youth from lower-income vs. middle- and upper-income families and from underrepresented minority groups. Among the lowest-income quintile, only 52% of high school graduates enrolled in college in 2012, whereas 65% of middle-income students enrolled in college, and 82% of the highest income students enrolled in college (Baum et al., 2013). Compared with White students, Black and Latino students have lower rates of bachelor’s degree attainment. The gap in bachelor’s degree attainment between Black males and White males, for example, grew from 13 percentage points in 2002 to 19 percentage points in 2012 (Baum et al., 2013). Moreover, research by the American Institutes of Research further documented that the economic returns from a college education vary by state, type of credential, field of study, and institution attended (Schneider, 2013).
A highly-educated workforce is widely acknowledged as essential for the U.S. to remain competitive in the global economy (Advisory Committee on Student Financial Assistance [ACSFA], 2012; Lee, Edwards, Menson, & Rawls, 2011). Based on international comparative data from the Organisation for Economic Cooperation and Development (OECD), however, the U.S. has considerable room for improvement in the postsecondary education measures for OECD’s 34 member countries (considered highly industrialized nations). It ranks fifth for postsecondary degree holders among 25-64 year olds, with an overall postsecondary attainment rate of 42% — trailing behind the Russian Federation, 53%; Canada, 51%; Israel, 46%; and Japan, 46% (OECD, 2013b); and 11 countries have surpassed the U.S. in the percentage of younger adults (aged 25-34) with a postsecondary degree (OECD, 2013b).
While baccalaureate degree attainment has increased from 2001 to 2010 in the U.S., as it has in a majority of countries, the postsecondary degree completion rates of American students are not as competitive internationally. Among OECD countries, the percentage of 25- to 64-year olds with a bachelor’s degree or higher increased seven percentage points, from 15% in 2001 to 22% in 2010 (National Center for Education Statistics [NCES], 2013). For this reason, through the college completion agenda, efforts to raise national postsecondary attainment figures have focused importantly, although not exclusively, on raising degree completion rates. While the U.S. ranks 8th in entry rates to university education among OECD countries (OECD, 2013a) at 72% in 2011, the percentage who would complete their postsecondary education is relatively lower and ranks 15th among OECD countries (OECD, 2013a).
In recent years, a wide range of organizations across the U.S. have launched initiatives in support of the college completion agenda. The College Board, for example, seeks to increase the prevalence of college-educated adults from the current level of 39% to 55% by 2025 (College Board, 2010; Lee et al., 2011), while the postsecondary success goal of the Bill and Melinda Gates Foundation (2009) is to help the nation double the number of low-income students enrolling by age 26, and Lumina Foundation’s Goal 2025 aims to “increase the percentage of Americans with high-quality degrees and credentials from the longstanding rate of 39 percent to 60 percent by the year 2025” (Lumina Foundation for Education, 2009, p. 1). While these organizations use diverse strategies in pursuit of a common goal, their initiatives all focus on a shared set of approaches (Russell, 2011): raising awareness of the issues among education stakeholders and mobilizing public support; aligning public policy with the college completion agenda; improving institutional outcomes through programmatic activity and a culture of student success; improving higher education productivity; refining the measures of completion; analyzing current policies and practices and identifying those that are most effective; and enhancing support for attainment among underrepresented students, especially those from low-income and minority groups. An unusually large number of organizations have responded to the call to increase college completions by launching an array of initiatives that focus on improving completion outcomes.
The current college completion agenda calls for major improvement in completion outcomes in an ambitious timeline. This agenda can succeed only with comprehensive and timely measures of student outcomes to inform all stakeholders about the progress made and to identify areas for further improvement. The National Student Clearinghouse Research Center is addressing this need by publishing annual reports on college completion rates for different types of students at different types of institutions, providing benchmarks at the national and state levels. This is the second report in the series.
CONSIDERATIONS FROM EXISTING REPORTS ON COLLEGE COMPLETION
As national discussions of the college completion agenda have matured, policy leaders in this national effort have called for more inclusive and responsive measures of completion (ACSFA, 2012; Committee on Measures of Student Success, 2011; Complete College America, 2013; Hauptman, 2012; Hossler, Dundar, & Shapiro, 2013). Two recent edited volumes (Kelly & Schneider, 2012; Perna & Jones, 2013) assembled a range of scholarly and policy perspectives to probe pressing questions regarding progress toward national college completion and attainment goals, address concerns regarding limitations of available data, and propose methodological improvements to data collection and use.
The National Center for Education Statistics (NCES) issued a report (Radford, Berkner, Wheeless, & Shepherd, 2010) on six-year persistence and attainment using data from the Beginning Postsecondary Students Longitudinal Study (BPS:04/09), a nationally representative sample of first-time students who started postsecondary education in 2003-04. By examining students’ persistence and degree attainment at their institutions of first enrollment (or starting institutions), as well as at any U.S. institution in the six-year timeframe, the NCES report highlights the complex and varied postsecondary pathways of U.S. students. These patterns include enrollment in certificate programs, transfer from two-year to four-year institutions, transfer from four-year to two-year institutions, transfer within the two-year or four-year sectors, and transfer across different institution types (e.g., public and private control, nonprofit and for-profit status).
Several recent reports have further highlighted degree attainment and persistence within specific institutional sectors. The American Association of Community Colleges (AACC), for example, released two policy briefs focusing on trends in educational attainment for community college students (Mullin, 2011) and challenges faced by community colleges (Mullin, 2010), drawing on evidence synthesized primarily from existing literature. Likewise, the Higher Education Research Institute (HERI) conducted a study on college completion at four-year institutions (DeAngelo, Franke, Hurtado, Pryor, & Tran, 2011), defining completion as graduation at the institution of origin (i.e., the institution where the Cooperative Institutional Research Program (CIRP) Freshman Survey was administered).
Despite calls for new measures of success, many national reports and studies depend on the customary, established measures (e.g., first-to-second year retention, first-time full-time cohort graduation rates, and degree awards) used by long-standing data sources, such as IPEDS. Consequently, reports like these will continue to have important limitations in capturing current enrollment trends and outcomes.
While the examples discussed above illustrate considerable discussion and activity related to the college completion agenda in research and policy reports, more research is needed using new measures and data sources that encompass the diverse range of college-going behaviors. Longitudinal analyses using student-level data will be instructive for developing more richly illuminated completion outcomes across institutions and sectors. Empirical studies that only use conventional measures of student success, such as completion rates at institutions of origin, are substantially limited in their ability to capture student outcomes and fail to recognize institutional efforts to encourage enrollment mobility (particularly at community colleges) that help students realize their individual educational goals. Except for a few national studies (e.g., Radford et al., 2010), most studies focus on a single institution or region using institutional- or state-level student unit record data and, therefore, fail to account for increasingly common enrollment behaviors, such as multi-institution enrollment, cross-state transfer, and transfer between institutional sectors (Bach et al., 2000; Hillman, Lum, & Hossler, 2008).
Research shows that increasingly more students attend multiple institutions before obtaining a postsecondary credential (Adelman, 2006; Bach et al., 2000; Dougherty & Kienzl, 2006; Doyle, 2009; Eagan & Jaeger, 2009; Goldrick-Rab & Pfeffer, 2009; McCormick, 2003; McCormick & Carroll, 1997; Peter, Cataldi, & Carrell, 2005). As reported in previous National Student Clearinghouse Signature Reports, one-third of all first-time-in-college students transferred to or enrolled at a different institution at least once within a five-year study period, one-quarter of all transfers did so more than once, and over one-quarter of all transfers crossed a state line in the process (Hossler et al., 2012a, 2012b). With Clearinghouse data, researchers have the potential to document complex patterns of student mobility, including reverse transfer and swirling, before degree completion (Adelman, 1999, 2006; Hossler et al., 2012a, 2012b; McCormick, 2003; McCormick & Carroll, 1997).
In addition to the diverse pathways students take while working toward their educational goals, students who enroll in college full time immediately after high school no longer represent the majority among postsecondary college students (Choy, 2002; Horn & Carroll, 1997; Reeves, Miller, & Rouse, 2011). Rather, many students delay college enrollment, enroll in college part time, and/or have a full-time job while enrolled. To balance the responsibilities of family, work, and school, these students often take educational routes that require a longer time to a postsecondary credential, such as enrolling part time, attending institutions with shorter terms, and occasionally stopping out. For these students, conventional measures of success — such as, graduation rates for institution-based, first-time full-time degree-seeking cohorts — are insufficient for understanding the particular risks and support structures that shape their academic careers (ACSFA, 2012; Committee on Measures of Student Success, 2011; Moore & Shulock, 2009; University Professional and Continuing Education Association Center for Research and Consulting & InsideTrack, 2012; U.S. Department of Education, 2011b). Moreover, institutional accountability measures based on conventional graduation rates may underestimate the complexity and cost associated with improving outcomes and may disadvantage institutions, such as many community colleges, that enroll large numbers of students following nontraditional pathways (Belfield, Crosta, & Jenkins, 2013). Consequently, a key aspect of recent research on college completion focuses on the development and adoption of new and more appropriate measures of success.
PROGRESS TOWARD NEW COLLEGE COMPLETION REPORTING
Two years ago, the Committee on Measures of Student Success prepared an advisory report for the U.S. Secretary of Education that included strategies to help two-year institutions calculate and report completion and graduation rates using current metrics (U.S. Department of Education, 2011b). This report included suggestions on expanding the measures to incorporate graduation rates for part-time student cohorts, and to recognize different transfer and persistence patterns (U.S. Department of Education, 2011b). Policy recommendations from the report also emphasized the reduction of barriers to access and persistence for underserved students, best practices at the state and institution levels, and the federal government’s role in implementing these best practices. However, existing data collection and reporting systems, as well as many widely-cited empirical studies, provide only a partial and fragmentary national picture of college completion.
The Clearinghouse has responded to the limitations of existing data collection and research studies with longitudinal analysis of students’ postsecondary completion outcomes across institutions and states. By identifying mixed, full-time, and part-time enrollment patterns among students, the Clearinghouse completions reports can compare degree attainment rates among students with each type of overall enrollment pattern over a six-year period. As research has also identified different enrollment patterns for college students of non-traditional age (e.g., students delaying enrollment in college for a few years after high school and those who enroll after age 24), these reports also compare degree completion rates for students entering college at different ages.
To reach a more comprehensive understanding of current progress toward the national completion goals, the National Student Clearinghouse Research Center, in partnership with the Project on Academic Success at Indiana University, launched the Signature Report series to analyze longitudinal college student outcomes using Clearinghouse data. Building on findings from previous Signature Reports, this report focuses on a key student success outcome aligned with national college attainment goals: first college completion rates, encompassing postsecondary credentials of all levels and types. Specifically, this report focuses on the six-year completion outcomes of a cohort of first-time-in-college students who started postsecondary education at U.S. colleges and universities in fall 2007. Former dual enrollment students, first-time college students who had enrolled in college courses while still in high school, were also included in the cohort for this study. First completion, the primary focus of this report, is investigated in detail with regard to institutions of origin and destination as well as by student age at first entry and enrollment intensity. Building on the comprehensiveness and the timeliness of Clearinghouse enrollment and completion data, this report aims to contribute to research and policy discussions about college completion by providing an alternate, more detailed view of student progress and success in U.S. postsecondary education.
WHAT TO FIND IN THIS REPORT
This report focuses on student completion of postsecondary certificates and degrees among first-time-in-college degree-seeking students who initially enrolled in public, private nonprofit, and private for-profit two-year and four-year colleges and universities nationwide in fall 2007. The study followed the fall 2007 cohort’s college enrollment behaviors for six years, through the spring of 2013. The study cohort also included former dual enrollment students, first-time college students who had taken college courses while still in high school.
Six-year outcomes provided in this report include completions at students’ starting institution, completions at an institution other than the starting institution, and continued enrollment of non-completers through the end of the study period. While the report emphasizes students’ first completions throughout, for students whose first credential was awarded by a two-year institution, subsequent completions at four-year institutions are also reported. Six-year postsecondary outcomes are presented by students’ age at first entry into college, by enrollment intensity, and by the type of institution where students first enrolled. In response to findings from Signature Report 4, Signature Report 6 expands upon the binary comparison between students who entered college at age 24 or younger versus those who were older than 24 at first entry. Three age groups are defined in the current report: students who were 20 years old or younger at first entry, those who were over age 20 through age 24 at first entry, and those who were over age 24 at first entry. The report also presents results for students in three categories of enrollment intensity: students enrolled exclusively full time throughout the study period, those enrolled exclusively part time, and those whose enrollments showed both full-time and part-time terms during the six years examined (mixed enrollment students).
The tables and figures presented in this report explore the following for the fall 2007 cohort, including dual enrollment students:
- Six-year outcomes overall and broken out by enrollment intensity;
- Six-year outcomes by student age at first entry overall and further broken out by enrollment intensity;
- Six-year outcomes by type of starting institution overall;
- Six-year outcomes by type of starting institution further broken out by age at first entry, enrollment intensity, and gender, focusing on the students who started at four types of institutions specifically:
- Four-year public institutions,
- Two-year public colleges,
- Four-year private nonprofit institutions, and
- Four-year private for-profit institutions; and also
- Certificate and degree completions that occurred at institutions other than students’ starting institution, broken out by location within the same state as the starting institution, outside the state, or at a multistate institution.
Selected results are reported for the fall 2007 cohort, excluding former dual enrollment students, and separately only for former dual enrollment students.
A supplemental feature explores seven-year postsecondary outcomes for the fall 2006 cohort.
A NOTE ON THE DATA
Data Source
The data for this report were drawn from the StudentTracker® and DegreeVerifySM services, administered by the National Student Clearinghouse® (The Clearinghouse), which tracks 95 percent of college enrollments nationwide across all postsecondary institutions, including all institution types: two-year and four-year institutions, public and private institutions, and nonprofit and for-profit institutions. In order to ensure the most accurate possible representation of student outcomes for the study cohort, the results reported here are weighted according to the formula described in Appendix A using the state-by-state coverage rate for each institution type (sector and control). A complete explanation of national coverage rates and the weights used to ensure that results reflect enrollment and completion by sector and control can be found in Appendices A and B.
The student outcomes captured in this report are based on student-level data representing an unduplicated headcount of students across all institutions, a feature of the Clearinghouse data sets that distinguishes them from many other data sources, including the Integrated Postsecondary Education Data System (IPEDS), that may not accurately capture the complexity of postsecondary pathways because they are not structured to identify multiple enrollments by individual students. The capability of StudentTracker to link enrollment records across institutions nationally allows researchers to follow students longitudinally as they move from institution to institution, producing a fuller picture of college persistence and completion.
Although Clearinghouse data contain demographic information on students, historical coverage rates for the demographic data elements are uneven. Therefore, the results summarized in this report give a national overview of college completion by age at first entry and by enrollment intensity, showing the percentage of students who enrolled or completed at various types of institutions, but they do not examine completion by race/ethnicity, for example.
Cohort Definition
The cohort examined in this study is made up of first-time degree-seeking students, of any age, who began their postsecondary studies in the fall of 2007. Showing intent to seek a degree or certificate was defined as follows1:
- For students who started at four-year institutions, enrolled at least one term with an intensity of half-time or higher, and
- For students who started at two-year institutions, either:
- Enrolled full-time for at least one term before August 15, 2008, or
- Enrolled at least half-time for any two terms before December 31, 2008.
1 For comparison purposes, the results for non-degree seeking students who started at two-year public institutions are presented in Appendix C.
First-time status was established by confirming that a student (1) did not show any postsecondary enrollment record in the four years prior to the student’s fall 2007 enrollment, and (2) did not receive a degree or certificate from any postsecondary institution prior to fall 2007, according to Clearinghouse data. An exception was made for former dual enrollment students: first-time college students in fall 2007 who had taken college courses while still in high school were included in the study cohort.
Depending on the strengths and limitations of the data sets they use in their analysis, researchers face considerable complexity in operationalizing the category “first-time student.” For this report, the Clearinghouse and the Project on Academic Success (PAS) balanced competing priorities in selecting a method for identifying the study cohort. On the one hand, Clearinghouse data allowed the researchers to capture a unique headcount of students nationally and, therefore, to follow individual students while also accounting for concurrent enrollments. In addition, Clearinghouse data allowed the researchers to establish first-time enrollment status empirically, i.e., by searching for prior enrollments rather than by relying on institutions’ reports, which may include idiosyncratic definitions as well as errors in transactional records. On the other hand, some limitations do arise with the method for identifying the study cohort in this report.
Because Clearinghouse data on designations for class year are incomplete, for example, the researchers were not able to use them for this report. Consequently, this study’s sample may include students who have more than 30 Advanced Placement (AP), International Baccalaureate (IB), or dual enrollment credits (students included in this study’s sample as first-time students who, in fall 2007, were enrolled in college courses while still in high school) and who may not be considered freshmen by their institutions, despite having first-time-in-college status. Moreover, because of inconsistencies in the historical depth of DegreeVerify database records, it is possible that a small number of graduate students are also included in the study cohort. (For a full discussion of data, definitions, and limitations, please see Appendix A.)
Throughout this report, we examine college completion rates for the fall 2007 cohort. The study followed the cohort through May 31, 2013, and highlighted six-year student outcomes, including degree and certificate completion and continuing enrollment (persistence). Completions were identified using a combination of degree/certificate award records submitted by institutions as part of their participation in DegreeVerify as well as StudentTracker enrollment records indicating completions of a certificate or degree.
Former dual enrollment students, identified as those whose postsecondary enrollment or degree record prior to fall 2007 occurred before the student turned 18 years old, represent 15.6 percent of the fall 2007 cohort. By sector, these students represent 17 percent of those who started in four-year public institutions, 15 percent of the students who started in two-year public institutions and 15 percent of those who started in four-year private nonprofit institutions. Only two percent of the students who started in four-year private for-profit institutions had prior dual enrollments. The main part of the results section discusses completion rates for the full cohort including former dual enrollment students. For easier comparison to the 2012 Completions report, this report also contains separate completion rates for the cohort, excluding dual enrollment students, as well as for dual enrollment students only.
Figure 1. Fall 2007 Cohort by Starting Institution
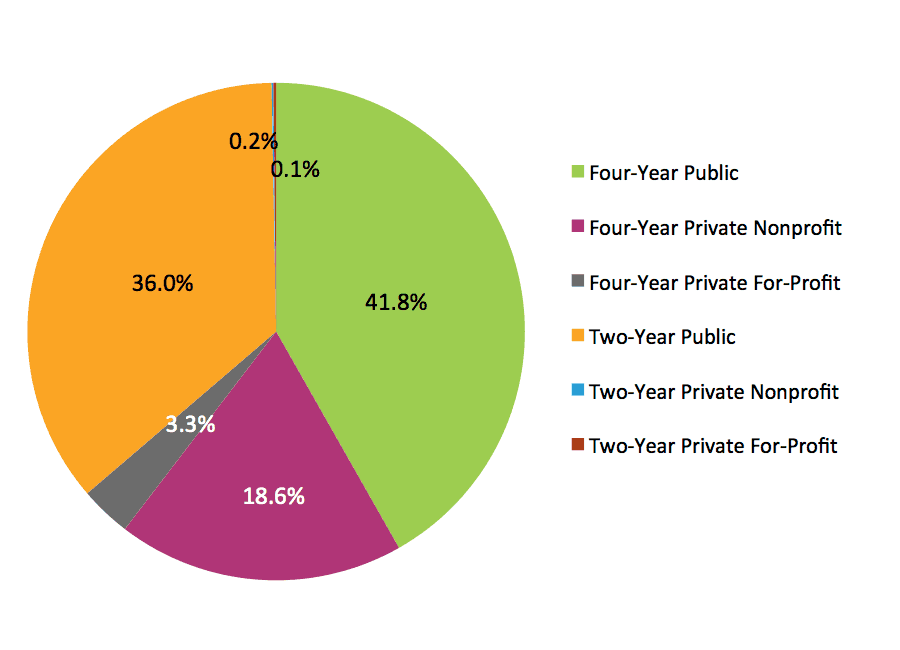
*This figure is based on data shown in Appendix C, Table 6.
Figure 1 shows the fall 2007 cohort (n=2,397,524) that includes former dual enrollment students broken out by type of starting institution. Four-year public institutions enrolled the largest percentage of the cohort (41.8 percent, n=1,001,685), followed by two-year public institutions, with 36.0 percent (n=862,551), and four-year private nonprofit institutions, enrolling 18.6 percent (n=448,481) of the cohort. Four-year private for-profit institutions enrolled a small percentage comparatively, 3.3 percent (n=80,300), while two-year private nonprofit institutions and two-year private for-profit institutions both enrolled less than one percent of the cohort.
Figure 2. Fall 2007 Cohort by Age at First Entry
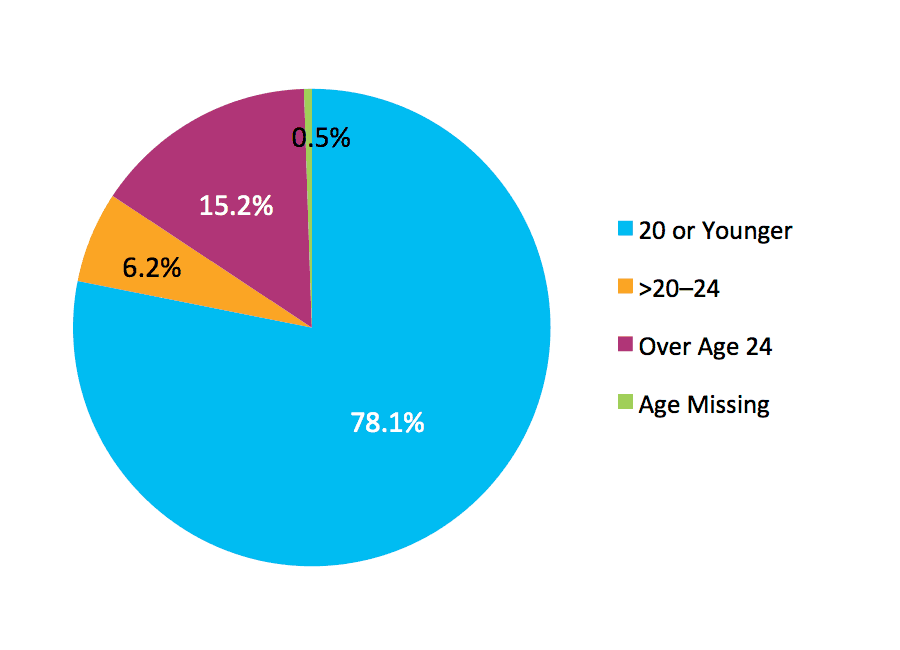
*This figure is based on data shown in Appendix C, Table 1.
Figure 2 shows that 14.9 percent of the study cohort were over age 24 at the time of first entry to college, while 78.4 percent were age 20 or younger at first entry and 6.1 percent were between the ages of 21 and 24 at first entry. The birthdate was missing for less than one percent of the cohort.
Figure 3. Fall 2007 Cohort by Enrollment Intensity
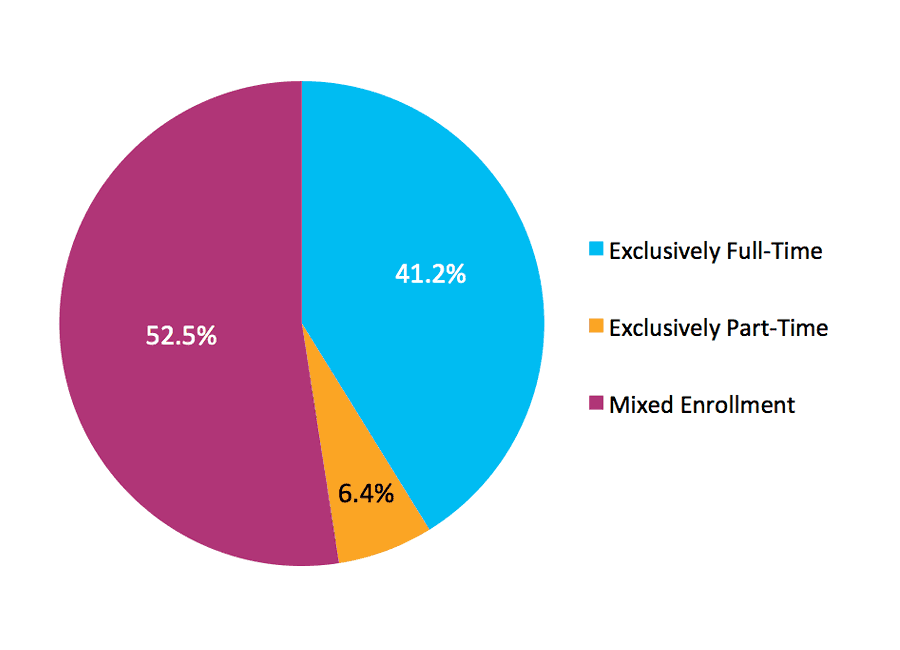
*This figure is based on data shown in Appendix C, Table 2.
Figure 3 focuses on students’ enrollment intensity, and shows that 41.2 percent of the study cohort enrolled exclusively full time throughout the study period while 6.3 percent enrolled exclusively part time. “Exclusively” means during all regular terms, excluding summers, in which the student was enrolled, and thus does not preclude stop-outs. A key point to note is that a majority of the cohort (52.5 percent) showed mixed enrollment; that is, they enrolled full time for some terms and part time for other terms during the study period (see Appendix A for further detail).
It is important to note that this is a significantly different definition of enrollment status than the one commonly used in graduation rate studies based on IPEDS data. IPEDS cohorts are determined by student enrollment status in the first fall term only. By contrast, this report considers student enrollment status over time and across institutions, allowing for a more nuanced classification.
Figure 4. Fall 2007 Cohort by Gender
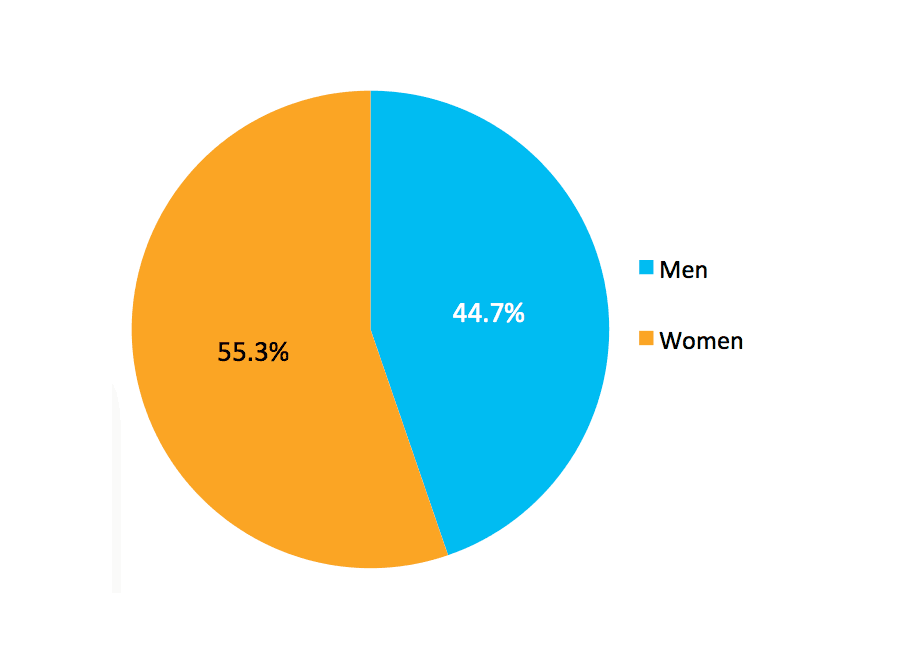
*This figure is based on data shown in Appendix C, Table 4.
The representation of men and women within the cohort is shown in Figure 4. Consistent with national figures on participation in postsecondary education, women make up more than half of the cohort, at just over 55 percent.
Table 1. Fall 2007 Cohort by Age at First Entry and Enrollment Intensity
| Age at First Entry | Enrollment Intensity | Weighted Count | Percentage of Age Group |
| 20 or Younger | Overall |
1,870,837 |
100.0 |
| Exclusively Full-Time |
830,981 |
44.4 |
|
| Exclusively Part-Time |
48,212 |
2.6 |
|
| Mixed Enrollment |
991,644 |
53.0 |
|
| >20-24 | Overall |
146,223 |
100.0 |
| Exclusively Full-Time |
49,817 |
34.1 |
|
| Exclusively Part-Time |
14,553 |
10.0 |
|
| Mixed Enrollment |
81,852 |
56.0 |
|
| Over Age 24 | Overall |
356,742 |
100.0 |
| Exclusively Full-Time |
97,246 |
27.3 |
|
| Exclusively Part-Time |
85,127 |
23.9 |
|
| Mixed Enrollment |
174,369 |
48.9 |
|
| Age Missing | Overall |
12,489 |
100.0 |
| Exclusively Full-Time |
4,632 |
37.1 |
|
| Exclusively Part-Time |
2,298 |
18.4 |
|
| Mixed Enrollment |
5,559 |
44.5 |
Finally, Table 1 shows the distribution of the study cohort by age at first entry and enrollment intensity. For all three age groups, students with mixed enrollment intensity represented the largest proportions. Among students who were 20 years old or younger at first entry, 53.0 percent had mixed enrollment, followed by students who enrolled exclusively full-time (44.4 percent). Students with exclusively part-time status represented only 2.6 percent of this youngest group. Among students who were over 24 at first entry, a similarly large percentage (48.9 percent) showed mixed enrollment. However, in contrast to the younger groups, 23.9 percent of students who were over 24 at first entry enrolled exclusively part time throughout the study period, while only a slightly larger proportion (27.3 percent) enrolled exclusively full time.
Results
EXTRA: COMPLETING COLLEGE: A NATIONAL VIEW OF STUDENT ATTAINMENT RATES – FALL 2007 COHORT
This Signature Completions Extra presents the six-year outcomes for the fall 2007 cohort, not including dual enrollment students. The data will allow readers to compare the fall 2007 cohort results to the fall 2006 cohort results that were presented in November 2012 as part of Signature Report 4, the National Student Clearinghouse Research Center’s first college completion study.
COMPLETION RATES FOR DUAL ENROLLMENT STUDENTS
The cohort used in this year’s report includes 374,095 former dual enrollment students. These are first-time college students in the fall 2007 cohort who had previously taken dual enrollment courses or courses that earned both high school an6td college credit. Based upon a representative survey of public high schools, the National Center for Education Statistics (Thomas, Marken, Gray, & Lewis, 2013) estimated an annual growth rate of more than 7 percent from 2002-03 to 2010-11 for the number of college courses taken by high school students. In 2002-03, high school students took an estimated 1.2 million college courses; by 2010-11, high school students enrolled in approximately two million college courses (Thomas et al., 2013). Approximately 1.4 million of college course enrollments by high school students in 2010-11 were academically-oriented and 0.6 million focused on career, vocational, or technical fields.
In this report, former dual enrollment students represent 15.6 percent of the overall cohort of degree-seeking, first-time entrants into postsecondary education in fall 2007. Given the substantial growth of dual enrollment in the United States and states’ attention to dual enrollment programs to improve college completion rates, the report includes this population of students and documents completion and other postsecondary outcomes for this group by enrollment intensity and age group.
Table D-1. Six-Year Outcomes for Dual Enrollment Students by Enrollment Intensity (N=374,095)
| Total Completion Rate | Completion at Same Institution | Completion at Different Institution | Still Enrolled (At Any Institution) | Not Enrolled (At Any Institution) | ||
| Two-Year | Four-Year | |||||
| Overall | 66.01 | 48.90 | 3.76 | 13.36 | 14.40 | 19.59 |
| Full-Time | 85.40 | 72.82 | 2.36 | 10.22 | 3.01 | 11.60 |
| Part-Time | 20.54 | 17.68 | 2.13 | 0.73 | 12.26 | 67.20 |
| Mixed Enrollment | 52.23 | 30.65 | 5.00 | 16.58 | 23.94 | 23.83 |
As noted earlier, the college completion rate for the fall 2007 cohort, excluding students with previous dual enrollment, was 54.2 percent. Among the former dual enrollment students starting college in fall 2007, the college completion rate was substantially higher — 66 percent. Among exclusively full time students, those with previous dual enrollment courses had a higher completion rate than non-dual enrollment students (85.4 percent and. 76.2 percent, respectively). Dual enrollment students with mixed enrollment intensity also had a higher completion rate than non-dual enrollment students with the same enrollment intensity (52.2 percent and 41.5 percent respectively). Very few dual enrollment students enrolled exclusively part-time (only 9,960 students, or about 3 percent), and their completion rate was slightly lower than the rate for non-dual enrollment students who enrolled exclusively part time (20.5 percent and 21.9 percent, respectively).
Table D-2. Six-Year Outcomes for Dual Enrollment Students (N=374,095)
| Total Completion Rate | Completion at Same Institution | Completion at Different Institution | Still Enrolled (At Any Institution) | Not Enrolled (At Any Institution) | ||
| Two-Year | Four-Year | |||||
| Overall | 66.01 | 48.90 | 3.76 | 13.36 | 14.40 | 19.59 |
| 20 and Younger | 66.53 | 49.25 | 3.76 | 13.52 | 14.33 | 19.13 |
| 21-24 | 40.42 | 30.26 | 3.47 | 6.68 | 18.57 | 41.01 |
| Older than 24 | 50.41 | 38.53 | 2.02 | 9.86 | 18.14 | 31.45 |
| Age Missing | 80.13 | 75.39 | 3.98 | 0.76 | 0.15 | 19.73 |
Nearly all of the former dual enrollment students who entered postsecondary education in the fall 2007 cohort were traditional-age students (97.7 percent2) and a higher proportion of them completed their first college degree within six-years as compared to traditional age non-dual enrollment students (66.5 percent and 58.2 percent, respectively).
When former dual enrollment students were added to the cohort, the overall completion rate jumped from 54 percent to 56 percent. This is not surprising because these students already had some college credit to start with. More pointedly, their higher completion rate in this descriptive study cannot speak to the effectiveness of dual enrollment programs per se, since there are selection effects in the sample of students who participate in these programs that the data in this report could not quantify. That is, many of the students with prior dual enrollment credits would have been more likely to graduate from college anyway.
2Slightly over two percent of the former dual enrollment students were older than 20 years old in fall 2007, meaning they delayed their entry into college and were not traditional-age students, as defined in this study, at first entry.
OVERALL SIX-YEAR OUTCOMES
The results presented in this report focus on six-year outcomes of degree-seeking students who entered postsecondary education for the first time in fall 2007. The report places particular emphasis on each student’s first instance of completion. The near-census student enrollment data from the Clearinghouse enables researchers to track student educational pathways even when they cross institutions, sectors, and state lines. Within this context, using Clearinghouse data, we present a national picture of college completion, and further explore college outcomes for students of different age groups and enrollment intensity.
Six-year Outcomes by Enrollment Intensity
The national goals for increasing college attainment entail raising completion rates for all students, regardless of whether they initially enrolled in four-year or two-year institutions. For that reason, we begin the presentation of results by showing the six-year outcomes for the entire study cohort, without consideration of starting institution type.
Figure 5. Six-Year Outcomes by Enrollment Intensity (N=2,386,291)
*This figure is based on data shown in Appendix C, Table 7.
Figure 5 shows six-year student outcomes, including first degree or certificate completion, continuing enrollment during the last year of the study period, and stop-out. Results are shown for the full cohort and are broken out by enrollment intensity, showing outcomes for students who were enrolled exclusively full time, exclusively part time, and with mixed enrollment (i.e., enrolled both part time and full time during the study period).
Overall, 43.0 percent of the cohort completed at their starting institution, and an additional 13.1 percent completed first at a different institution, for a combined completion rate of 56.1 percent nationally. The percentage of students who had completed or were still enrolled at the end of the study period exceeded 70 percent.
The data used in this report enable researchers to follow students as they move across institutions, unveiling a fuller picture of college completion than is possible to assemble from institution-level data or statewide data sets. Furthermore, the results extend the view offered by other data sets by including outcomes for students who consistently or intermittently enrolled part time.
Results broken out by the three enrollment intensity categories (exclusively full-time, exclusively part-time, or mixed enrollment) show marked differences. Exclusively full-time students (a group that comprised 41.2 percent of the cohort) showed a total completion rate of 77.7 percent, including 11.0 percent who completed at institutions other than their starting institution. An additional 3.4 percent of these students were still enrolled at the end of the study period, leaving only 18.9 percent without a degree or certificate and no longer enrolled during the last year of the study period.
Not surprisingly, given the longer time to degree required when attending college part time, the small minority who enrolled exclusively part time (6.3 percent of the cohort) showed much lower rates of completion within six years. Particularly for bachelor’s degrees, it is clear that six years is not an adequate time frame for students who enroll exclusively part time. The study results show this quite clearly. Among part-time students, only 18.5 percent completed degrees or certificates at their starting institution, while an additional 3.4 percent completed at a different institution. Notably, only 11.0 percent were still enrolled at the end of the study period, with 67.1 percent not enrolled anywhere in the last year of the study period. It is important to note that, particularly in connection with results on exclusively part-time students’ outcomes, following students over longer periods is clearly appropriate, as attending part-time necessarily entails a longer time to degree. Nevertheless, the low percentage of part-time students who were still enrolled at the end of six years (11.0 percent) suggests that the pattern is not simply a matter of students following longer timelines to degrees. Results show that many exclusively part-time students left postsecondary education without completing a credential.
The majority of the students in the cohort (52.5 percent) had a mix of full-time and part-time enrollments. Among these students, the total completion rate was 43.2 percent, with 27.3 percent completing first at their starting institution and 15.9 percent completing first at a different institution. A key finding is that the highest proportion of students still enrolled at the end of the study period (without completing a degree or a certificate) appeared among mixed enrollment students. More than one quarter of this group (25.2 percent) were still enrolled, leaving the percentage of stop-outs at 31.7 percent. These results further underscore the need to improve college completion measures by following students over longer periods, as mixed enrollment patterns — such as those shown by a majority of students in the 2007 cohort — naturally entail longer time to degree. It is important to note, that those students who are shown here as “stopped-out” (i.e., those who showed no enrollment for the last 12 months of the study period) may enroll again at any time after the close of study period.
Figure 6. Completion at Starting vs. Different Institution by Enrollment Intensity
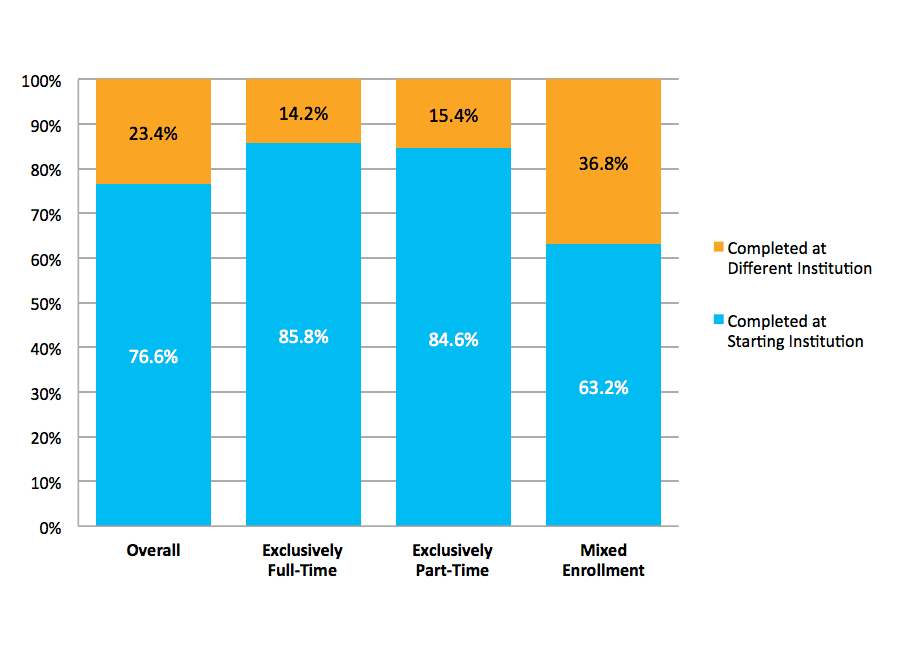
*This figure is based on data shown in Appendix C, Table 7.
Figure 6 shows the proportions of completers who completed first at their starting institution versus at a different institution for each enrollment intensity group. Overall almost one in four, 23.4 percent of all completers, earned their first credential somewhere other than their starting institutions. For both exclusively full-time and exclusively part-time students, slightly less than one-sixth obtained their degrees at a different institution (14.2 percent and 15.4 percent, respectively). In contrast, among mixed enrollment completers, more than one-third completed first at an institution other than the one where they first enrolled (36.8 percent).
Figure 7. Six-Year Outcomes by Gender (N=2,205,243)
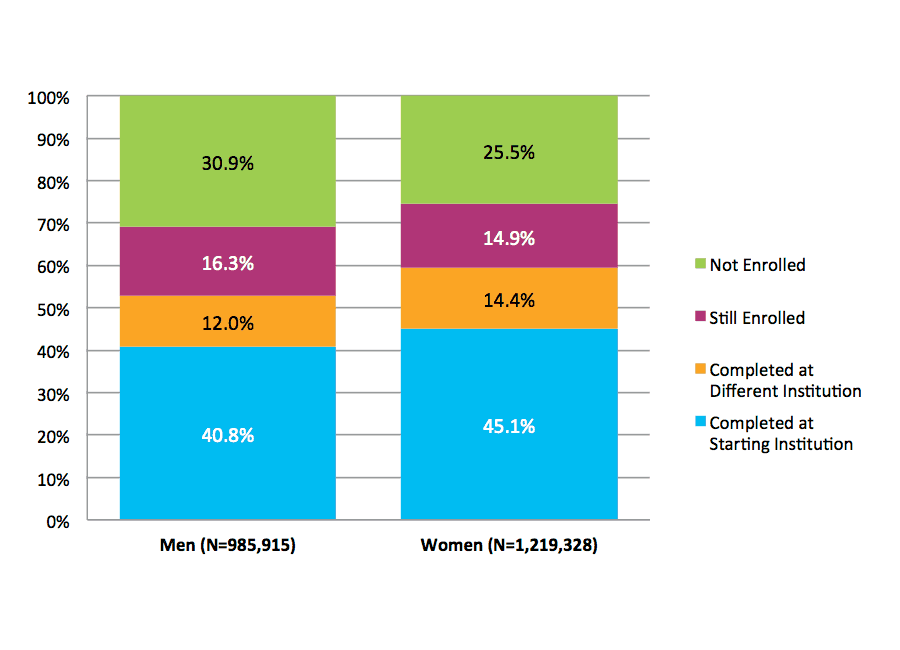
NOTE: Student with gender data missing were excluded from the above figure. This figure is based on data shown in Appendix C, Table 8.
Figure 7 shows six-year outcomes for the 2007 fall cohort by gender. The results show higher completion rates for women as compared to men (59.5 versus 52.8 percent). However, a slightly lower percentage of women (14.9 percent) than men (16.3 percent) were still enrolled at the end of the study period, leaving 25.5 percent of women having stopped out, compared to 30.9 percent of men.
Six-year Outcomes by Age at First Entry
Figure 8. Six-Year Outcomes by Age at First Entry (N=2,373,802)
NOTE: Student with gender data missing were excluded from the above figure. This figure is based on data shown in Appendix C, Table 9.
Figure 9. Completion at Starting vs. Different Institution By Age at First Entry
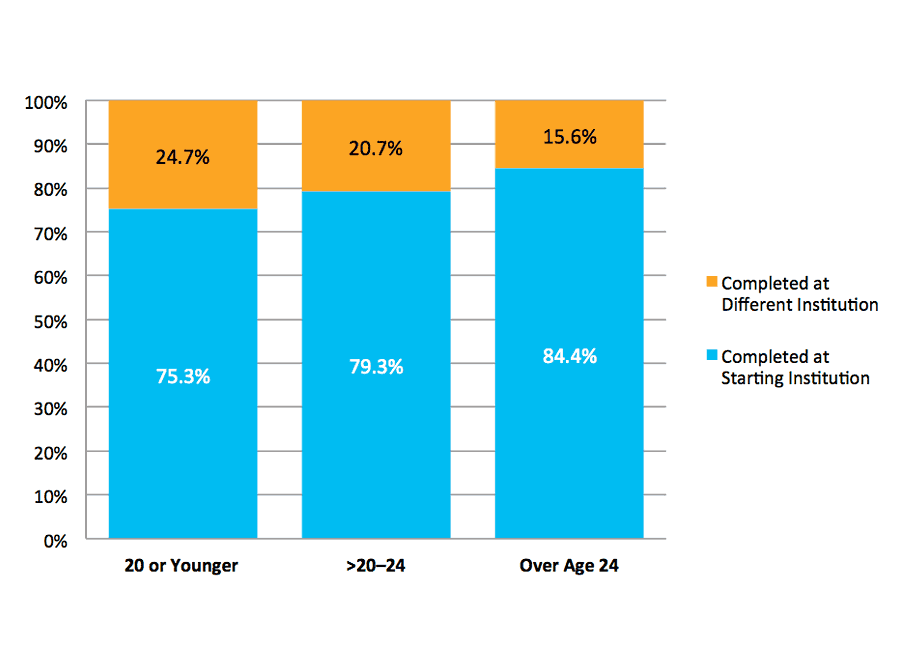
NOTE: Student with gender data missing were excluded from the above figure. This figure is based on data shown in Appendix C, Table 9.
Figures 8 and 9 further explore differences in completion and persistence patterns by considering results by students’ age at first entry.3 Students were divided into three age groups consisting of (1) those who were age 20 or younger at first entry, (2) those who were over age 20 through age 24 at first entry, and (3) those who were over age 24 at first entry. Among students 20 or younger, 45.0 percent completed first at their starting institution and an additional 14.7 percent completed their first degree or certificate at a different institution, for a total completion rate of 59.8 percent. An additional 15.9 percent had no postsecondary credential but were still enrolled at the end of the study period, leaving the percentage of stop-outs at 24.3 percent.
Students over age 24 at first entry showed a total completion rate of 43.5 percent, with 36.7 percent completing first at their starting institution and only 6.8 percent completing first at a different institution. An additional 12.5 percent were still enrolled at the end of the study period. Looking across the age groups, a notable difference lies in the greater proportion of the older groups (42.8 and 43.9 percent) who had stopped out by the end of the study, compared with 24.3 percent of the youngest group who were no longer enrolled.
An additional difference worth noting is the higher portion of first completions elsewhere shown among students age 20 or younger at first entry. First completions outside students’ starting institution occurred at twice the rate in the youngest group of starters (14.7 percent) compared to the oldest group (6.8 percent). Figure 9 further explores this pattern, showing the proportions of completers, as opposed to the proportion of starters, who finished at their starting institution and at a different institution. Nearly one in four (24.7 percent) of those who completed a degree in the youngest age group did so somewhere other than at their starting institution, compared to 15.6 percent of completers in the oldest group.
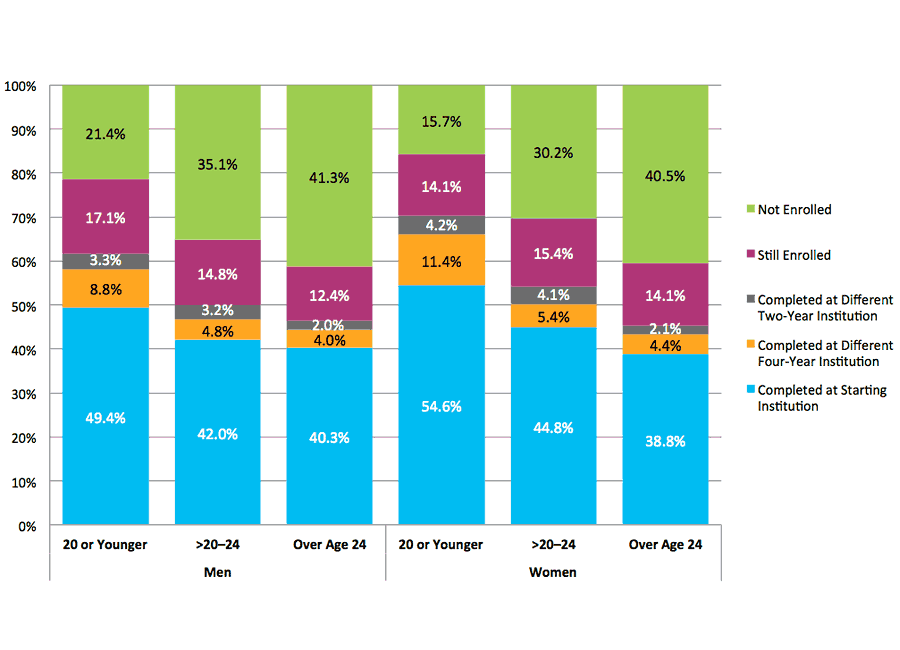
Figure 10. Six-Year Outcomes by Age at First Entry and Gender (N=2,194,795)
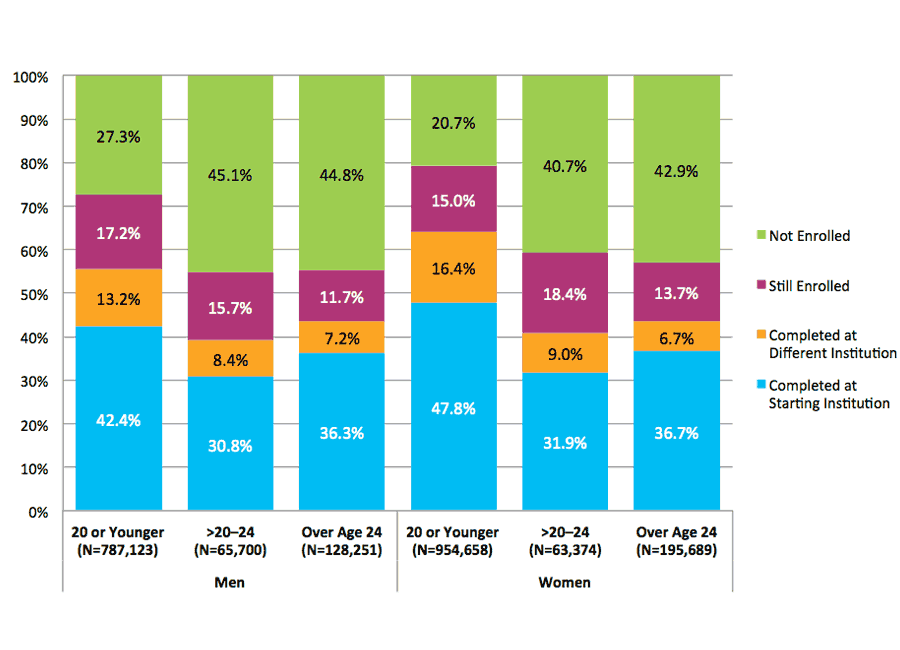
NOTE: Student with date of birth data and/or gender data missing were excluded from the above figure. This figure is based on data shown in Appendix C, Table 10.
Figure 10 shows six-year outcomes for the fall 2007 cohort, disaggregated by age at first entry and by gender. The completion patterns among the age groups discussed earlier in this section remain consistent for both men and women separately. The higher completion rates for women overall, however, appears to be attributable almost entirely to students in the traditional-age group, where completion rates for women (64.2 percent) were much higher than for men (55.6 percent). The gender difference almost disappears in the over 20 to 24 age group, and it disappears completely for students over age 24, where women are slightly more likely than men to complete at their starting institution, but less likely than men to complete elsewhere, leaving the two genders with virtually identical overall completion rates among older students.
3All tables and figures considering age exclude a small number of students (less than one percent of the cohort) whose birthdate was missing.
Six-Year Outcomes by Age at First Entry and Enrollment Intensity
Figure 11. Six-Year Outcomes by Age at First Entry and Enrollment Intensity
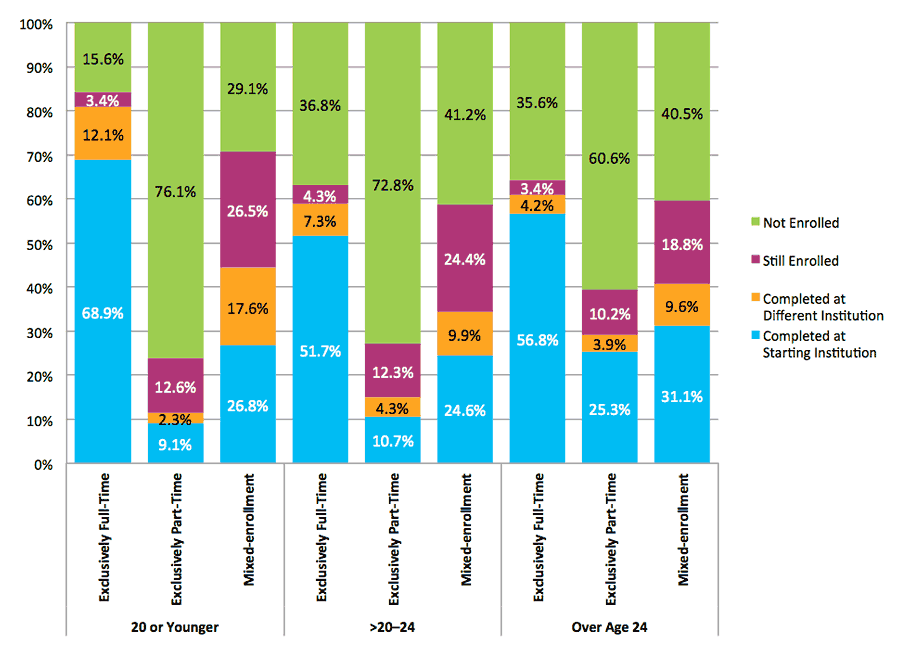
NOTE: Student with date of birth data missing were excluded from the above figure. This figure is based on data shown in Appendix C, Table 11.
Differences in outcomes between the age groups may be related to different patterns of enrollment intensity among older and younger students. To gain further insight to this we disaggregate results in this section by enrollment intensity within each age group.
Figure 11 shows students’ six-year outcomes based on age at first entry and enrollment intensity. Not surprisingly, completion rates were the highest for full-time students regardless of age at first entry. Among full-time traditional-age students, 68.9 percent completed first at their starting institution and an additional 12.1 percent completed first at a different institution, for a combined completion rate of 81 percent. Full-time students in the adult learner age group showed a lower total completion rate (61 percent), with 56.8 percent completing first at their starting institution and an additional 4.2 percent completing first at a different institution. However, the stop-out rate was highest for students in the delayed entry group (36.8 percent), more than twice the rate of those who enrolled in a postsecondary institution directly after high school (15.6 percent).
Outcomes for exclusively part-time students showed a different pattern. Part-time students age 20 or younger at first entry completed at a lower rate and stopped out at a higher rate than did their adult learner counterparts. Specifically, the completion rate for part-time students in the traditional-age group was 11.4 percent, whereas it was 29.2 for adult learners.
The stop-out rate for those age 20 and younger at first entry was 76.1 percent, much higher than the adult learners’ stop-out rate of 60.6 percent. Among part-time students, six-year outcomes for students over age 20 through age 24 at first entry were similar to those of their younger counterparts, although they had a slightly higher completion rate and a lower stop-out rate.
Across all age groups, mixed enrollment students had the highest rates of completion at an institution other than the starting institution. Traditional-age students in this enrollment category showed the highest percentage completing degrees at an institution other than the starting institution (17.6 percent) followed by those in the older age categories (9.9 and 9.6 percent).
Six-Year Outcomes by Starting Institution Type
Figure 12. Six-Year Outcomes by Starting Institution Type
*This figure is based on data shown in Appendix C, Table 14.
Next we offer an overview of the six-year outcomes by the types of institutions where students started their postsecondary education: four-year public, four-year private nonprofit, four-year private for-profit, two-year public, two-year private nonprofit, and two-year private for-profit institutions (see Figure 12). Overall, the total completion rate, including completions at the starting institution and elsewhere, was the highest for students who started at four-year private nonprofit institutions (72.9 percent). The completion rates were also above 60 percent for students who started at four-year public institutions (63.4 percent) and for the small number of students who began at two-year private for-profits (62.4 percent). About forty percent of students who started at two-year public institutions obtained a credential within six years (39.9 percent).
Most first completions occurred at students’ starting institution, with the highest rate of completion at starting institutions observed for students who started at four-year private nonprofit institutions (59.0 percent). More noteworthy, however, is the finding that more than one in eight students who started at public and private nonprofit institutions completed at an institution different from where they started. Specifically, 12.9 percent of those who started at four-year public, 13.8 percent of those who started at four-year private nonprofit, and 13.4 percent of those who started at two-year public institutions completed first at an institution other than their starting institution. (Although very small in number, 16.5 percent of those who started at two-year private nonprofit institutions did the same.) For the most part, students who completed their first degrees or certificates somewhere other than their starting institution did so at a new four-year institution in greater proportions than at a new two-year institution. Taken together, these results show that capturing students’ completions beyond their starting institution increases the total completion rates observed nationally.
Different stop-out patterns were found between students who started at four-year institutions and those who started at two-year institutions. Among students who started at four-year institutions, those who started at private for-profit institutions had the highest stop-out rate, with 44 percent having no degree or certificate and no continuing enrollment in the sixth year. In contrast, those who started at private nonprofit institutions stopped out at the lowest rate, at only 17.5 percent. Forty-one percent of students who started at two-year public institutions had stopped out without a completion or enrollment at the end of the six-year study period.
Figure 13. Completion at Starting vs. Different Institution by Starting Institution Type
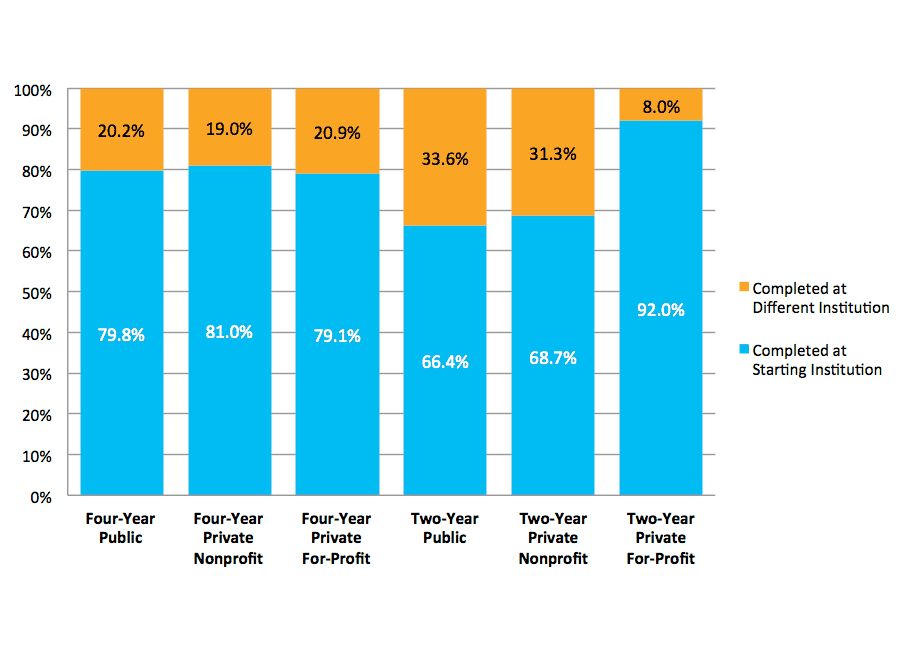
*This figure is based on data shown in Appendix C, Table 14.
Figure 13 compares the proportions of completers who completed at their starting institution and those who, based on their first completion records, completed at a different institution, by starting institution type. Students who started at two-year public institutions showed the highest proportion of first completions taking place at an institution other than their starting institution (33.6 percent). The proportions of first completions at different institutions were similar for students who started at a four-year public institution, a four-year private nonprofit institution, and a four-year private for-profit institution (20.2 percent, 19.0 percent, and 20.9 percent, respectively).
Students Who Started At Four-Year Public Institutions
Figures 14 through 18 reveal six-year outcomes for students who started at four-year public institutions, broken out by enrollment intensity (Figure 14), by gender (Figure 15), by age group at first entry (Figure 16), by gender and age (Figure 17), and by age group and enrollment intensity (Figure 18).
Figure 14. Six-Year Outcomes for Students Who Started at Four-Year Public Institutions by Enrollment Intensity (N=1,002,788)
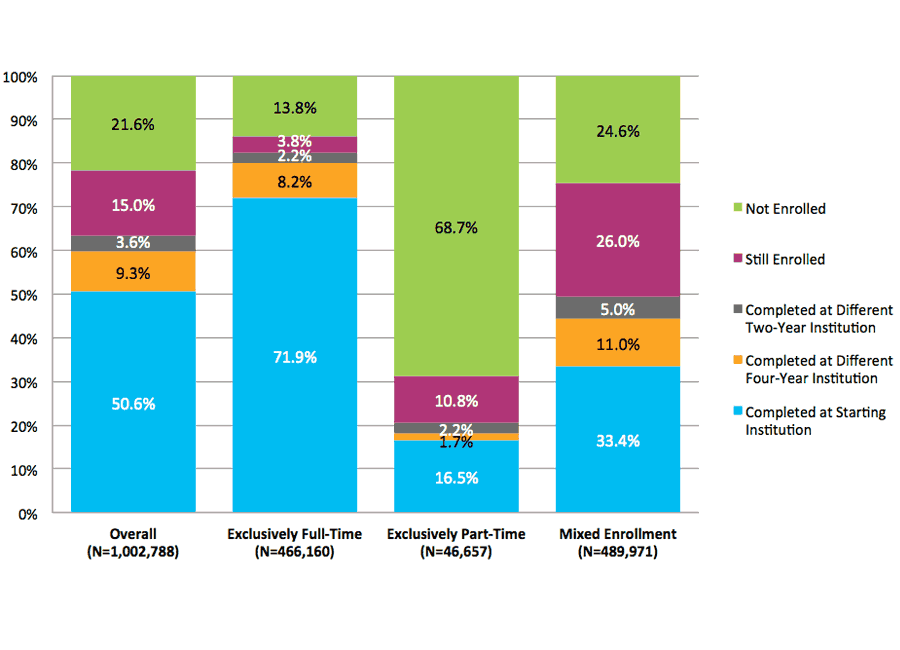
*This figure is based on data shown in Appendix C, Table 15.
As shown in Figure 14, overall, for students who started at four-year public institutions, 63.4 percent completed their first degree or certificate within six years, with 50.6 percent completing first at their starting institution and an additional 12.8 percent completing first at a different institution. Additionally, 15.0 percent of students were still enrolled after six years from their initial enrollment. About one in five students (21.6 percent) were no longer enrolled at the end of the study period.
Among exclusively full-time students, 82.4 percent completed their first degree or certificate within six years, with 71.9 percent of them completing at the starting institution and 10.5 percent completing at a different institution (rates of first completion at a different four-year and two-year institution were 8.2 percent and 2.3 percent, respectively). Both the persistence rate and the stop-out rate were the lowest for full-time students compared to part-time or mixed enrollment students.
Among exclusively part-time students, 20.5 percent completed their first degree or certificate during the study period, with 4 percent completing at an institution different from their starting institution, and 10.8 remained enrolled (with no completion) during the last year of the study period.
Mixed enrollment students had the highest rate of persistence (26.0 percent), reflecting the logical observation that students following this enrollment pattern may take a longer time than exclusively full-time students to complete and, furthermore, that they may progress more steadily toward completion than their exclusively part-time counterparts.
Among mixed enrollment students, 49.4 percent completed a credential within six years. Mixed enrollment students showed a relatively higher rate of first completion at a different institution (16.0 percent) meaning that among mixed enrollment students with a postsecondary credential, about one-third completed first at a different institution, with 11.0 percent completing first at a different four-year institution and 5.0 percent at a different two-year institution.
Figure 15. Six-Year Outcomes for Students Who Started at Four-Year Public Institutions by Gender (N=925,438)
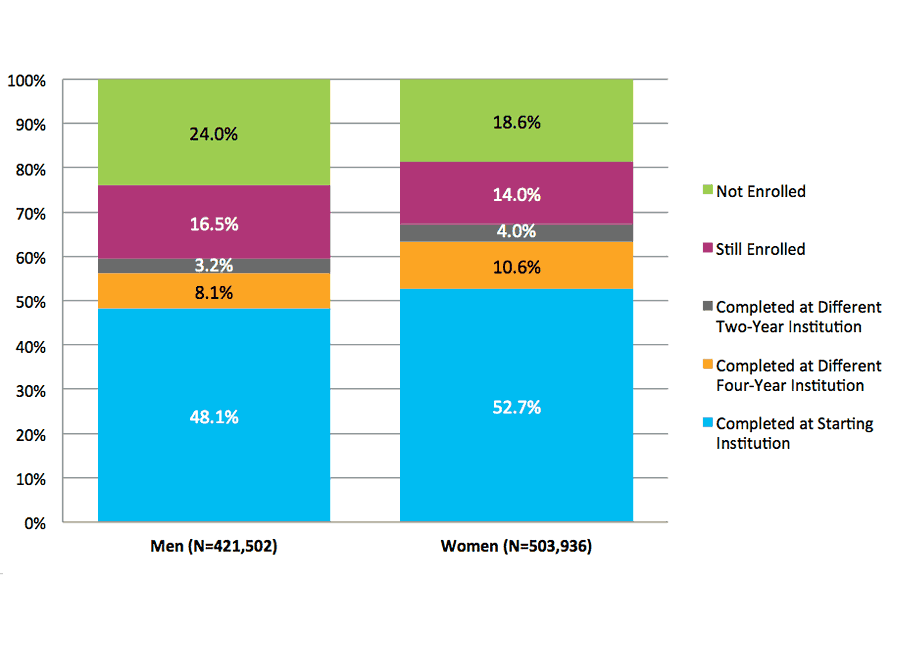
NOTE: Student with gender data missing were excluded from the above figure. This figure is based on data shown in Appendix C, Table 16.
Figure 15 shows six-year outcomes for those students who started at four-year public institutions by gender. Consistent with patterns for the overall cohort, these results show higher completion rates among women as compared to men (67.3 and 59.4 percent, respectively). While a slightly lower percentage of women (14 percent) compared to men (16.5 percent) were still enrolled at the end of the study period, the stop-out rate was still higher among men than women.
Figure 16. Six-Year Outcomes for Students Who Started at Four-Year Public Institutions by Age at First Entry (N=997,543)
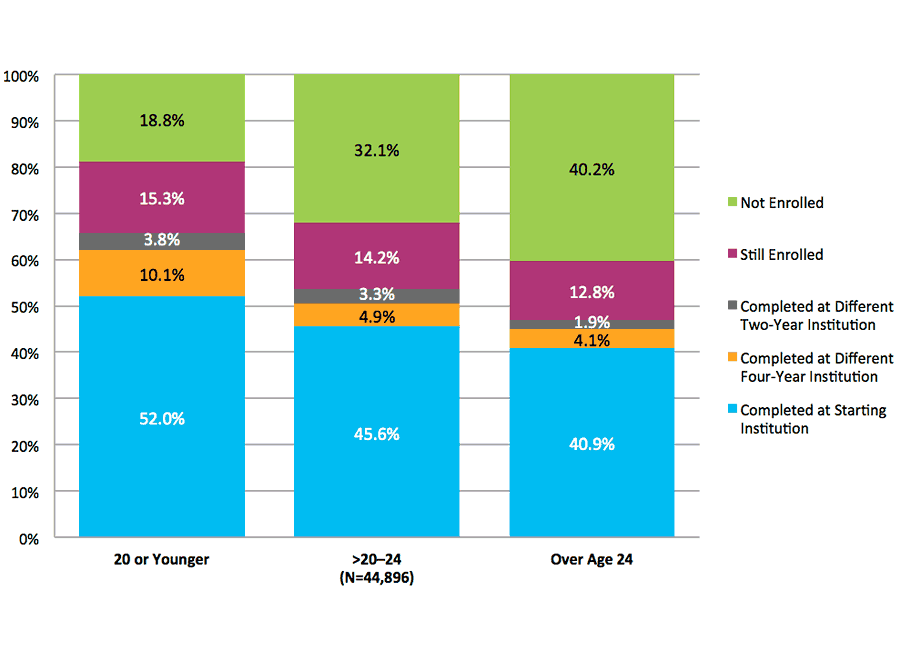
NOTE: Student with date of birth data missing were excluded from the above figure. This figure is based on data shown in Appendix C, Table 17.
Figure 16 displays six-year outcomes for students who started at four-year public institutions by age group. Students age 20 or younger showed a higher completion rate as compared to students over age 20 through age 24 and those older than 24 at first entry (65.9 percent versus 53.8 percent and 46.9 percent, respectively). The traditional-age group also had a higher completion rate at an institution different from their starting institution (13.9 percent versus 8.2 percent and 6.0 percent).
Figure 17. Six-Year Outcomes for Students Who Started at Four-Year Public Institutions by Gender and Age at First Entry (N=921,145)
NOTE: Student with date of birth and/or gender data missing were excluded from the above figure. This figure is based on data shown in Appendix C, Table 18.
Figure 17 shows six-year outcomes for students who started at four-year public institutions, disaggregated by age at first entry and gender. Differences among age groups discussed earlier in this section were less pronounced among men than women, when examined separately. Traditional-age women who started at four-year public institutions completed degrees and certificates at a rate of 70.2 percent, which was 25 percentage points higher than the completion rate for women over age 24 at first entry. Among men, while differences in completion rates of traditional-age students and adult learners were observed, the gap was narrower at 15 percentage points. Figure 15 showed that overall female students had a higher completion rate than male students (67.3 and 59.4 percent, respectively). A different pattern emerged when we examined completion rates by gender for each of the age groups. Traditional-age female students had a much higher completion rate than their male peers in the same age group (70.2 and 61.5 percent, respectively). Among students over age 20 through age 24, female students also had a higher completion rate than male students, though the gap was narrower (54.3 and 50.0 percent, respectively). Among adult learners, however, men had a slightly higher completion rate than women (46.3 percent and 45.3 percent, respectively).
Figure 18. Six-Year Outcomes for Students Who Started at Four-Year Public Institutions by Age at First Entry and Enrollment Intensity (N=997,543)
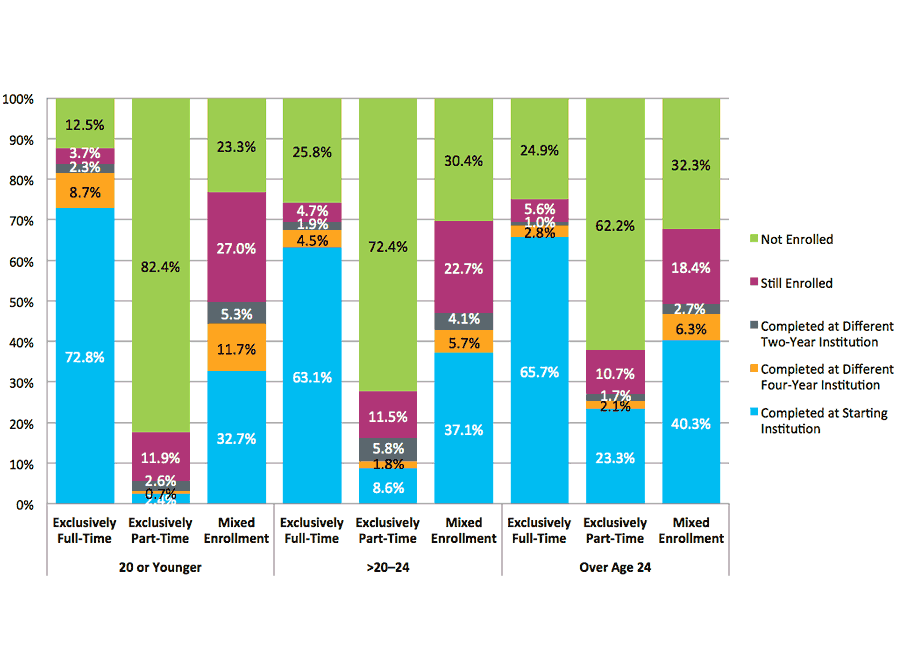
NOTE: Student with date of birth data missing were excluded from the above figure. This figure is based on data shown in Appendix C, Table 19.
Figure 18 displays six-year outcomes for students who started at four-year public institutions by enrollment intensity within each age group.
Overall, for students who started at four-year public institutions, the patterns of first completion by enrollment intensity for all three age groups were similar. Within each age group, full-time students had the highest proportion of students completing first at their starting institution compared to part-time and mixed enrollment students, while mixed enrollment students had the highest proportion completing first at a different institution.
Exclusively full-time students over age 20 through 24 at first entry and over age 24 had the same completion rate (69.5 percent), which was lower than that for traditional-age students enrolled exclusively full time (83.7 percent). On the other hand, exclusively part-time students over age 24 had the highest completion rate (27.1 percent) followed by part-time students over age 20 through 24 at first entry (16.1 percent). Traditional-age students enrolled exclusively part time had the lowest completion rate at 5.7 percent. Mixed enrollment students had similar completion rates across all three age groups with about half of the students in each group graduating within six years.
Students Who Started at Two-Year Public Institutions
We next focus on the college outcomes of degree-seeking students who started at two-year public institutions4. In each subsection of results (broken out by enrollment intensity, gender, age at first entry, gender and age, and enrollment intensity within each age group), we first present six-year outcomes of these students, focusing primarily on their first instance of completion. Following this, we explore the two-year entering cohort’s rate of total completions at four-year institutions, both with and without first attaining a credential from the two-year sector.
4Notably, results for non-degree students who started at two-year public institutions showed completions as well. These students are not the focus of this report, but results are included for further reference in Tables 29-35 in Appendix C.
Figure 19. Six-Year Outcomes and First Completion for Students Starting at Two-Year Public Institutions by Enrollment Intensity (N=857,607)
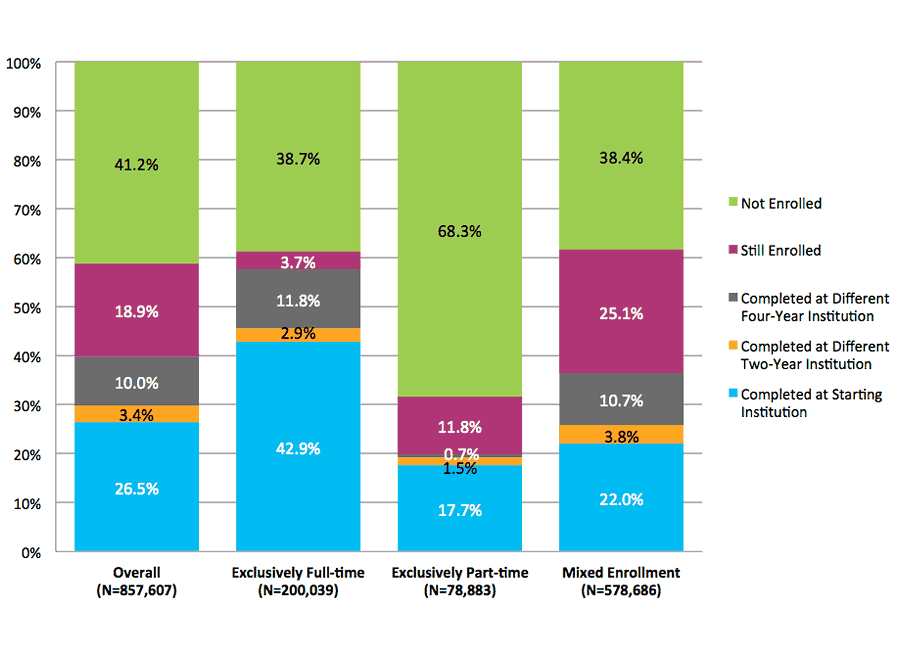
*This figure is based on data shown in Appendix C, Table 22.
In Figure 19, we present six-year outcomes and first completions of students who started at two-year public colleges, by enrollment intensity.
Among all students who started at a two-year public institution, 39.9 percent received a degree or certificate within six years, with 26.5 percent completing first at their starting institution, 3.4 percent at a different two-year institution, and 10.0 percent at a different four-year institution.
More than half of the exclusively full-time students (57.6 percent) completed within six years. Among this group, 42.9 percent completed first at their starting institution, with an additional 2.9 percent completing first at a different two-year institution and 11.8 percent completing first at a four-year institution. Exclusively part-time students had a low six-year completion rate (19.9 percent). Of all part-time students, 17.7 percent completed first at their starting institution, while only 1.5 percent and 0.7 percent completed first at a different two-year institution and at a four-year institution, respectively. As noted above, low six-year completion rates for students who enrolled exclusively part-time are unsurprising and suggest the importance of following these students for longer periods.
Among students with mixed enrollment, 22.0 percent completed first at their starting institution, with an additional 3.8 percent and 10.7 percent completing first at a different two-year institution and a different four-year institution, respectively. Completers with mixed enrollment intensity completed first at institutions different from their starting institution at a rate nearly as high (14.5 percent) as that for exclusively full-time students (14.7 percent).
Figure 20. Completion at Four-Year Public Institutions for Students Who Started at Two-Year Public Institutions by Enrollment Intensity (N=857,607)
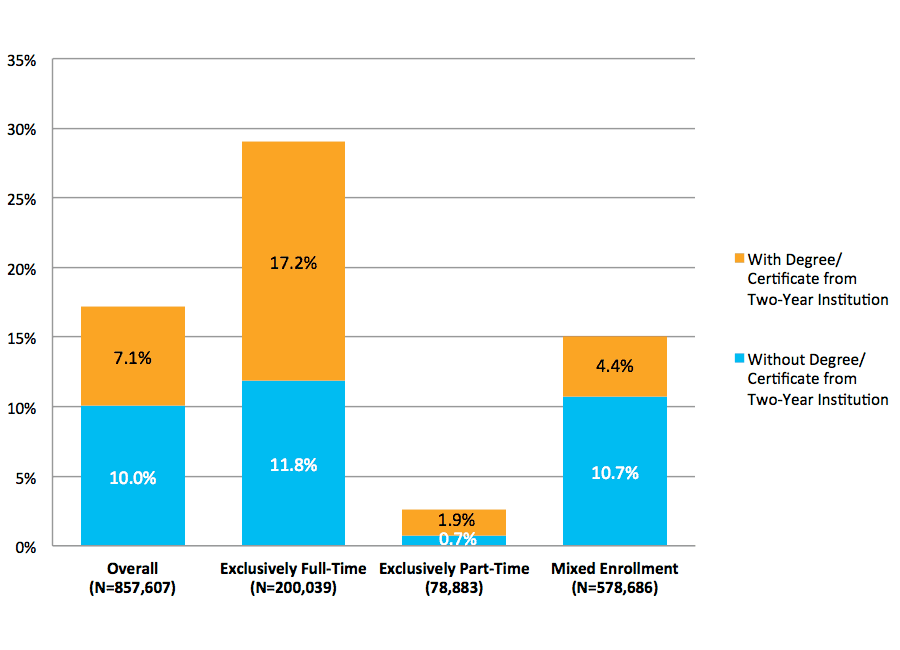
*This figure is based on data shown in Appendix C, Table 22.
With a particular interest in four-year completion among students who started at two-year public institutions, we focus next on percentages of students who completed at a four-year institution, both with and without first obtaining a credential from a two-year institution. Figure 20 shows patterns of completion at four-year institutions for students who started at two-year public institutions, exploring how these completion rates differed by students’ enrollment intensity.
Overall, a total of 17.1 percent of students who started at two-year public institutions completed at a four-year institution within six years, with 7.1 percent of them having previously received a credential from a two-year institution.
With a total rate of completions at four-year institutions at 29.0 percent, exclusively full-time students showed the highest proportion of completions at four-year institutions, either with or without a credential from a two-year institution, compared to exclusively part-time and mixed enrollment students.
Exclusively part-time students showed a very low rate of completion at a four-year institution (2.6 percent), with only 0.7 percent receiving their first postsecondary credential from a four-year institution and 1.9 percent earning a degree or certificate at a four-year institution after receiving a credential from a two-year institution. This is an expected outcome given that the study period was too short for exclusively part-time students who started at two-year institutions to earn a degree from a four-year institution.
Among students with mixed enrollment, 10.7 percent obtained their first postsecondary credential at a four-year institution, while 4.4 percent completed at a four-year institution after receiving a degree or certificate from a two-year institution.
Figure 21. Six-Year Outcomes and First Completion for Students Who Started at Two-Year Public Institutions by Gender (N=790,662)
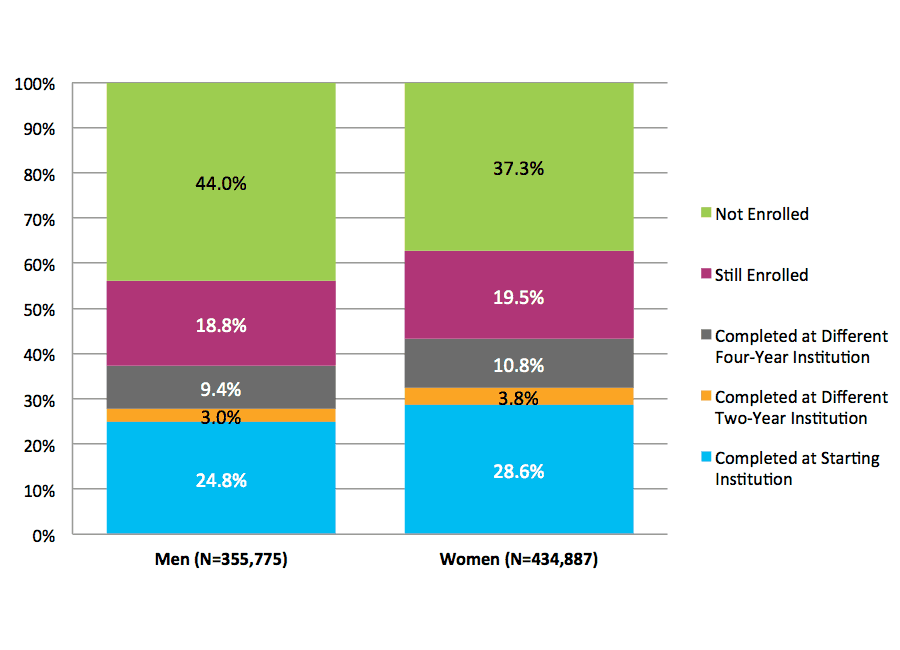
NOTE: Student with date of birth data missing were excluded from the above figure. This figure is based on data shown in Appendix C, Table 23.
Figure 21 shows six-year outcomes for the 2007 fall cohort of students who first enrolled in two-year public institutions by gender. The results are similar to those for the full cohort in the sense that women showed a higher completion rate than men (43.2 and 37.2 percent, respectively). In contrast with persistence patterns shown for the full cohort, however, a slightly higher percentage of women (19.5 percent) compared to men (18.8 percent) were still enrolled at the end of the study period.
Figure 22. Six-Year Outcomes and First Completion for Students Who Started at Two-Year Public Institutions by Age at First Entry (N=851,583)
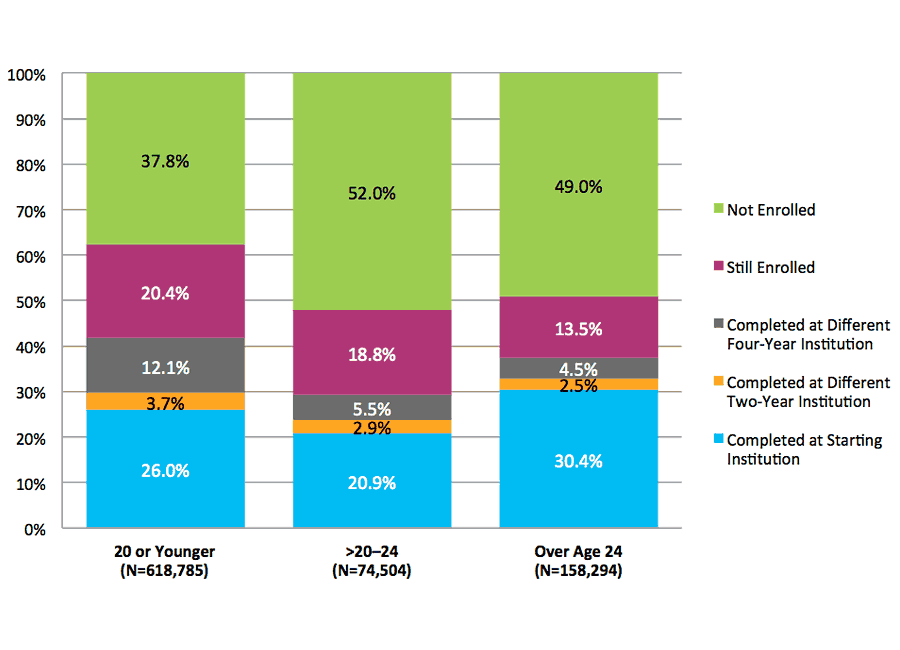
NOTE: Student with date of birth data missing were excluded from the above figure. This figure is based on data shown in Appendix C, Table 24.
Similar to Figures 19 and 20, Figures 22 and 23 show the six-year outcomes of students who started at two-year public institutions, including their completions by age at first entry.
The overall completion rates for students age 20 or younger and those over age 24 at first entry were similar (41.8 and 37.5 percent, respectively), with students in the adult learner group having a higher completion rate at their starting institution than students in the traditional-age group (30.4 and 26.0 percent, respectively). In comparison with students in two other age groups, traditional-age students had a higher rate of first completion at a four-year institution (12.1 versus 5.5 percent and 4.5 percent, respectively). Notably, students who were over age 20 through age 24 had the lowest completion rate at their starting institution.
Figure 23. Completion at Four-Year Institutions Among Students Who Started at Two-Year Public Institutions by Age at First Entry (N=851,583)
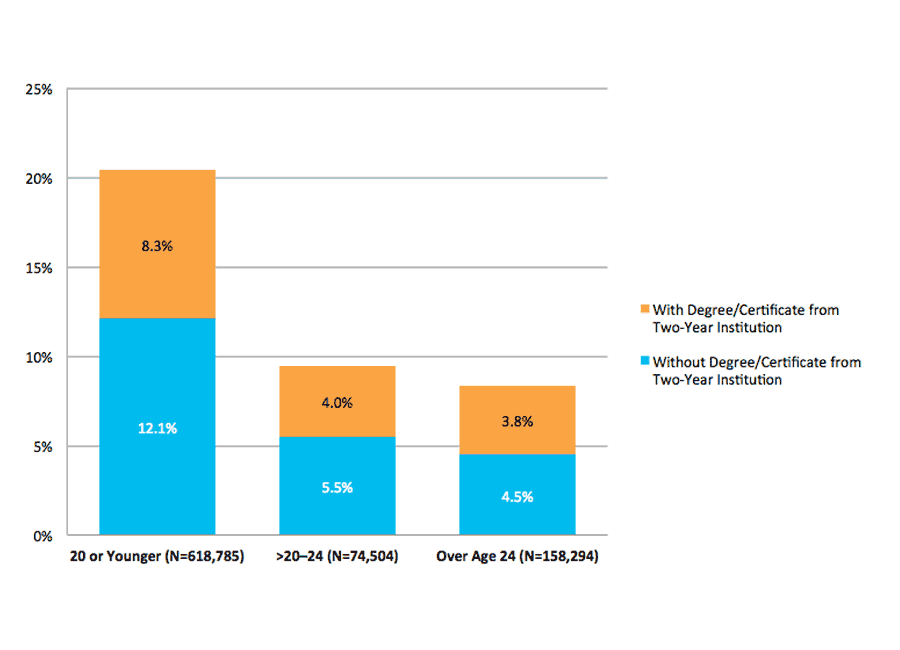
NOTE: Student with date of birth data missing were excluded from the above figure. This figure is based on data shown in Appendix C, Table 24.
Figure 23 presents patterns of completion at four-year institutions, with and without a postsecondary credential from a two-year institution, among students who started in two-year public institutions, disaggregating results by age at first entry.
Among students age 20 or younger at first entry, 12.1 percent completed at a four-year institution without previously receiving a certificate or degree from a two-year institution, and 8.3 percent completed at a four-year degree, having first completed a credential from a two-year institution.
Among students who were over 24 at first entry, 4.5 percent earned their first postsecondary credential at a four-year institution and 3.8 percent did so with a credential from a two-year institution.
Compared to the students who were over age 20 through age 24 at first entry and students over age 24 , the traditional-age group had a markedly higher proportion of students completing at a four-year institution either with or without a degree or a certificate from a two-year institution.
Figure 24. Six-Year Outcomes and First Completion for Students Who Started at Two-Year Public Institutions by Gender and Age at First Entry (N=785,609)
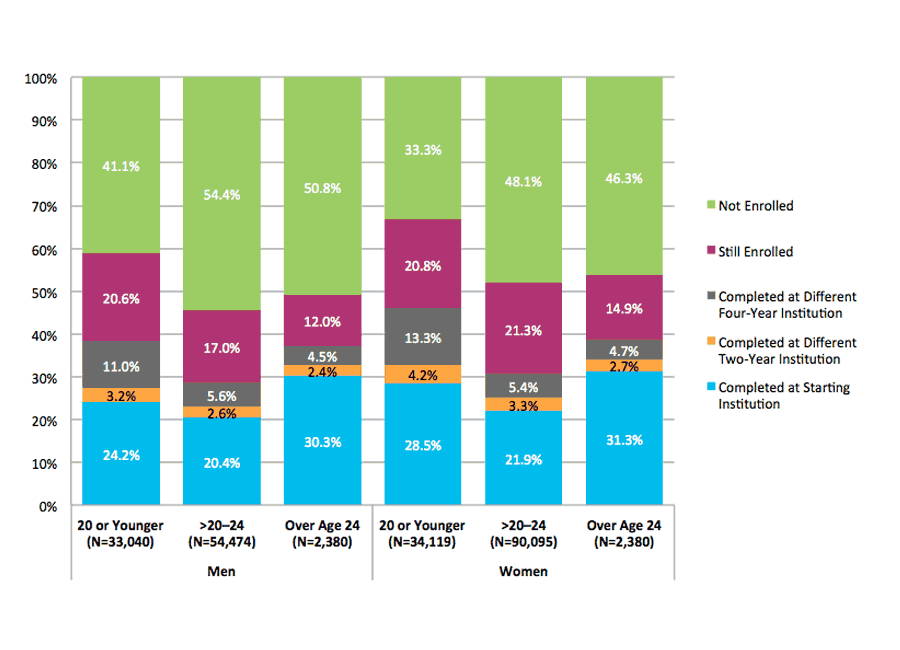
NOTE: Student with date of birth and/or gender data missing were excluded from the above figure. This figure is based on data shown in Appendix C, Table 25.
Figure 24 shows six-year outcomes for students who started at two-year public institutions, disaggregated by age at first entry to college and gender. Patterns among age groups discussed earlier in this section remain consistent, although less pronounced, when results for men and women are considered separately. As shown in the overall cohort results discussed above, differences between men’s and women’s completion rates were mainly concentrated among students who were age 20 or younger when they first enrolled. Traditional-age women who started at two-year public institutions completed degrees and certificates at a rate of 46.0 percent, while 38.4 percent of their male peers of the same age group completed a degree or certificate within six years. Across all age groups men had a higher stop-out rate than women with the largest difference being among traditional-age students (41.1. percent for men and 33.3 percent for women).
Figure 25. Six-Year Outcomes and First Completion for Students Who Started at Two-Year Public Institutions by Age at First Entry and Enrollment Intensity (N=851,583)
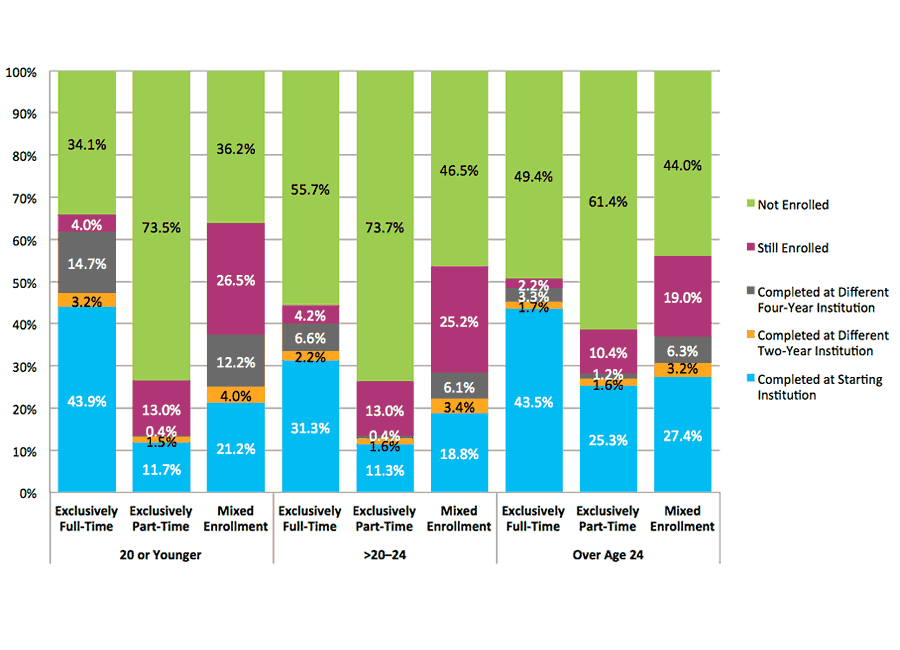
NOTE: Student with date of birth data missing were excluded from the above figure. This figure is based on data shown in Appendix C, Table 26.
Figure 25 presents six-year outcomes and first completions for students who started at two-year public institutions by age at first entry and enrollment intensity.
Overall, a larger proportion of students over age 24 compared to students age 20 or younger at first entry completed first at their starting institution. This pattern held regardless of students’ enrollment intensity, except that traditional-age students attending full-time completed at their starting institution at a slightly higher rate (43.9 percent) than full-time adult learners did (43.5 percent). Conversely, compared to the two older age groups, a larger proportion of traditional-age students completed first at a four-year institution. Among full-time enrollees, the overall completion rate was highest for students in the traditional-age group (61.9 percent) than it was for students over age 20 through age 24 at first entry (40.1 percent), or adult learners (48.4 percent). The adult learner part-time students, on the other hand, had a much higher completion rate (15 percentage points higher) than their younger part-time counterparts.
Figure 26. Completion at Four-Year Institutions Among Students Who Started at Two-Year Public Institutions by Age at First Entry and Enrollment Intensity (N=851,583)
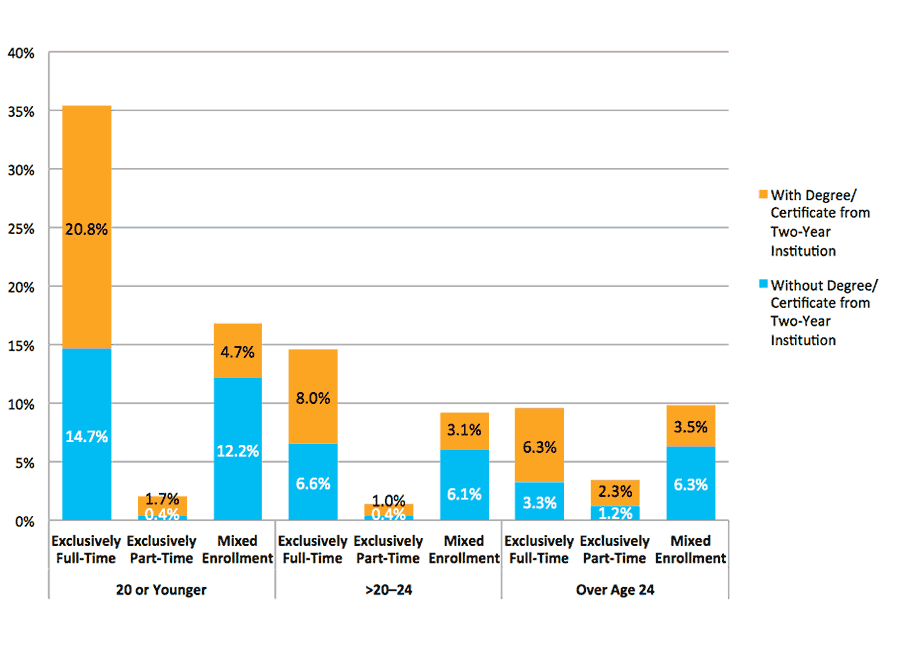
NOTE: Student with date of birth data missing were excluded from the above figure. This figure is based on data shown in Appendix C, Table 26.
Figure 26 displays completions at four-year institutions among students who started at two-year public institutions by enrollment intensity and age at first entry.
A larger proportion of traditional age students who enrolled exclusively full time or who had mixed enrollment completed a degree or certificate at a four-year institution than the delayed entry and adult learner students.
Among students entering college immediately after high school, 14.7 percent of full-time students earned their first postsecondary credential at a four-year institution, and 20.8 percent of full-time students did so after receiving a degree or a certificate from a two-year institution, achieving in total a 35.5 percent completion rate at four-year institutions. Among full-time students in the delayed entry group (over age 20 through age 24 at first entry), the overall four-year completion rate was 14.6 percent, with 6.6 percent completing at a four-year institution without previously receiving a credential from a two-year institution and 8.0 percent completing at a four-year institution with a degree or a certificate from a two-year institution.
Among students in the adult learners group, 3.3 percent of full-time students earned their first postsecondary credential at a four-year institution, and 6.3 percent of full-time students did so after completing a degree or a certificate from a two-year institution, achieving in total a 9.6 percent baccalaureate completion rate at four-year institutions. Mixed enrollment students in the 20 and younger group also showed a higher completion rate at four-year institutions (16.9 percent) than their mixed enrollment counterparts in the delayed entry and adult learner groups (9.2 and 9.8 percent, respectively).
While exclusively part-time students in all age groups had low rates of completion at a four-year institution, completion at a four-year institution was higher in the adult learner group than in the immediate entry and delayed entry groups of exclusively part-time students.
Students Who Started at Four-Year Private Nonprofit Institutions
Figure 27. Six-Year Outcomes for Students Who Started at Four-Year Private Nonprofit Institutions by Enrollment Intensity (N=446,378)
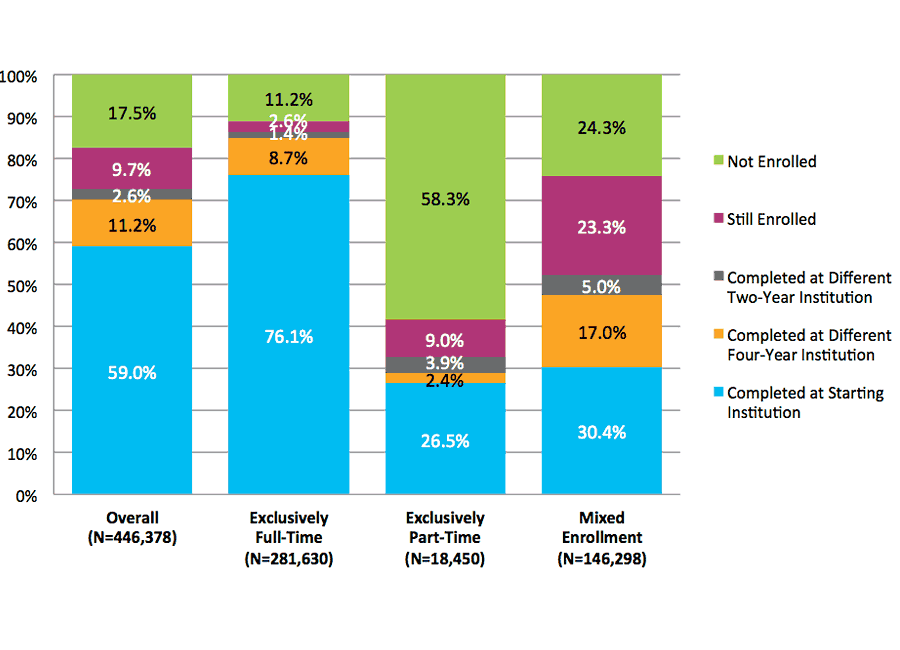
*This figure is based on data shown in Appendix C, Table 36.
With a specific focus on students who started at four-year private nonprofit institutions, Figure 27 shows these students’ six-year outcomes by enrollment intensity. As mentioned earlier, students who started at four-year private nonprofit institutions had the highest total completion rate (including completions at the starting institution and elsewhere, 72.9 percent).
First completions at a different institution increased the total completion rate for students who started at four-year private nonprofit institutions, irrespective of enrollment intensity. This gain was especially notable for mixed enrollment students: first completions at a different institution increased the total completion rate for this group by 22.0 percentage points. Only a small proportion of students completed first at a two-year institution. A higher proportion of mixed enrollment students (5.0 percent) completed first at a two-year institution, compared to exclusively full-time (1.4 percent) and exclusively part-time (3.9 percent) students.
Figure 28. Six-Year Outcomes for Students Who Started at Four-Year Private Nonprofit Institutions by Gender (N=414,073)
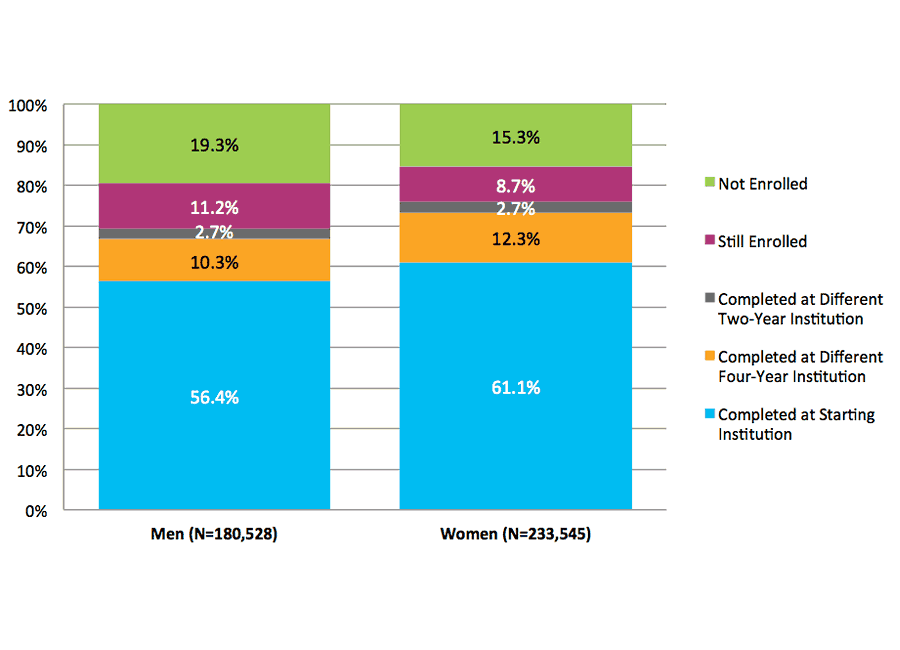
NOTE: Student with gender data missing were excluded from the above figure. This figure is based on data shown in Appendix C, Table 37.
Figure 28 shows six-year outcomes for the 2007 fall cohort of students who first enrolled in four-year private nonprofit institutions by gender. The results show a higher completion rate for women as compared to men (76.1 and 69.4 percent, respectively). Notably, a slightly lower percentage of women (8.7 percent) compared to men (11.2 percent) were still enrolled at the end of the study period.
Figure 29. Six-Year Outcomes for Students Who Started at Four-Year Private Nonprofit Institutions by Age at First Entry (N=445,264)
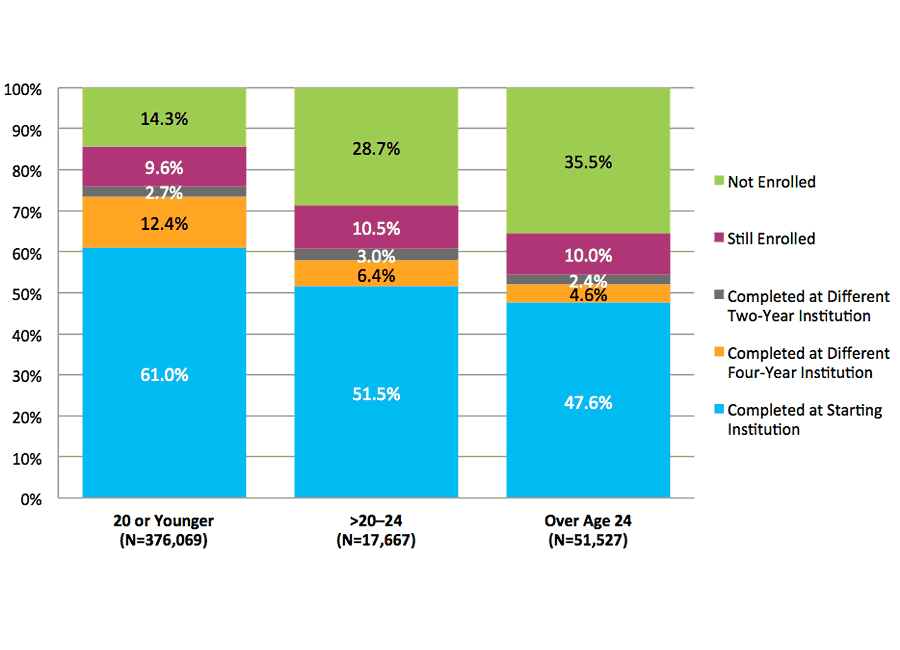
NOTE: Student with date of birth data missing were excluded from the above figure. This figure is based on data shown in Appendix C, Table 38.
Figure 29 presents six-year college outcomes by age at first entry for students who started at four-year private nonprofit institutions. Among students who started at four-year private nonprofit institutions, students age 20 or younger at first entry had a higher overall completion rate (76.1 percent) than students who were older than 24 at first entry (54.5 percent). The youngest group also had higher rates of first completion both at their starting institution (61.0 percent) and at a different four-year institution (15.0 percent) than the adult learner group (47.6 percent and 6.9 percent, respectively). While similar percentages of students were still enrolled by the end of the study period in both the traditional-age and adult learner groups (9.6 percent and 10.0 percent, respectively), 35.5 percent of students in the latter group stopped out by the end of the study period, more than twice the rate of the traditional-age students (14.3 percent).
Among students over age 20 through age 24 who started at four-year private nonprofit institutions, the completion rate (60.9 percent) was over 6 percentage points higher than that of the adult learner group (54.5 percent). Students over age 20 through age 24 at first entry completed at a rate that was 15.2 percentage points lower than that of the traditional-age group. Among students who started at four-year private nonprofit institutions, about the same percentage of students in each age group, were still enrolled without completion at the end of the study period (about 10 percent).
Figure 30. Six-Year Outcomes for Students Who Started at Four-Year Private Nonprofit Institutions by Gender and Age at First Entry (N=413,060)
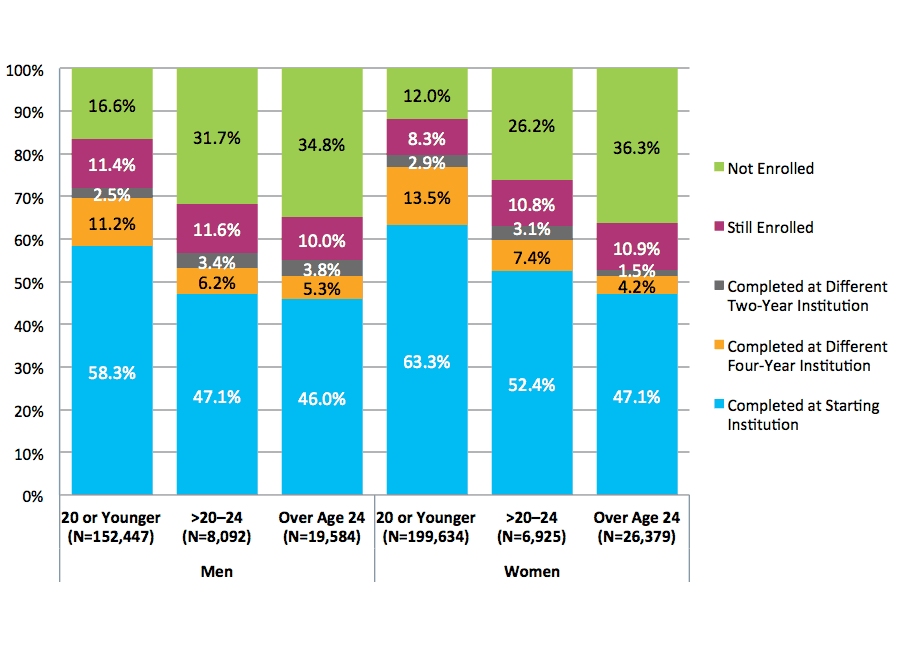
NOTE: Student with date of birth and/or gender data missing were excluded from the above figure. This figure is based on data shown in Appendix C, Table 39.
Figure 30 shows six-year outcomes for students who started at four-year private nonprofit institutions, disaggregated by age group and gender. Differences among age groups discussed earlier in this section remained consistent for both women and men in the sense that the traditional-age students had the highest completion rate in each gender group. However, the gap in the completion rates of students over age 20 through age 24 at first entry and adult learners was much narrower for men than for women. Among male students, adult learners had a completion rate only 1.6 percentage points lower than that of students over age 20 through age 24. In contrast, the completion rate for female adult learners was 10 percentage points lower than that of their female peers in the delayed entry group.
Figure 31. Six-Year Outcomes for Students Who Started at Four-Year Private Nonprofit Institutions by Age at First Entry and Enrollment Intensity (N=445,264)
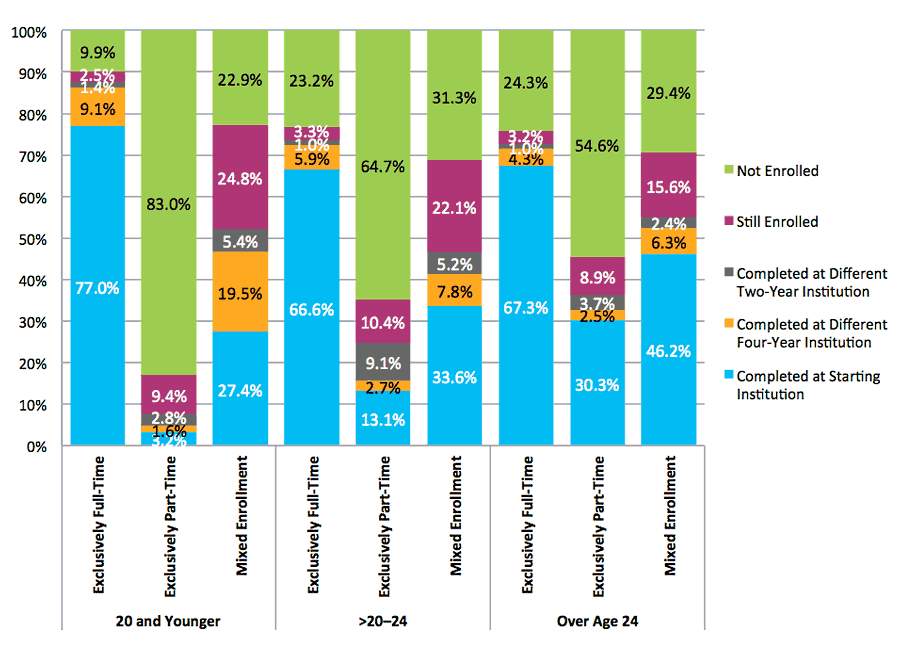
NOTE: Student with date of birth data missing were excluded from the above figure. This figure is based on data shown in Appendix C, Table 40.
Figure 31 further disaggregates the six-year outcomes of four-year private nonprofit starters by enrollment intensity within each age group.
Full-time students age 20 or younger at first entry had a higher overall completion rate compared to full-time students in either of the other age groups (87.5 percent versus 73.5 and 72.5 percent). The rate of first completion at the starting institution was also higher for the youngest full-time students, with 77.0 percent completing at their starting institution and about two thirds of their oldest full-time counterparts doing so. First completions at institutions different from their starting institution were highest among youngest mixed enrollment students, resulting in a gain of 24.9 percentage points for this group.
The comparisons across age groups showed some interesting patterns, particularly among mixed enrollment and part-time students. Specifically, adult learners with mixed enrollment showed a higher rate of first completion at their starting institutions (46.2 percent) than traditional-age students with mixed enrollment (27.4 percent). However, adult learner mixed enrollment students showed a lower rate of first completion at a different institution (8.7 percent) than their traditional-age mixed enrollment counterparts (24.9 percent). However, mixed enrollment students who were over age 24 at first entry also persisted (without completion) at a lower rate (15.6 percent) than their younger mixed enrollment counterparts (24.8 percent for those 20 or younger, and 22.1 percent for those over age 20 through age 24). Finally, the difference in completion rates between the youngest part-time students and the adult learner part-time students was perhaps the most intriguing phenomenon. Only 17.0 percent of exclusively part-time students age 20 or younger at first entry either completed (7.6 percent, as shown in the figure) or were still enrolled (9.4 percent) by the end of the study period. In contrast, fully 45.4 percent of the exclusively part-time students over age 24 at first entry showed similar outcomes: 36.4 percent completed and 9.0 percent were still enrolled at the end of the study period.
These results point to the importance of institutional retention policies and practices that differentiate and target the distinct needs and circumstances of traditional-age students, those who delay enrollment in college two or more years after high school, and adult learners, especially those students in each age group who start as part-time enrollees or shift to part-time enrollment during the course of their college experience.
Students Who Started at Four-Year Private For-Profit Institutions
We next examine the six-year college outcomes for students who started at four-year private for-profit institutions. Similar to the results presented in the previous sections, these results were broken down by enrollment intensity, gender, age group, and the categories combining them.
Figure 32. Six-Year Outcomes for Students Who Started at Four-Year Private For-Profit Institutions by Enrollment Intensity (N=72,922)
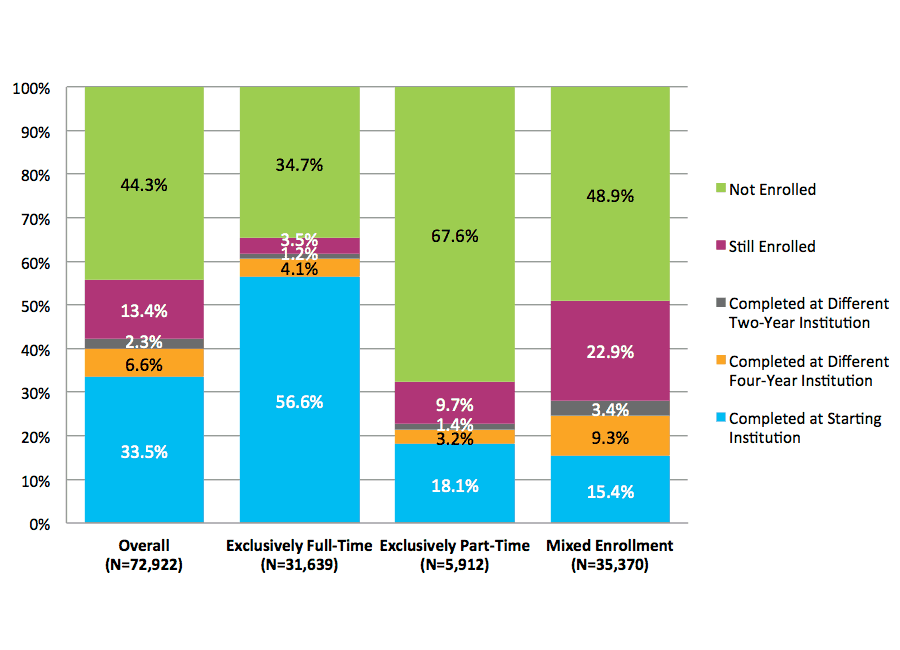
*This figure is based on data shown in Appendix C, Table 43.
As previously shown in Figure 12, Figure 32 shows that students who started at four-year private for-profit institutions had the lowest completion rates — 33.5 percent completing first at the starting institution and 8.9 percent completing first at a different institution — compared to students who started at other four-year institutions. The gain from first completions elsewhere was also smaller for students who started at four-year private for-profit institutions than for students who started at other four-year institutions. Among students who enrolled exclusively full-time, 56.6 percent completed at their starting institution, with only 5.3 percent of additional first completions at a different institution.
Consistent with previous findings, the stop-out risk was the highest for exclusively part-time students (67.6 percent). Moreover, these students had a lower overall completion rate (22.8 percent), but a higher rate of first completion at their starting institution (18.1 percent) compared to mixed enrollment students (28.1 percent overall completion rate including 15.4 percent completion at the starting institution).
Figure 33. Six-Year Outcomes for Students Who Started at Four-Year Private For-Profit Institutions by Gender (N=69,102)
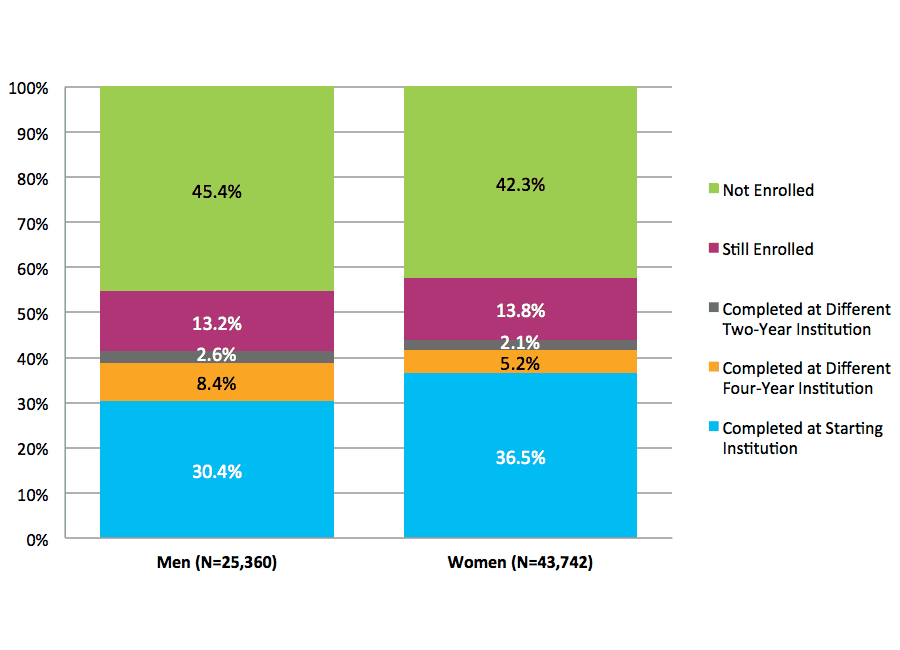
NOTE: Student with gender data missing were excluded from the above figure. This figure is based on data shown in Appendix C, Table 44.
Figure 33 shows six-year outcomes for the 2007 fall cohort students who first enrolled in four-year private for-profit institutions by gender. Consistent with overall results for the cohort, women who started at four-year private for-profit institutions showed slightly higher completion rates than men in this group (43.8 and 41.4 percent, respectively). Notably, similar proportions of both women and men (about one in eight, or 13 percent) were still enrolled at the end of the study period.
Figure 34. Six-Year Outcomes for Students Who Started at Four-Year Private For-Profit Institutions by Age at First Entry (N=72,890)
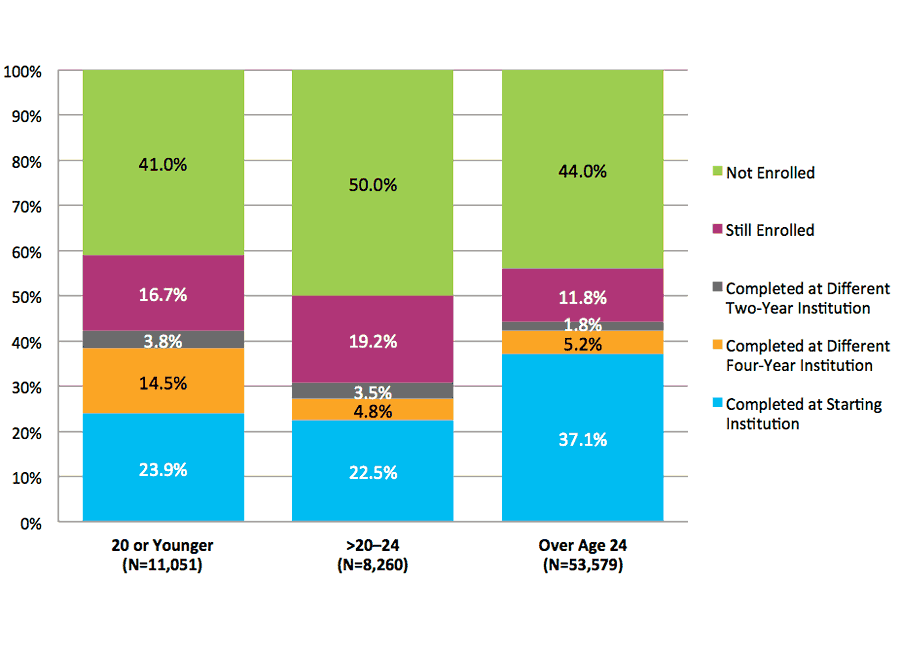
NOTE: Student with date of birth data missing were excluded from the above figure. This figure is based on data shown in Appendix C, Table 45.
Further investigation of six-year outcomes by age group, as shown in Figure 34, reveals patterns among students who started at four-year private for-profit institutions that are very different from those we have observed for other institution types. Adult learners who started at these institutions had a higher completion rate overall and a higher rate of first completion at their starting institution compared to students in the youngest group who started at these institutions. However, the oldest group also exhibited a slightly higher risk of stopping out (44.0 percent) than their youngest counterparts (41.0 percent). It is important to note, that a large majority, almost three-quarters, of four-year private for-profit enrollees were over age 24 at first entry. Thus, findings related to this sector may mainly reflect patterns followed by adult learners.
Figure 35. Six-Year Outcomes for Students Who Started at Four-Year Private For-Profit Institutions by Gender and Age at First Entry (N=69,073)
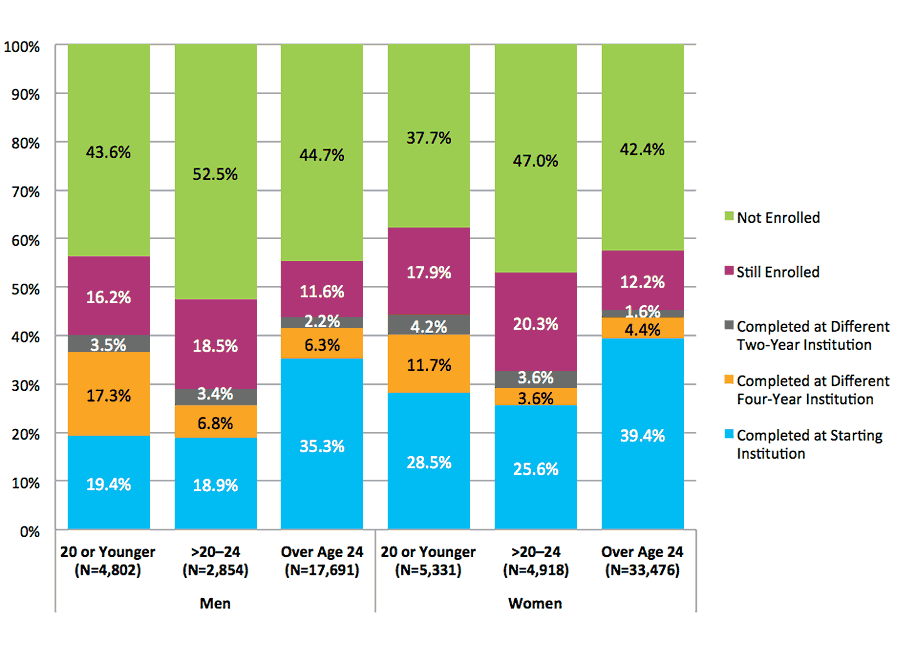
NOTE: Student with date of birth and/or gender data missing were excluded from the above figure. This figure is based on data shown in Appendix C, Table 46.
Figure 35 shows six-year outcomes, disaggregated by age at first entry to college and gender, for students who started in four-year private for-profit institutions in fall 2007. Patterns among age groups discussed earlier in this section remain consistent when results for men and women are considered separately. In each age group gains in completion rates were higher for men than for women. Nevertheless, women in all age groups showed higher completion and persistence rates than their male peers. Among both male and female students, those over age 20 through age 24 had the lowest completion rate (29.1 percent for men and 32.7 percent for women) and the highest stop-out rate (52.5 percent for men and 47.0 percent for women) as compared to other age groups.
Figure 36. Six-Year Outcomes for Students Who Started at Four-Year Private For-Profit Institutions by Age at First Entry and Enrollment Intensity (N=72,890)
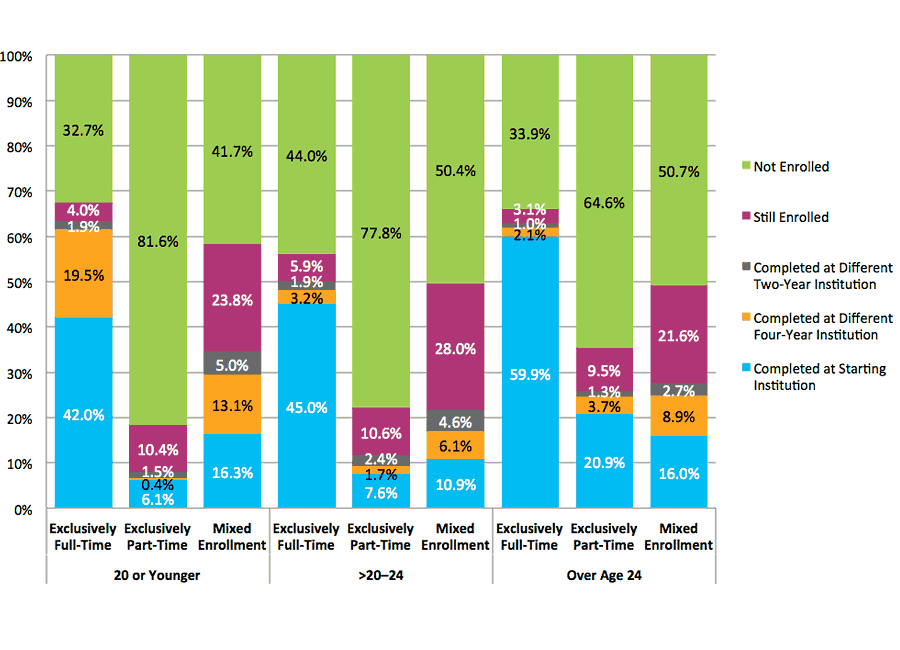
NOTE: Student with date of birth data missing were excluded from the above figure. This figure is based on data shown in Appendix C, Table 47.
When these outcome patterns are broken down further by enrollment intensity within each age group, they show that exclusively full-time students from the youngest group and oldest group had similar rates of overall completion. However, exclusively part-time students from the oldest group had higher rates of overall completion and of first completion at their starting institution compared to their counterparts from the youngest group (see Figure 36). Specifically, 59.9 percent of exclusively full-time students over age 24 at first entry completed first at their starting institution, while this rate was 42.0 percent for exclusively full-time students age 20 or younger at first entry. Among students who enrolled exclusively part time adult learners had the highest completion rate (25.9 percent) followed by the students over age 20 through age 24 (11.7 percent) and traditional-age students (8.0 percent). The results for exclusively part-time students are consistent with our observation at other institution types, suggesting that older students might be better at balancing the demands of school, work, and family.
Traditional-age mixed enrollment students had a higher completion rate than mixed enrollment students in the two older groups (34.5 percent and 27.6 percent, respectively).
COMPLETION ACROSS STATE LINES
Studies on college student completion, restricted by the data available either within institutions or within statewide data systems, have focused primarily on completion at the starting institution or within system or state boundaries. The near-census national coverage of enrollments and awarded degrees provided in Clearinghouse data enables us to offer policymakers and researchers a national view of completion not available in studies using other data sources. Drawing on this resource in this section, we further examine patterns of completion across state lines.
Focusing on students who completed a degree or certificate at institutions different from their starting institution, Figures 37 through 41 show the patterns of first completions across state lines, broken out by enrollment intensity, gender, age group, gender and age, and age group and enrollment intensity. Results for students who started at institutions that operate in multiple states (i.e., multistate institutions) are included in Appendix C, Tables 50-57.
Figure 37. Completion at Different Institutions Across State Lines by Enrollment Intensity
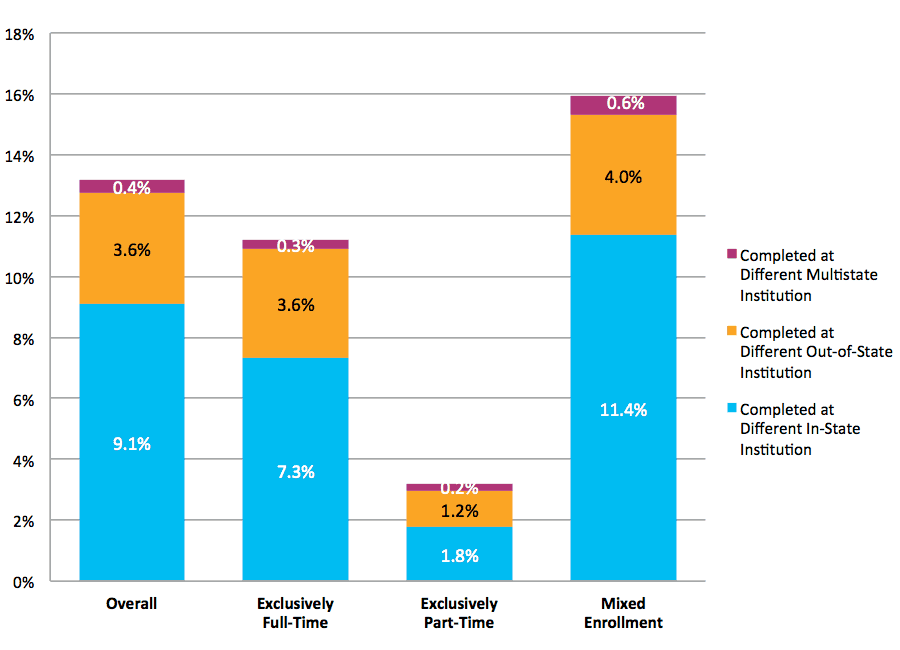
NOTE: Student who started at a multistate institution were excluded from the above figure. This figure is based on data shown in Appendix C, Table 50.
Overall, 13.1 percent of all students completed first at institutions other than their starting institution, with 9.1 percent in the same state where they began, 3.6 percent in a different state, and 0.4 percent at a multistate institution (see Figure 37)5. Among students who completed first at a different institution, completing at an out-of-state institution was quite prevalent. Specifically, almost one-third of full-time students completing first at a different institution did so at an out-of-state institution (3.6 percent out of 11.2 percent), more than one-third of part-time students who completed first at a different institution did so at an out-of state institution (1.2 percent out of 3.2 percent), and a quarter of mixed enrollment students who completed first at a different institution did so at an out-of-state institution (4.0 percent out of 16 percent).
5To place this proportion in further context, we should also note that many students who later completed at multistate institutions did so online and/or from their original home state.
Figure 38. Completion at Different Institutions Across State Lines by Gender
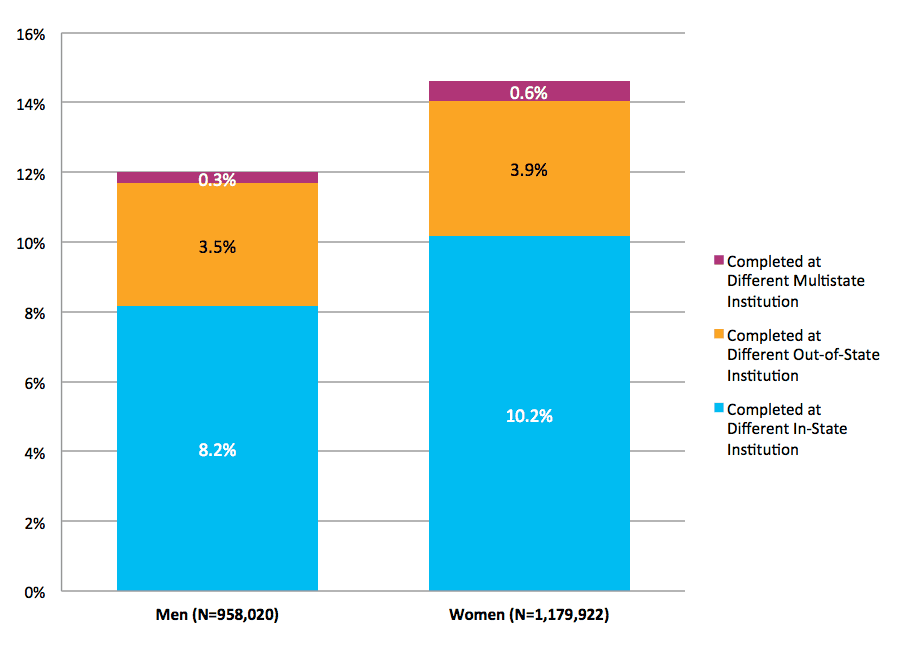
NOTE: Student with date of birth data missing and those who started at a multistate institution were excluded from the above figure. This figure is based on data shown in Appendix C, Table 51.
Completion rates at institutions other than the starting institution are explored by gender in Figure 38. Women and men completed at out-of-state institutions at similar rates (3.9 and 3.5 percent, respectively).
Figure 39. Completion at Different Institutions Across State Lines by Age at First Entry
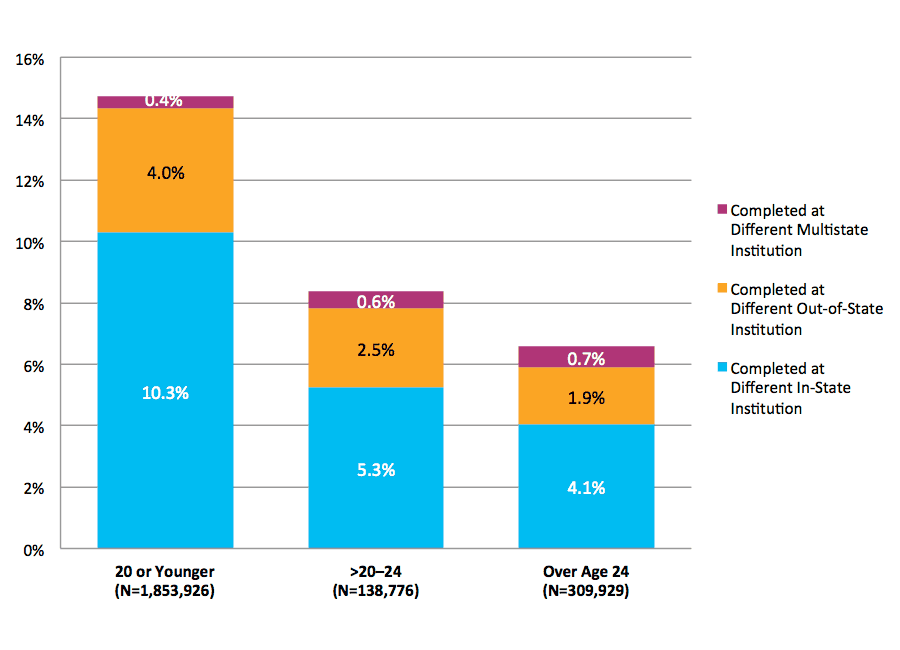
Note: Students with date of birth data missing and those who started at a multistate institution were excluded from the above figure. This figure is based on data shown in Appendix C, Table 52.
Figure 39 shows further results on first completions at institutions other than students’ starting institution, broken out by age group. Students age 20 or younger at first entry showed higher rates of first completion at a different in-state institution (10.3 percent) and at a different out-of-state institution (4.0 percent) compared to those who were over age 20 through age 24 at first entry (5.3 percent and 2.5 percent) and adult learners (4.1 percent and 1.9 percent). These results may suggest that older students were perhaps more restricted by institutional or geographic boundaries, perhaps due to family or work obligations. It is important to keep in mind, however, that first completion across institutions and across state lines does not necessarily represent the actual mobility of students, as many students may change institutions without completing a degree or certificate.
Figure 40. Completion at Different Institutions Across State Lines by Gender and Age at First Entry
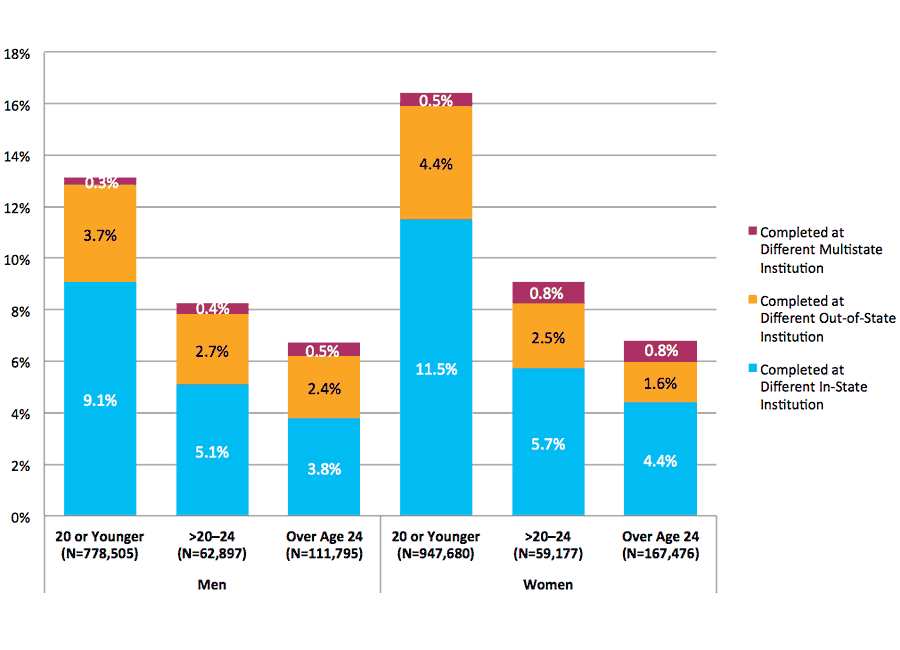
Note: Students with date of birth data missing and those who started at a multistate institution were excluded from the above figure. This figure is based on data shown in Appendix C, Table 53.
Figure 40 shows completions at institutions other than the starting institution within and across stateliness. The highest rates of completing out of state were shown among students who were age 20 or younger at first entry, with traditional-age women showing a higher rate (4.4 percent) than men (3.7 percent). Among adult learners, men had a higher out-of-state completion rate than women (2.4 percent and 1.6 percent, respectively).
Figure 41. Completion at Different Institutions Across State Lines by Age at First Entry and Enrollment Intensity
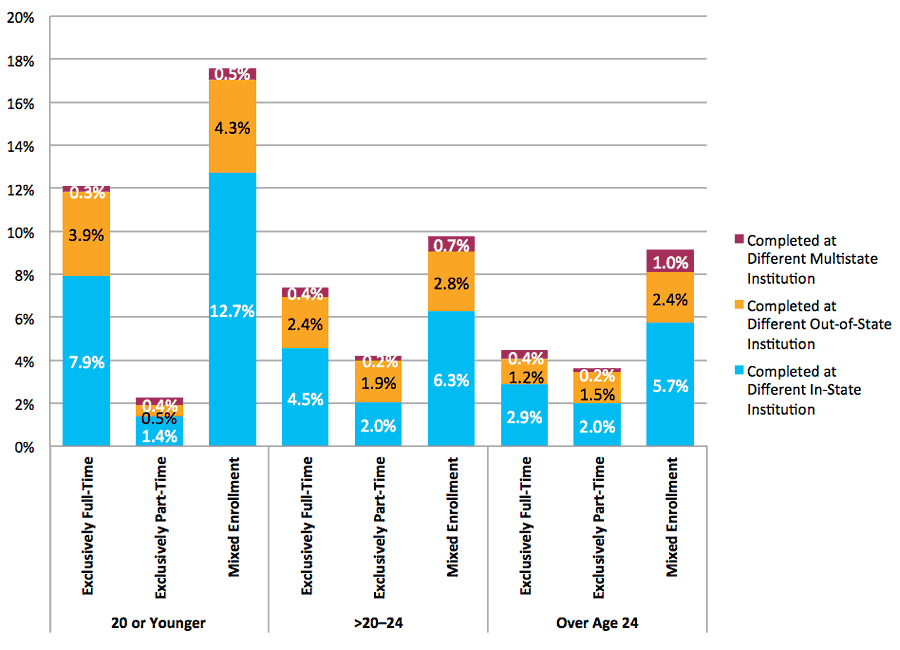
Note: Students with date of birth data missing and those who started at a multistate institution were excluded from the above figure. This figure is based on data shown in Appendix C, Table 54.
The patterns of completion across state lines by enrollment intensity within each age category showed similarities and differences across age groups (see Figure 41). Regardless of age, mixed enrollment students had a higher completion rate at an out-of-state institution than exclusively full-time and exclusively part-time students. Among exclusively part-time students, those over age 20 through age 24 had a higher completion rate (1.9 percent) at an out-of-state institution than adult learners (1.5 percent) and traditional-age students (0.5 percent). Overall, these results show that among students who earned a degree or certificate at a different institution, many also changed states when changing institutions. Taken together, the findings presented throughout the results section point to ways in which student pathways differ across types of starting institutions as well as by students’ age at first entry, gender, and enrollment intensity. Overall, this report highlights differences in six-year outcomes of students, centering on the most widely-used measure of success for both students and colleges — college completion. By disaggregating results by students’ age at first entry, gender, and enrollment intensity throughout the study period, this study sheds light on the college outcomes of students often excluded from relevant policy discussions: students who are older and those who follow nontraditional postsecondary education pathways. Further, the national coverage of Clearinghouse data used for this study makes it possible to capture student mobility and completion beyond institutional boundaries and across state lines. These descriptive findings have the potential to contribute to ongoing discussions of institutional accountability, emerging policy initiatives that use more nuanced and targeted measures of student success, and institutional practices aiming to provide a supportive environment for all students.
SUPPLEMENTAL FEATURE: SEVEN-YEAR OUTCOMES FOR 2006 COHORT
SEVEN-YEAR OUTCOMES BY ENROLLMENT INTENSITY
This supplemental feature showcases seven-year outcomes for first-time students who began college in fall 2006, the cohort at the focus of Signature Report IV released in November 2012.
Figure S-1. Seven-Year Outcomes for Fall 2006 Cohort by Enrollment Intensity (N=1,862,840)
*This figure is based on data shown in Appendix C, Table S-1.
Figure S-1 shows seven-year student outcomes, including first degree or certificate completion, continuing enrollment during the last year of the study period, and stop-out. Results are shown for the full cohort and are broken out by enrollment intensity, showing outcomes for students who were enrolled exclusively full time, exclusively part time, and with mixed enrollment (i.e., enrolled both part time and full time during the study period).
Overall, 43.7 percent of the cohort completed first at their starting institution, and an additional 14.4 percent completed first at a different institution, for a combined completion rate of 58.1 percent nationally. This represents a 4 percentage point increase in total completions over the six-year rate.
Exclusively full-time students showed a total seven-year completion rate of 78.8 percent, including 11.4 percent who completed first at institutions other than their starting institution. An additional 1.8 percent of the exclusively full-time students were still enrolled at the end of the study period, leaving slightly less than 20 percent of this group no longer enrolled for at least a year before the end of the study period. Full-time students’ completions increased by slightly less than three percentage points as compared to six-year rates for the same group. The percentage of full-time students who were still enrolled at the end of the seven-year study period declined by two percentage points, however, possibly indicating that students who had been pursuing degrees over a longer timeline completed. Consequently, the percentage of students who were no longer enrolled remained virtually the same (20 percent at six years compared to 19.5 percent at seven years).
Among exclusively part-time students, 19.1 percent completed degrees or certificates at their starting institution, while an additional 3.6 percent completed at a different institution. Notably, only 8.2 percent were still enrolled at the end of the study period, leaving 69.2 percent who were not enrolled anywhere in the last year of the study period. While completion rates for these students increased modestly over the six-year rates, the decline in persistence for part-time students resulted in a one-point increase in the stop-out rate for this group.
Among students with mixed enrollment, the total completion rate was 46.5 percent, a marked increase over the six-year completion rate for the same cohort (40.9 percent). While nearly one in five mixed enrollment students were still enrolled at the end of seven years, the overall proportion of those no longer enrolled ultimately increased slightly (32.4 percent at six years compared to 34.7 percent at seven years).
Figure S-2. Completion at Starting vs. Different Institution by Enrollment Intensity for Fall 2006 Cohort
*This figure is based on data shown in Appendix C, Table S-1.
Figure S-2 shows the proportions of completers who completed first at their starting institution versus at a different institution for each enrollment intensity group. Overall, nearly one-quarter, 24.7 percent of all completers, earned their first credential somewhere other than their starting institutions. For both exclusively full-time and exclusively part-time students, slightly less than one-sixth obtained their degrees at an institution different from their starting institution (14.4 percent and 15.9 percent, respectively). In contrast, among completers with mixed enrollment intensity, well over one-third completed first at an institution other than the one where they first enrolled (39 percent). Regardless of enrollment intensity, completions at a different institution constituted a larger proportion of completions on the seven-year timeline as compared to the six-year timeline.
Figure S-3. Seven-Year Outcomes for Fall 2006 Cohort by Age Group (N=1,847,108)
NOTE: Student with date of birth data missing were excluded from the above figure. This figure is based on data shown in Appendix C, Table S-2.
Figure S-3 presents differences in seven-year completion and persistence patterns by age at first entry.
Among students age 20 or younger at first entry, 46.2 percent completed first at their starting institution and an additional 16.5 percent completed the first degree or certificate at a different institution, for a total completion rate of 62.7 percent in that group.
Students who were over age 20 through age 24 at first entry showed a total completion rate of 44.1 percent, with almost an equal proportion (43.1 percent) no longer enrolled at the end of the seven year period. Adult learners showed a seven-year total completion rate of 44.8 percent, a gain of approximately 2 percentage points over the six-year rate. Looking across the age groups, it is notable that outcomes for the delayed entry group resemble those of adult learners more than those of their traditional-age peers at seven years after entry.
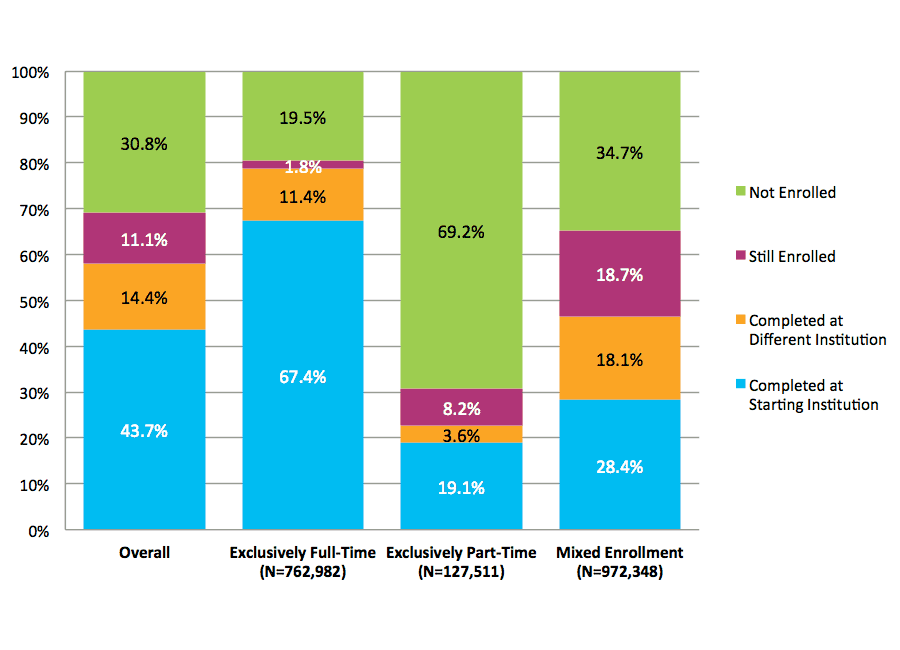
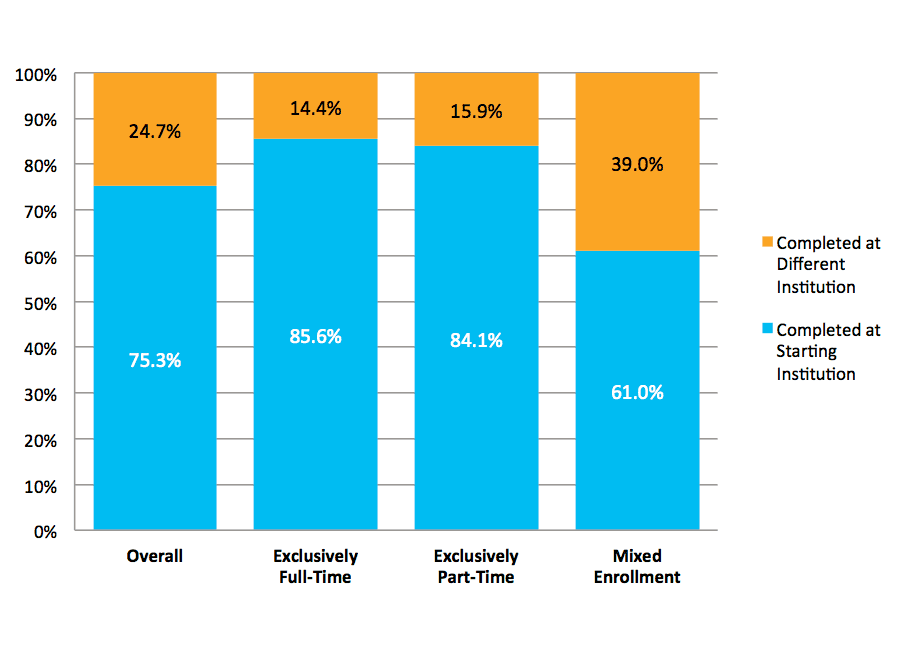
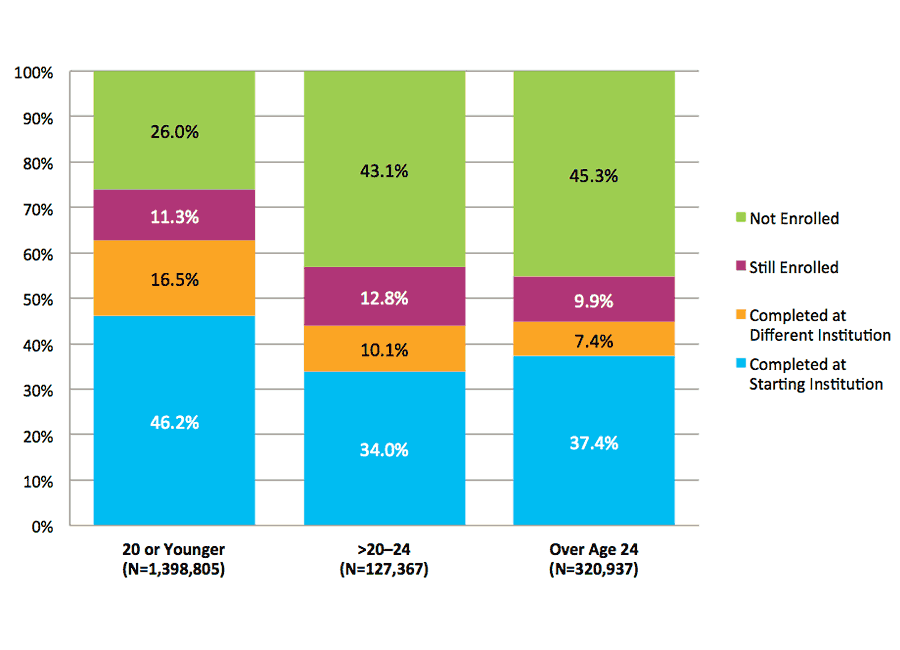
Discussion
In order to form an accurate understanding of our progress toward national college completion goals, researchers, policymakers, and institutions must consider the complexity of postsecondary student pathways. As a contribution to such an inquiry, this Signature Report focuses on students’ first college completions, encompassing postsecondary credentials of all levels and types and accounting not just for students who finish at their starting institution but also for those who transfer and finish at any other institution, nationwide. In this report, we bring the full range of students’ enrollment behaviors into a national view of college completion. This view documents the postsecondary pathways and outcomes of a comprehensive student cohort, including nontraditional-age students and those with part-time or mixed enrollment statuses.
COMPLETION RATES BEYOND THE STARTING INSTITUTION
The overall national six-year completion rate for the fall 2007 cohort increased from 43 percent to 56 percent when degrees and certificates awarded outside the starting institution were included. This result shows that students are doing a better job of achieving their educational goals than the existing institution-focused metrics would suggest. It also demonstrates that, as students attend multiple institutions on the way to their first completion, each of these institutions is likely to have contributed, in its own way, to each student’s pursuit and achievement of their educational goals. The analyses that follow help point the way to policies that recognize and promote such student success while also crediting the institutions that contribute to it.
Counting students who graduated somewhere other than their starting institution increased the completion rate for every institution type and student subgroup we studied. The increases ranged from 5 to 9 percentage points for students starting at private for-profit institutions to 13 to 17 percentage points for those starting at public and private nonprofit institutions. The increase in completion rates was largest for mixed enrollment students (those who attended both full time and part time during the six years), who gained about 16 percentage points, followed by an 11-percentage-point increase for exclusively full-time students and a 3-percentage-point increase for exclusively part-time students.
When considered as a percentage of those who completed degrees, as opposed to a percentage of those who started college, the importance of being able to measure college completions at different institutions from where students started becomes even larger. Overall, nearly one in four students who completed a degree (23.4 percent) did so not at their starting institution but somewhere else. That figure was slightly higher (24.7 percent) for traditional-age students and was one in three (33.6 percent) for students who started at public two-year institutions. It is a striking observation that the most commonly used measures of postsecondary outcomes, same-institution graduation rates, simply fail to account for nearly one-fourth of all student success. Yet, these traditional measures persist in the public debate about the value of our nation’s investment in higher education.
In contrast, the Clearinghouse data used in this study allow researchers to track individual students across institutional and state lines, making more complete and inclusive measures of student outcomes possible. Use of these measures will help institutions and policymakers to focus on the full range of student persistence and degree completion and allow them to better serve all students, not just those on the traditional postsecondary pathway.
COMPLETION RATES BY AGE AT FIRST ENTRY
In this study we introduced a new age category by separating out from the traditional-age students those over age 20 through 24 at the time of first entry. We hypothesized that the outcomes of these students, whom we categorized as a delayed entry group, would be different from those of traditional-age students, as well as from the adult learners. Looking across the results, the persistence and completion outcomes for the delayed entry group were notably lower than those of students who entered college straight from high school, more closely resembling instead those of adult learners. This highlights the advantages of immediate postsecondary enrollment after high school graduation. However, of course, students may delay entry to postsecondary education due to a combination of factors, including both necessity and choice. A more important takeaway from this finding is that institutions might use the information to guide policy and practice toward differentiated approaches appropriate to students who delay entry as well as for traditional age students and adult learners.
Gains in completion rates from completions at institutions other than the starting institution were greater for students age 20 or younger at first entry into college than they were for older students: 14.7 percentage points, compared to 8.4 and 6.8 percentage points for the delayed entry (over age 20 through age 24 at first entry) and adult learner (over age 24) groups, respectively. This left a sizable gap between the overall six-year completion rates of traditional-age students and adult learners, with the latter group having a much lower completion rate (43.5 percent vs. 59.7 percent). The total completion rate was lower still (40.8 percent) for delayed entry students who began college at between 20 and 24 years old. By the end of the study period, 43.9 percent of the adult learner group was not enrolled anywhere, compared to 24.3 percent of the traditional-age students. This suggests that the low six-year completion rate is not simply a matter of students taking a longer time to finish, but rather represents a genuine issue of non-persistence or stopout among students over age 24. Although students over age 20 through age 24 persisted without completion at a higher rate than those over age 24, their stop-out rate was nevertheless still high — only slightly below that of the older group.
Disaggregating by both age and enrollment intensity demonstrated that part-time enrollment is less of a disadvantage to older students than to younger students. Exclusively part-time students over age 24 actually showed a higher completion rate than did part-time students in either of the two younger age groups. These differences across groups highlight the need for institutions to target and differentiate their efforts for improving student outcomes, tailoring advising and programs, to the extent possible, to align with the needs of different types of students. Traditional-age students attending part-time, for example, may be less experienced with juggling the multiple demands frequently associated with part-time enrollment (e.g., work, family responsibilities, classes) than their older peers. Consequently, traditional-age part-timers may struggle more to persist and complete within a six-year time frame.
Institutions’ policies and organizational structures potentially have distinct implications for older students. Compared to those of younger students, the success rates of adult learners varied greatly depending on the type of institution they attended. Full-time adult learners who started at four-year private for-profit institutions, for example, completed at their starting institution at a rate more than 17 percentage points higher than their traditional-age counterparts. This pattern was reversed, however, for adult learners who started at any other type of institution, where full-time adult learners completed at lower rates than traditional-age students. These findings suggest that adult learners may be engaged differently across institutional contexts. Institutions in each of these sectors may benefit from comparing the outcomes of their own students to those of national and sector benchmarks, and perhaps adjusting their strategies for supporting adult learners to address their particular patterns of success.
SIX-YEAR OUTCOMES BY GENDER
This report introduces data on student gender to the Clearinghouse’s measurement of completion rates, providing a new tool for understanding trends in student success that was not available in our 2012 report. The gender gap emerged in bachelor’s degree attainment has favored women since 1982, and by 2004 women received 58% of all bachelor’s degrees, a trend that is expected to continue to widen (Buchmann & DiPrete, 2006). Analysis of National Educational Longitudinal Study (NELS) data showed that “the female advantage in college completion remains largest in families with a low-educated or absent father, but currently extends to all family types,” and the primary factor in this gender gap is the higher dropout rate for males from four-year institutions (Buchmann & DiPrete, 2006). The trend of higher BA attainment rates for women is not unique to the United States, as nearly all 30 members of the Organization for Economic Cooperation and Development (OECD) demonstrated a rising baccalaureate degree completion rate favoring women (OECD, 2009).
Results from the analyses presented in this report are consistent with these patterns. Overall six-year completion rates for the fall 2007 national cohort showed a gender gap of 6.7 percentage points in favor of women. However, when results were disaggregated by age at first entry the advantage to women was concentrated among traditional-age students, with relatively small to nonexistent gaps among older students. When examined across institution types, the advantage of women among traditional-age students remained consistent, but other patterns emerged among older students. For example, the six-year completion rate for women adult learners who started at four-year public institutions was slightly lower than that for their male counterparts. Further study is warranted to better understand this phenomenon. Nonetheless, the results suggest that opportunities exist for public policy and institutional practices to better address the specific experiences and barriers that may affect rates of completion among students of different age and gender characteristics at different types of institutions.
FOUR-YEAR COMPLETIONS FOR FIRST-TIME STUDENTS WHO STARTED AT TWO-YEAR PUBLIC INSTITUTIONS
In addition to examining the overall completion rates of students who started at two-year public institutions, we looked at these students’ completions at four-year institutions, giving particular attention to whether they received their four-year degree with or without first earning a credential at a two-year institution. Overall, 17.1 percent of two-year starters completed a degree at a four-year institution by the end of the study period, and over half of these did so without first obtaining a two-year degree (58 percent of the four-year degree earners, or 10 percent of the full cohort who started at two-year institutions). These students transferred and graduated from a four-year institution without receiving any credential from their starting (or from any other) two-year institution. Traditional graduation rate measures that focus only on completions at the starting institution do not account for this type of outcome, even though it is a well-worn pathway receiving increasing attention in today’s resource-constrained policy environment.
In our second Signature Report, Transfer and Mobility: A National View of Pre-Degree Student Movement in Postsecondary Institutions (Hossler et al., 2012), we reported that 25 percent of the starting two-year cohort transferred to a four-year institution within five years — five percent having obtained a two-year credential prior to transfer and 20 percent transferring without a two-year credential. The findings from this report build on these earlier analyses to demonstrate that, although many state policies encourage students to obtain a degree at a two-year public institution before transferring to a four-year institution, in reality, the majority of students who follow this pathway make the transfer without a two-year credential. For the fall 2007 study cohort, the six-year baccalaureate completion rate for two-year starters was 17.1 percent, with 10 percent showing baccalaureate completions without a prior two-year degree and 7 percent doing so with a two-year credential in hand. Findings from our fifth Signature Report, Baccalaureate Attainment: A National View of the Postsecondary Outcomes of Students Who Transfer from Two-Year to Four-Year Institutions showed that students who completed a two-year degree or certificate prior to transferring to a four-year institution graduated with a bachelor’s degree at a higher rate — about 16 percentage points higher — than those who did not. Taken together these findings suggest that while transferring to a four-year institution with a two-year degree can be an effective pathway to a bachelor’s degree, transferring without an associate’s degree may not, even though that pattern is more common. This demonstrates the relevance of enacting policies that encourage transfer with an associate’s degree, but it also shows the need for other policies that support students who prefer or need to do otherwise. Baccalaureate institutions serving transfer students may benefit from examining their students’ outcomes against these benchmarks in order to better understand their needs.
COMPLETION RATES FOR DUAL ENROLLMENT STUDENTS
This report introduced a significant enhancement to the student cohort under study by including, for the first time, those students who entered college with prior experience in college-level courses through dual enrollment opportunities while still in high school. When former dual enrollment students were added to the cohort, the overall completion rate jumped from 54 percent to 56 percent. Analysis of the postsecondary outcomes of former dual enrollment students showed a completion rate of 66 percent for this group, 12 percentage points higher than the completion rate for the students who had no prior dual enrollment experience in the fall 2007 entering cohort. It should be noted that 98 percent of the dual enrollment students were in the traditional age group, 20 or younger, upon entering college in fall 2007, and when we compare completion rates among traditional-age students, the advantage of those with dual enrollment credits fell to eight percentage points (66 percent and 58 percent, respectively). This is not surprising because former dual enrollment students already had some college credits to start with. More pointedly, their higher completion rate in this descriptive study cannot speak to the effectiveness of dual enrollment programs per se, since there are undoubtedly selection effects in the sample of students who participate in these programs for which the data in this report does not account. That is, many of the students with prior dual enrollment credits would have been more likely to graduate from college anyway. Nonetheless, the results show that including students with prior dual enrollments in the starting cohort clearly increases the observed national college completion rate.
OUT-OF-STATE COMPLETIONS
Previous Signature Reports shed light on the prevalence of out-of-state transfers by showing that over a quarter of all transfers, or 9 percent of the starting cohort, enrolled in an institution in a different state and 3.5 percent received a degree in a different state from their starting institution (Hossler et al., 2011b, Dundar et al., 2012b). Extending these findings, this study found that, similar to the previous finding, 3.6 percent of the 2007 starting cohort received a degree in a state different from the one in which they started. Thus, out-of-state completions represent 6.4 percent of all completions. The completion outcomes for these students are typically invisible not only to institution-based graduation rate measures, but also to state longitudinal databases that track students only within a single state.
SEVEN-YEAR OUTCOMES FOR FALL 2006 NATIONAL COHORT
This report’s supplemental feature examined seven-year outcomes for the fall 2006 cohort, tracking their enrollment patterns through spring 2013. The extra year clearly makes a difference: within seven years of starting, 43.7 percent of the 2006 cohort completed at their starting institution, while an additional 14.4 percent completed at a different institution, for a combined completion rate of 58.1 percent nationally. This represents a 4 percentage point increase in total completions over the six-year rate reported in our 2012 Completions Report. At the same time, the percentage of students who were still enrolled at the end of the seven-year period declined by 5 percentage points, indicating that very few students, only about 1 percent of the cohort, dropped or stopped out in the seventh year. Not surprisingly, however, students who required the extra year to complete their first degree mostly have done so at a different institution from where they started. After seven years, nearly one-quarter (24.7 percent) of all completers had earned their first credential somewhere other than their starting institution, compared to 22.4 percent of the same cohort when the completions were measured at the six-year point. This reflects an intuitively obvious point: the longer we track the outcomes for a given cohort, the more diverse the students’ pathways to those outcomes become.
Students across the three enrollment intensity categories showed similar results in comparing six- and seven-year outcomes for the cohort. Among students with mixed enrollment, however, the seven-year total completion rate showed a marked increase (46.5 percent) over the six-year completion rate for the same cohort (40.9 percent).
Seven-year completion results for adult learners also showed increases over six-year outcomes, consistent with the increases already discussed above for the overall fall 2006 cohort. Among adult learners, 37.4 percent completed first at their starting institution within seven years, and an additional 7.4 percent completed the first degree or certificate at a different institution – resulting in a 44.8 percent total completion rate for adult learners. The six-year rates for the supplemental feature cohort (fall 2006) were lower: 35.9 percent for completions at the starting institution and 6.2 percent completing elsewhere, for a 42.1 percent total six-year completion rate. Changes in percentages from six-year to seven-year outcome suggest that it is helpful to track college students for a longer period, particularly in order to capture fuller outcomes for non-traditional students such as those with mixed enrollments and multiple institutions in their pathways to the degree.
IMPLICATIONS FOR PUBLIC POLICYMAKING
The findings outlined in this report further demonstrate the need for improved student outcome measures that capture the complexity of students’ postsecondary pathways. Implementing measures that account for student mobility and enrollment intensity patterns, for example, will help researchers to avoid the pitfalls of misclassifying as failures those students who persist or graduate at an institution different from their starting institution. This kind of shift will, moreover, allow policymakers to more accurately measure and credit the contributions of institutions that serve students who transfer or enroll part time.
Moving in this direction will also enable a parallel shift in public and institutional policies that acknowledges and responds to student pathways that may entail mobility across institutional and state lines, part-time and mixed enrollment, a gender gap that varies by age, and entry into postsecondary institutions at a variety of different ages and life circumstances. Of course, it will always be important for public policy to incentivize institutional efforts to retain and graduate students at their starting institution wherever possible, since this will continue to be the shortest path to a degree for those students who have the option of pursuing it. At the same time, however, such policies should also establish institutions’ accountability for retaining and graduating non-traditional students, the part-time and mixed enrollment students, adult learners, and students who delay enrolling in college for a few years after high school. Colleges and universities should likewise shape institutional policies that reflect the distinctive needs and pathways of these groups of students.
While measuring student completion outcomes continues to be a widely accepted focus in higher education policy, there is a continued need to press for and examine results that capture the full range of student enrollment, persistence, and completion in postsecondary education. The findings highlighted in this report show the value and power of using comprehensive national student-level data to inform these perspectives.
References
Adelman, C. (1999). Answers in the tool box: Academic intensity, attendance patterns, and bachelor’s degree attainment. Washington, DC: U.S. Department of Education, Office of Educational Research and Improvement.
Adelman, C. (2006). The toolbox revisited: Paths to degree completion from high school through college. Washington, DC: U.S. Department of Education.
Advisory Committee on Student Financial Assistance (ACSFA). (2012, February). Pathways to success: Integrating learning with life and work to increase national college completion (A report to the U.S. Congress and Secretary of Education). Washington, DC: Author.
Bach, S. K., Banks, M. T., Kinnick, M. K., Ricks, M. F., Stoering, J. M., & Walleri, R. D. (2000, June). Student attendance patterns and performance in an urban postsecondary environment. Research in Higher Education, 41(3), 315–330.
Baum, S., Ma, J., & Payea, K. (2013). Education pays 2013: The benefits of higher education for individuals and society. Washington, DC: College Board. Retrieved 11/4/2013 from: http://trends.collegeboard.org/sites/default/files/education-pays-2013-full-report.pdf
Belfield, C., Crosta, P., & Jenkins, D. (2013). Can community colleges afford to improve completion? Measuring the costs and efficiency effects of college reforms (CCRC Working Paper No. 55). New York, NY: Community College Research Center, Columbia University.
Bill & Melinda Gates Foundation. (2009). Postsecondary success. Redmond, WA: Author. Retrieved from http://www.gatesfoundation.org/united-states/Pages/postsecondary-education-success-plan-brochure.aspx
Blumenstyk, G. (2013, July 24). In speech on economy, Obama vows to ‘shake up’ higher education. The Chronicle of Higher Education. Retrieved from http://chronicle.com/article/In-Speech-on-Economy-Obama/140525/
Buchmann, C., & DiPrete, T. A. (2006, August). The growing female advantage in college completion: The role of family background and academic achievement. American Sociological Review, 71(4), 515-541.
Carnevale, A. P, Rose, S. J., & Cheah, B. (2011). The college payoff: Education, occupations, and lifetime earnings. Washington, DC: The Georgetown University Center on Education and the Workforce.
Choy, S. P. (2002). Access and persistence: Findings from 10 years of longitudinal research on students. Washington, DC: American Council on Education.
College Board Advocacy and Policy Center. (2010). The college completion agenda: State policy guide. New York, NY: Author.
Committee on Measures of Student Success. (2011, December). Committee on Measures of Student Success: A report to Secretary of Education Arne Duncan. Washington, DC: Author.
Complete College America. (2013, September 12). College Completion Data. http://www.completecollege.org/stateData.html. Retrieved September 12, 2013, from http://www.completecollege.org/.
DeAngelo, L., Franke, R., Hurtado, S., Pryor, J. H., & Tran, S. (2011). Completing college: Assessing graduation rates at four-year institutions. Los Angeles, CA: Higher Education Research Institute.
Dougherty, K. J., & Kienzel, G. S. (2006). It’s not enough to get through the open door: Inequities by social background in transfer from community colleges to four-year colleges. Teachers College Record, 108(3), 452–487.
Doyle, W. R. (2009). The effect of community college enrollment on bachelor’s degree completion. Economics of Education Review, 28(2), 199–206.
Eagan, M. K., & Jaeger, A. J. (2009). Effects of exposure to part-time faculty on community college transfer. Research in Higher Education, 50(2), 168–188.
Goldrick-Rab, S., & Pfeffer, F. T. (2009, April). Beyond access: Explaining socioeconomic differences in college transfer. Sociology of Education, 82(April), 101–125. Retrieved from http://soe.sagepub.com/content/82/2/101.full.pdf+html.
Hauptman, A. M. (2012). Increasing higher education attainment in the United States: Challenges and opportunities. In M. Schneider & A. P. Kelly (Eds.), Getting to graduation: The completion agenda in higher education (pp. 17–47). Baltimore, MD: Johns Hopkins University Press.
Higher Learning Commission (2013, February). Dual credit in U.S. Higher Education: A study of state policy and quality assurance practices. Retrieved 11.15.13 from http://web.archive.org/web/20140814002813/http://education.illinois.edu/sites/default/files/news/documents/4-Dual%20Credit%20H-Final.pdf
Hillman, N., Lum, T., & Hossler, D. (2008). Understanding Indiana’s reverse transfer students: A case study in institutional research. Community College Journal on Research & Practice, 39(2), 113–134.
Horn, L. J., & Carroll, C. D. (1997, October). Confronting the odds: Students at risk and the pipeline to higher education (Statistical Analysis Report, NCES 98-094). Washington, DC: U.S. Department of Education, National Center for Education Statistics.
Hossler, D., Dundar, A., Shapiro, D. (2013). Longitudinal pathways to persistence and college completion: Student, institutional, and public policy perspectives. In. L. Perna & A. Jones (Eds.), The state of college access and completion: Improving college success for students from underrepresented groups (pp. 140–165). New York, NY: Routledge.
Hossler, D., Shapiro, D., Dundar, A., Chen, J., Zerquera, D., Ziskin, M., & Torres, V. (2012a, July). Reverse transfer: A national view of student mobility from four-year to two-year institutions (Signature Report No. 3). Herndon, VA: National Student Clearinghouse Research Center.
Hossler, D., Shapiro, D., Dundar, A., Ziskin, M., Chen, J., Zerquera, D., & Torres, V. (2012b, February). Transfer and mobility: A national view of pre-degree student movement in postsecondary institutions (Signature Report No. 2). Herndon, VA: National Student Clearinghouse Research Center.
Jaschik, S. (2013, August 22). Obama’s ratings for higher ed. Inside Higher Ed. Retrieved from http://www.insidehighered.com/news/2013/08/22/president-obama-proposes-link-student-aid-new-ratings-colleges
Kelly, A. P., & Schneider, M. (Eds.) (2012). Getting to graduation: The completion agenda in higher education. Baltimore, MD: Johns Hopkins University Press.
Lee, J. M., Jr., Edwards, K., Menson, R., & Rawls, A. (2011). The college completion agenda: 2011 progress report. Washington, DC: College Board Advocacy and Policy Center.
Lewin, T. (2013, August 22). Obama’s plan aims to lower cost of college. The New York Times. Retrieved from http://www.nytimes.com/2013/08/22/education/obamas-plan-aims-to-lower-cost-of-college.html?pagewanted=all&_r=2&
Lumina Foundation for Education. (2009). Goal 2025: Lumina Foundation’s strategic plan. Indianapolis, IN: Author.
McCormick, A. C. (2003, spring). Swirling and double-dipping: New patterns of student attendance and their implications for higher education. In J. E. King, E. L. Anderson, & M. E. Corrigan (Eds.), Changing student attendance patterns: Challenges for policy and practice [Special issue]. New Directions for Higher Education, 2003(121), 13-24.
McCormick, A. C., & Carroll, C. D. (1997, June). Transfer behavior among beginning postsecondary students, 1989–94 (Postsecondary Education Descriptive Analysis Reports: Statistical Analysis Report). Washington, DC: U.S. Department of Education, National Center for Education Statistics.
Moore, C., & Shulock, N. (2009). Student progress toward degree completion: Lessons from the research literature. Sacramento, CA: Institute for Higher Education Leadership and Policy.
Mullin, C. M. (2010, June). Rebalancing the mission: The community college completion challenge (Policy Brief 2010-02PBL). Washington, DC: American Association of Community Colleges.
Mullin, C. M. (2011, October). The road ahead: A look at trends in the educational attainment of community college students (Policy Brief 2011-04PBL). Washington, DC: American Association of Community Colleges.
National Center for Education Statistics (NCES). (2013, April). The condition of education: International educational attainment. Retrieved from http://nces.ed.gov/programs/coe/indicator_cac.asp.
National Conference of State Legislatures [NSLC]. (2013). Performance funding for higher education. Retrieved from http://www.ncsl.org/issues-research/educ/performance-funding.aspx.
Obama, B. (2009, February 24). Remarks of President Barack Obama as prepared for delivery. Address to joint session of Congress, Tuesday, February 24, 2009 [Website post]. Retrieved from http://www.whitehouse.gov/the_press_office/Remarks-of-President-Barack-Obama-Address-to-Joint-Session-of-Congress/
Organisation for Economic Cooperation and Development (OECD). (2013a). Education at a glance 2013: Country note – United States. Retrieved from http://www.oecd.org/edu/United%20States%20_EAG2013%20Country%20Note.pdf.
Organisation for Economic Cooperation and Development (OECD). (2013b). Education at a glance 2013: OECD indicators. Retrieved from http://www.oecd.org/edu/eag2013%20(eng)–FINAL%2020%20June%202013.pdf.
Organisation for Economic Co-operation and Development (OECD). (2009). Education at a Glance. Accessed 11/01/13 from: http://www.oecd.org/education/skills-beyond-school/43619343.pdf.
Perna, L. W., & Jones, A. (Eds.). (2013). The state of college access and completion: Improving college success for students from underrepresented groups. New York, NY: Routledge.
Peter, K., Cataldi, E. F., & Carrell, C. D. (2005). The road less traveled? Students who enroll in multiple institutions (NCES 2005-157). Washington, DC: National Center for Education Statistics.
Petrick, R. (2012). Increasing higher education attainment in the United States: Challenges and opportunities. In M. Schneider & A. P. Kelly (Eds.), Getting to graduation: The completion Agenda in Higher education (pp. 269-292). Baltimore, MD: Johns Hopkins University Press.
Radford, A. W., Berkner, L., Wheeless, S. C., & Shepherd, B. (2010, December). Persistence and attainment of 2003-04 beginning postsecondary students: After 6 years. Washington, DC: National Center for Education Statistics.
Reeves, T. J., Miller, L. A., & Rouse, R. A. (2011). Reality check: A vital update to the landmark 2002 NCES study of nontraditional college students. Phoenix, AZ: Apollo Research Institute.
Russell, A. (2011, October). A guide to major U.S. college completion initiatives (AASCU Policy Matters). Washington, DC: American Association of State Colleges and Universities.
Schneider, M. (2013). Higher education pays: But a lot more for some graduates than others. Washington, DC: American Institutes for Research. Retrieved from http://www.air.org/files/Higher_Education_Pays_Sep_13.pdf.
Thomas, N., Marken, S., Gray, L., & Lewis, L. (2013). Dual Credit and Exam-Based Courses in U.S. Public High Schools: 2010–11 (NCES 2013-001). U.S. Department of Education. Washington, DC: National Center for Education Statistics. Retrieved 11.15.13 from http://nces.ed.gov/pubsearch.
U.S. Bureau of Labor Statistics. (2013). Earnings and employment rates by educational attainment. Retrieved from http://www.bls.gov/.
U.S. Department of Education. (2011a, March). College completion tool kit. Washington, DC: Author. Retrieved from http://www.ed.gov/college-completion/governing-win.
U.S. Department of Education. (2011b, December). Committee on Measures of Student Success: A report to Secretary of Education Arne Duncan. Washington, DC: Author. Retrieved from http://www2.ed.gov/about/bdscomm/list/acmss.html#reports.
U.S. Department of Education. (2011c, March 18). Meeting the nation’s 2020 goal: State targets for increasing the number and percentage of college graduates with degrees. Washington, DC: Author. Retrieved from http://www.whitehouse.gov/sites/default/files/completion_state_by_state.pdf.
University Professional and Continuing Education Association & InsideTrack. (2012). Measuring nontraditional student success: An imperative for colleges and universities. Washington, DC: Authors.
Appendix A: Methodological Notes
This report describes six-year college student success outcomes, focusing primarily on degree and certificate completion of a cohort of first-time-in-college degree-seeking students who started their postsecondary education at U.S. colleges and universities in the fall of 2007. The study follows this cohort for six years, through May 31, 2013. The results presented in the report center on student outcomes over the six-year span, including completion (i.e., receipt of any postsecondary credential by the end of the study period), persistence (i.e., having enrollment records at any postsecondary institution during the last year of the study period), and stop-out without completion (i.e., having no enrollment records at any postsecondary institution during the last year of the study period). The report mainly focuses on students’ first completion, with further distinctions drawn between completions awarded at the institution where a student first enrolled (his or her starting institution) and those awarded at an institution other than the starting institution. For students who started at a two-year public institution, this report also presents an overview of their completions at a four-year institution, either as a first completion (i.e., those who completed a four-year degree without having first earned a credential at a two-year institution6) or as a subsequent degree after a first completion awarded in the two-year sector. In addition to results on degree and certificate completion rates by enrollment intensity, age group, gender and starting institution type, the report includes results on completion across state lines, and for students who started at multistate institutions.
6Throughout this report, “two-year institution” is used broadly to designate institutions offering both associate’s degrees and less-than-two-year degrees and certificates.
NATIONAL COVERAGE OF THE DATA
The National Student Clearinghouse® (the Clearinghouse) is a unique and trusted source for higher education enrollment and degree verification. Since its creation in 1993, the participation of institutions nationwide in Clearinghouse data-collection programs has steadily increased. Currently, Clearinghouse data include more than 3,500 colleges and 95 percent of U.S. college enrollments. The Clearinghouse has a 20-year track record of providing automated student enrollment and degree verifications. Due to the Clearinghouse’s unique student-level record approach to data collection in its StudentTracker service, the Clearinghouse database provides opportunities for robust analysis not afforded by the more commonly used institution-level national databases.
The enrollment data used in this report provide an unduplicated headcount for the fall 2007 first-time-in-college student cohort. Clearinghouse data track enrollments nationally and are not limited by institutional and state boundaries. Moreover, because this database is comprised of student-level data, researchers can use it to link concurrent as well as consecutive enrollments of individual students at multiple institutions — a capability that distinguishes the Clearinghouse database from national databases built with institution-level data. For instance, in the National Center for Education Statistics (NCES) Integrated Postsecondary Education Data System (IPEDS) — one of the most widely used national data sets in postsecondary education research — concurrent enrollments remain unlinked and, therefore, are counted as representing separate individuals.
COHORT IDENTIFICATION, DATA CUT, AND DEFINITIONS
Focusing on the cohort of first-time-in-college degree-seeking students who started their postsecondary studies at U.S. colleges and universities in the fall of 2007, this report examines completion over a span of six years, through May 31, 2013. In order not to exclude or misrepresent the outcomes of students whose postsecondary pathways included enrollment in college preparatory summer study, the report also includes students who started their studies in the summer of 2007 (i.e., May 1-August 31, 2007). Furthermore, to limit the cohort to first-time undergraduate students only, the study uses data from the Clearinghouse’s StudentTracker and DegreeVerify services to confirm that students included in the study (1) showed no previous college enrollment in the four years prior to May 31, 2007, and (2) had not previously completed a college degree prior to August 13, 2007. Former dual enrollment students, first-time college students who had enrolled in college courses while still in high school, were included in the cohort for this study (see more on former dual enrollment students below).
In defining the study cohort, it was necessary to identify a coherent set of first-enrollment records that would as closely as possible represent a starting point for the fall 2007 cohort of first-time-in-college students. With this goal in mind, the researchers excluded enrollment records that were either (1) not clearly interpretable within the study’s framework and data limitations or (2) inconsistent with the experiences of first-time college enrollment that were the focus of the analysis. Students who showed concurrent enrollments (defined in this step as enrollments overlapping by at least one day) in the fall 2007 term were therefore excluded from the study, as were students who showed no enrollment lasting longer than 21 days in fall 2006. Also excluded were students who had any enrollment terms shorter than one day, who first enrolled in postsecondary study outside the U.S. or its territories (e.g., Guam, Puerto Rico, the U.S. Virgin Islands), or who started at non-IPEDS institutions.
Because our outcome of interest was completion, we sought to focus analyses on degree-seeking students only. Consequently, we attempted to exclude non-degree-seeking, casual course takers from the cohort. For students who first enrolled in four-year institutions, non-degree-seeking students were defined as those who had only one enrollment record, with intensity of less than half-time. Students who started at two-year institutions were excluded as non-degree-seeking students if they failed to meet both of the following criteria: (1) one or more full-time enrollment before August 15, 2008 and (2) two enrollment terms with half-time status or more before December 31, 20087. Finally, we excluded students whose last enrollment record was in any of the following institutional contexts: Two-year private for-profit institutions in Nebraska and New York8. These students were excluded because of the low coverage for these institution types within these states, combined with high rates of stop-out and undercoverage for these institutions, or with changes of institution type within the study period. Because of these limitations, the available data did not describe these students’ pathways well enough to be used as bases for weights (see below more on weights).
In summary, the study cohort included students who fulfilled all of the following conditions:
- Enrolled in a Title IV institution in fall 2007 (defined as any term with a start date between August 13 and October 31, 2007, inclusive);
- Did not have a previous enrollment record, as shown in StudentTracker, between June 1, 2003, and May 31, 2007, unless the previous enrollment record was before the student turned 18 years old (dual enrollment);
- Did not receive any degree or certificate from a postsecondary institution prior to the first day of enrollment in fall 2007, according to Clearinghouse data unless the award date was before the student turned 18 years old (dual enrollment);
- Enrolled at just one institution in fall 2007 (i.e., showed no overlapping multiple enrollments between August 13 and October 31, 2007);
- Enrolled for at least one term that was longer than 21 days and that started between August 13 andOctober 31, 2007;
- Showed no enrollment terms of implausible length (i.e., either longer than 365 days or shorter than one day) throughout the study period;
- Had at least one legitimate enrollment status throughout the study period; that is, enrolled for at least one term with full-time, part-time (i.e. half-time or less than half-time), or withdrawal status9;
- Showed intent to seek a degree or certificate. That is:
- For students who started at four-year institutions, enrolled at least one term with an intensity of half-time or higher.
- For students who started at two-year institutions, either:
- Enrolled full time for at least one term before August 15, 2008, or
- Enrolled at least half-time for any two terms before December 31, 2008;
- Did not show a last enrollment record in any of the following contexts, identified above as having a combination of low coverage and high rates of stop-out:
- Two-year private for-profit institutions in Nebraska
- Two-year private for-profit institutions in New York
7 We excluded 516,464 students who began at two-year institutions, as non-degree-seeking students as a result.
8 A total of 1,297 students were excluded from the degree-seeking cohort following this criterion. 9 The Clearinghouse receives enrollment status data as full-time, half-time, less-than-half-time, withdrawal, or other statuses from its participating institutions.
FORMER DUAL ENROLLMENT STUDENTS
The cohort used in this study includes former dual enrollment students: first-time college students who had previously taken dual enrollment courses. These are the students who enrolled in college courses prior to fall 2007 while still in high school. Enrollment records in the Clearinghouse data do not have an indicator for dual enrollment students. For this reason a proxy was used to identify this population. Students were identified as former dual enrollment students if their enrollment or degree record prior to fall 2007 was before the student turned 18 years old. Former dual enrollment students represent 15.6 percent of the fall 2007 cohort. As proportion of the sample for each sector, former dual enrollment students represent 17 percent of the students who started in four-year public institutions, 15 percent of the students who started in two-year public institutions and 15 percent of those who started in four-year private nonprofit institutions. Only two percent of the students who started in four-year private for-profit institutions had prior dual enrollments.
ENROLLMENT INTENSITY
For this report, enrollment intensity is classified as exclusively full time throughout the study period, exclusively part time throughout the study period, or mixed enrollment (including both full-time and part-time enrollments), based on students’ enrollments across all terms through the first completion or, for non-completers, through the entire study period. In establishing students’ enrollment intensity in this way, enrollments during summer terms (defined as terms with both the start date and the end date falling between May 1 and August 31 in any given year) and short terms (defined as terms lasting less than 21 days) were excluded from consideration.
For terms in which a student showed concurrent enrollment records (i.e., records that overlapped by 30 days or more), the two highest-intensity enrollments were considered. For example, a student concurrently enrolled half time at two institutions was categorized as enrolled full time for that term. Overall, for each term under consideration (i.e., all terms except summer terms and short terms − less than 21 days − up through the first completion, or, if no completion, throughout the entire study period), the “exclusively full-time enrollment” designation was assigned to students whose enrollment showed one of three situations: (1) the enrollment record showed exclusively full-time enrollment for all terms; or (2) for terms with concurrent enrollments, the two highest-intensity enrollment records included at least one full-time enrollment; or (3) for terms with concurrent enrollments, the two highest-intensity enrollment records both reflected half-time enrollment.
The “part-time enrollment” designation was assigned to students whose enrollment for each term under consideration showed one of the two following situations: (1) the enrollment record showed exclusively half-time or less than half-time enrollment; or (2) for terms with concurrent enrollments, the two highest-intensity enrollment records included some combination of half-time and less than half-time enrollments, but no full-time enrollment, and no more than one half-time enrollment.
The category of mixed enrollment was applied to students who showed a combination of full-time and part-time enrollments across the terms under consideration. Finally, students who showed records indicating withdrawal but no full-time or part-time enrollments were randomly assigned to an enrollment intensity category.
AGE GROUP
The study focused on three age groups, namely, 20 years old or younger, between 21 and 24 years old, and older than 24 years old. The first group “20 years old or younger” is defined to approximate enrollment immediately after high school, while the second group (“between 21 and 24 years old”) is meant to represent students who delay entry into postsecondary education for a few years after finishing high school. The final category included adult learners, defined as those who were older than 24 when they began college. For all categories, we define age as of the end of the 2007 calendar year (December 31, 2007). Students with birthdates of December 31, 1987, or later were placed in the first category. Those with birthdates between December 31, 1983, and December 30, 1987, inclusive, were categorized in the second group (“between 20 and 24 years old”). Students with birthdates before December 31, 1983, were placed in the final category (“over 24 years old”).
CONCURRENT COMPLETION
For this report, we examined completion by first-time students at either two-year or four-year institutions. We defined completion as having obtained a degree or certificate at any institution within the six-year study period (i.e., by May 31, 2013). Clearinghouse data provide a unique headcount of U.S. college enrollments during each term, which allows for the tracking of individuals including those with concurrent completion. In preparing data for this report, a small number of individuals showed more than one completion awarded at multiple institutions on the same day. In these instances, a primary completion record was selected using decision rules specific to the sector of the student’s starting institution.
The first set of decision rules was applied to students with concurrent completions who started at a two-year institution:
- Concurrent Completions at Two Different Two-Year Institutions
- Same over different: Completions at the starting institution were selected over completionsat other institutions.
- Random selection: If the first decision rule did not result in a single completion record being selected, then a completion record was selected at random.
- Concurrent Completions at One Two-Year Institution and One Four-Year Institution
- Two-year then four-year: The two-year degree completion was considered the first completion and the four-year degree completion was considered a subsequent completion.
- Concurrent Completions at Two or More Four-Year Institutions
- Random selection: If a student started at a two-year institution but later completed at two or more four-year institutions concurrently, then a completion record was selected at random.
The second set of decision rules was applied to students who started at four-year institutions and later showed concurrent completion records:
- Same over different: Completions at the starting institution were selected over completions at other institutions.
- Four-year over two-year: If the first decision rule did not result in the selection of a single completion record, then completions at four-year institutions were selected over those at two-year institutions.
- Random selection: If neither of the first two decision rules resulted in the selection of a single completion record, then a completion record was selected at random.
IMPUTATION OF VALUES FOR GENDER
The Clearinghouse’s coverage of student gender has increased dramatically for enrollments occurring in recent years. However, imputation of gender for the majority of enrollment records is still necessary in order to use the data for research studies using older cohorts. To meet this need, the Research Center developed an imputation process based on first names. Previously submitted name‐gender pairs throughout the NSC database are used to determine the probability of any first name being associated with either gender. To increase the accuracy of the imputation process, the Research Center also draws on name‐gender data from the Social Security Administration (SSA) and the U.S. Census Bureau. Because the Clearinghouse collects transactional data, its data contain many more unique first names than the other sources. International students may also contribute to the large variety of first names submitted to the Clearinghouse. The imputation used only those pairs in which the name occurred in at least two instances and was associated with a single gender in at least 95 percent of the instances. The SSA and Census data sets were used to ensure that name‐gender pairs were consistent across every data set in which they occurred and to enhance the imputation process by contributing name‐gender pairs that did not occur in the Clearinghouse data.
Institutions reported student gender to the Clearinghouse for approximately 24 percent of all students included in this report. The imputation process yielded gender codes for an additional 68 percent of the cohort producing a total gender coverage rate of 92 percent.
IMPUTATION OF MISSING DATA ON GRADUATION RECORDS
The National Student Clearinghouse collects graduation information from its participating institutions via two data reporting services: Enrollment Reporting and DegreeVerify. Enrollment Reporting has higher data coverage rates, but includes only basic completion information such as graduation indicator and the date of graduation. For the fall 2007 cohort, Enrollment Reporting covered 91 percent of all the students in Title IV degree-granting institutions listed in IPEDS (including 94 percent of the students in public institutions, 89 percent in private nonprofit institutions, and 55 percent in private for-profit institutions). DegreeVerify includes enhanced information on completions, including degree title, major, level, and CIP code, but covered only 84 percent of enrollments in 2007. Institutions may participate either in Enrollment Reporting alone or in both services. Completions data for this report included information drawn from either service. An analysis conducted by the Clearinghouse on the 2007 cohort found that graduation data for the institutions that participated in DegreeVerify were relatively more complete for some of the years covered in this study than those for institutions that participated only in Enrollment Reporting, biasing completion rates slightly downwards for institutional sectors with lower participation rates in DegreeVerify.
In order to correct for this bias the Research Center conducted a randomized imputation procedure for missing graduation data among students at non-DegreeVerify institutions who were no longer enrolled, but for whom outcome data were missing (that is, for whom the institution had reported neither a graduation nor a withdrawal status in their Enrollment Reporting). This involved comparing the Enrollment Reporting and DegreeVerify records for institutions that participated in both services and estimating, for each institution type, the average percentage of students with missing outcomes in the enrollment data who had a reported graduation in the DegreeVerify data. We further specified these underreporting rates by taking into account student age and the academic year. We then used random assignment of graduation outcomes to students with missing data at the institutions that did not participate in DegreeVerify in order to match each institution’s underreporting rate for each student age group and for every year of the study to the average rate for similar students at institutions of the same type that did participate in DegreeVerify.
This imputation was performed only for students with missing outcomes data at institutions that did not participate in DegreeVerify. It is based on the typical underreporting of graduation outcomes from similar institutions that participate in both Enrollment Reporting and DegreeVerify. The table below shows, for each institution type, the percentage of the starting cohort for whom graduation data were imputed:
| Institution Type | Percentage of the Starting Cohort With an Imputed Completion |
| Two-Year Private For-Profit | 3.68% |
| Two-Year Private Nonprofit | 1.00% |
| Two-Year Public | 0.68% |
| Four-Year Private For-Profit | 0.75% |
| Four-Year Private Nonprofit | 1.23% |
| Four-Year Public | 0.44% |
| Total | 0.69% |
IMPUTATION OF MISSING DATA THROUGH WEIGHTING BY STATE AND INSTITUTION TYPE
The institutions participating in the Clearinghouse Enrollment Reporting service (i.e., providing the data coverage) is not 100 percent of all institutions for any individual year. Therefore, in order to account for possibilities of not capturing a student’s enrollment outcome due to non-coverage of Clearinghouse data, the analysis weights were calculated using 2011 coverage rate of the sector, control, and state of the institution where a student was enrolled for the last enrollment record. Last enrollment record was defined based on the first completion (for completers) or the last enrollment record either before stop-out (for students who had no enrollment records during the last year of the study) or before the end of the study period (for persisters). For students who completed a degree at the starting institution or were still enrolled at the starting institution by the end of the study period, a weight=1 was applied. For all other students, two weights were created and applied in this study:
For students who completed a degree or were still enrolled at a different institution by the end of the study period, a “transfer” weight was applied. The transfer weight used was an over-weight based on the coverage of the sector, control, and state of the institution in which the student was enrolled for the last enrollment record, as calculated by the formula provided below:

For students who stopped out by the end of the study period, a “missing” weight was applied. The missing weight used was an under-weight based on the coverage of the sector, control, and state of the institution in which the student was enrolled for the last enrollment record, as calculated by the formula provided below:

DATA LIMITATIONS
The data limitations in this report center mainly on the data coverage, the methods used for cohort identification, and the definition of key constructs, as outlined above.
The representation of private for-profit institutions in the StudentTracker data is lower than that of other institution types, with 66 percent coverage for private for-profit four-year institutions in fall 2007 compared to 90 percent and 96 percent respectively for private nonprofit four-year institutions and public four-year institutions. Despite the challenges presented by low participation in the early years covered in this report, current Clearinghouse data nevertheless offer near-census national coverage, representing more than 95 percent of U.S. postsecondary enrollments. In an effort to correct for coverage gaps, in this study, data were weighted, as explained above.
Data limitations resulting from the cohort identification methods used in preparing this report also should be noted. Because the Clearinghouse data on designations for class year are incomplete, the researchers identified first-time undergraduate students via two indirect measures:
- No previous college enrollments recorded in StudentTracker going back four years, and
- No previous degree awarded in the Clearinghouse’s historical DegreeVerify database.
Given these selection criteria, the sample for this report may include students who had more than 30 Advanced Placement (AP), International Baccalaureate (IB), or dual enrollment credits (students who are included in this study’s sample as first-time students but in fall 2007 they were enrolled in college courses while still in high school) and who would not be considered first-time students despite having first-time status. Moreover, because of inconsistencies in the historical depth of DegreeVerify database records, it is possible that a small number of graduate students are also included in the study cohort.
Finally, although Clearinghouse data contain some demographic information on students, historical coverage rates for the demographic data elements are uneven. Consequently, the results summarized in this report do not break enrollments out by race/ethnicity and results on gender are based partially on imputed values, as described above.
Appendix B: Coverage Tables
Table B1. National Student Clearinghouse Coverage of Enrollments by Institution Type and State (Title IV, Degree-Granting Non-Multistate Institutions, 2011 Fall)
| State | Four-Year Public | Two-Year Public | Four-Year Private Nonprofit | Two-Year Private Nonprofit | Four-Year Private For-Profit | Two-Year Private For-Profit |
| Alabama | 100.00% | 90.77% | 90.60% | – | 0.00% | 0.00% |
| Alaska | 100.00% | 65.55% | 100.00% | – | 0.00% | – |
| Arizona | 100.00% | 88.98% | 67.55% | – | 95.40% | 0.00% |
| Arkansas | 96.98% | 93.29% | 79.55% | – | – | – |
| California | 100.00% | 99.45% | 92.57% | 0.00% | 55.20% | 37.56% |
| Colorado | 97.26% | 100.00% | 96.40% | 0.00% | 16.02% | 0.00% |
| Connecticut | 98.55% | 100.00% | 89.71% | 100.00% | 0.00% | 0.00% |
| Delaware | 100.00% | 100.00% | 91.30% | 100.00% | – | – |
| District of Columbia | 100.00% | – | 99.34% | – | – | – |
| Florida | 99.66% | 95.52% | 82.32% | 0.00% | 48.90% | 21.01% |
| Georgia | 100.00% | 98.96% | 93.96% | 52.80% | 0.00% | 0.00% |
| Hawaii | 100.00% | 100.00% | 40.19% | – | 0.00% | – |
| Idaho | 100.00% | 100.00% | 93.20% | – | – | – |
| Illinois | 100.00% | 100.00% | 96.67% | 0.00% | 53.92% | 0.00% |
| Indiana | 100.00% | – | 93.54% | 100.00% | 0.00% | 0.00% |
| Iowa | 100.00% | 100.00% | 98.58% | 0.00% | 99.53% | – |
| Kansas | 99.05% | 86.73% | 66.21% | 0.00% | – | 0.00% |
| Kentucky | 100.00% | 100.00% | 86.69% | – | 77.31% | 54.85% |
| Louisiana | 97.82% | 64.62% | 99.07% | – | – | 10.22% |
| Maine | 100.00% | 96.70% | 99.48% | 0.00% | – | 0.00% |
| Maryland | 97.24% | 100.00% | 92.92% | – | – | 0.00% |
| Massachusetts | 99.03% | 100.00% | 97.66% | 25.69% | 31.61% | 0.00% |
| Michigan | 100.00% | 95.12% | 96.52% | – | – | – |
| Minnesota | 100.00% | 99.83% | 96.30% | 0.00% | 97.47% | 50.67% |
| Mississippi | 100.00% | 95.75% | 92.33% | – | – | 0.00% |
| Missouri | 100.00% | 100.00% | 91.74% | 24.98% | 0.00% | 18.95% |
| Montana | 100.00% | 82.89% | 74.71% | 0.00% | – | – |
| Nebraska | 100.00% | 99.64% | 98.11% | 0.00% | 0.00% | 0.00% |
| Nevada | 100.00% | 100.00% | 53.00% | – | – | 44.33% |
| New Hampshire | 100.00% | 100.00% | 96.60% | 0.00% | 100.00% | – |
| New Jersey | 100.00% | 100.00% | 90.13% | – | 100.00% | 0.00% |
| New Mexico | 93.30% | 94.59% | 44.11% | – | 100.00% | – |
| New York | 98.58% | 100.00% | 96.00% | 8.14% | 83.74% | 26.51% |
| North Carolina | 100.00% | 99.83% | 89.50% | 100.00% | 54.53% | 0.00% |
| North Dakota | 99.25% | 93.80% | 82.80% | 0.00% | – | – |
| Ohio | 100.00% | 100.00% | 95.84% | 19.55% | 100.00% | 5.01% |
| Oklahoma | 96.72% | 96.75% | 84.21% | – | 100.00% | 0.00% |
| Oregon | 100.00% | 100.00% | 91.99% | – | 0.00% | 0.00% |
| Pennsylvania | 100.00% | 100.00% | 98.43% | 66.83% | 6.46% | 18.94% |
| Rhode Island | 100.00% | 100.00% | 100.00% | – | – | – |
| South Carolina | 100.00% | 98.99% | 88.46% | 84.67% | 100.00% | 0.00% |
| South Dakota | 95.20% | 95.95% | 70.03% | 100.00% | – | – |
| Tennessee | 100.00% | 100.00% | 78.61% | 0.00% | 31.65% | 0.00% |
| Texas | 100.00% | 94.11% | 96.87% | 0.00% | 0.00% | 2.11% |
| Utah | 100.00% | 85.05% | 100.00% | 100.00% | 31.00% | 0.00% |
| Vermont | 100.00% | 100.00% | 97.93% | 100.00% | 0.00% | – |
| Virginia | 100.00% | 100.00% | 95.45% | – | 80.43% | 36.03% |
| Washington | 99.63% | 100.00% | 94.05% | 0.00% | 0.00% | 0.00% |
| West Virginia | 98.92% | 82.84% | 93.88% | – | 0.00% | 0.00% |
| Wisconsin | 100.00% | 100.00% | 94.48% | 100.00% | 0.00% | – |
| Wyoming | 100.00% | 100.00% | – | – | – | – |
Table B2. National Student Clearinghouse Coverage of Enrollment by Institution Type (Title IV Degree-Granting Multistate Institutions)
| Institution Type | Coverage Rate |
| Four-Year Public | – |
| Two-Year Public | – |
| Four-Year Private Nonprofit | 95.06% |
| Two-Year Private Nonprofit | – |
| Four-Year Private For-Profit | 70.69% |
| Two-Year Private For-Profit | 24.94% |
Appendix C: Results Tables
Table 1. Fall 2007 Cohort by Age at First Entry
| Age at First Entry | Unweighted Count | Percentage |
| Overall | 2,397,524 | 100.00 |
| 20 or Younger | 1,873,208 | 78.13 |
| >20-24 | 147,884 | 6.17 |
| Over Age 24 | 363,870 | 15.18 |
| Birthdate Missing | 12,562 | 0.52 |
Data in this table are displayed in the report in Figure 2.
Table 2. Fall 2007 Cohort by Enrollment Intensity
| Enrollment Intensity | Unweighted Count | Percentage |
| Overall | 2,397,524 | 100.00 |
| Exclusively Full-Time | 987,342 | 41.18 |
| Exclusively Part-Time | 152,673 | 6.37 |
| Mixed Enrollment | 1,257,509 | 52.45 |
Data in this table are displayed in the report in Figure 3.
Table 3. Fall 2007 Cohort by Age at First Entry and Enrollment Intensity
| Age at First Entry | Enrollment Intensity | Unweighted Count | Percentage of Age Group |
| 20 or Younger | Overall | 1,873,208 | 100.00 |
| Exclusively Full-Time | 832,089 | 44.42 | |
| Exclusively Part-Time | 49,038 | 2.62 | |
| Mixed Enrollment | 992,081 | 52.96 | |
| >20–24 | Overall | 147,884 | 100.00 |
| Exclusively Full-Time | 50,440 | 34.11 | |
| Exclusively Part-Time | 14,864 | 10.05 | |
| Mixed Enrollment | 82,580 | 55.84 | |
| Over Age 24 | Overall | 363,870 | 100.00 |
| Exclusively Full-Time | 100,155 | 27.52 | |
| Exclusively Part-Time | 86,456 | 23.76 | |
| Mixed Enrollment | 177,259 | 48.71 | |
| Age Missing | Overall | 12,562 | 100.0 |
| Exclusively Full-Time | 4,658 | 37.1 | |
| Exclusively Part-Time | 2,315 | 18.4 | |
| Mixed Enrollment | 5,589 | 44.5 |
Table 4. Fall 2007 Cohort by Gender
| Gender | Unweighted Count | Percentage |
| Overall | 2,215,171* | 100.00 |
| Men | 990,926 | 44.73 |
| Women | 1,224,245 | 55.26 |
Data in this table are displayed in the report in Figure 4. *The overall excludes students with gender data missing (7.61 percent of the cohort).
Table 5. Fall 2007 Cohort by Gender and Age at First Entry
| Gender | Age at First Entry | Unweighted Count | Percentage |
| Men | Overall | 990,926 | 100.00 |
| 20 or Younger | 788,899 | 79.61 | |
| >20–24 | 66,433 | 6.70 | |
| Over Age 24 | 130,720 | 13.19 | |
| Women | Overall | 1,224,245 | 100.00 |
| 20 or Younger | 954,723 | 77.98 | |
| >20–24 | 64,115 | 5.24 | |
| Over Age 24 | 199,771 | 16.32 |
Table 6. Fall 2007 Cohort by Starting Institution Type
| Institution Type | Unweighted Count | Percentage |
| Four-Year Public | 1,001,635 | 41.78 |
| Four-Year Private Nonprofit | 446,474 | 18.62 |
| Four-Year Private For-Profit | 79,750 | 3.33 |
| Two-Year Public | 862,551 | 35.98 |
| Two-Year Private Nonprofit | 2,708 | 0.11 |
| Two-Year Private For-Profit | 4,350 | 0.18 |
Data in this table are displayed in the report in Figure 1.
Table 7. Six-Year Outcomes by Enrollment Intensity (N=2,386,291)
| Enrollment Intensity | Total Completion Rate (%) | Completion at Same Institution (%) | Completion at Different Institution (%) | Still Enrolled (At Any Institution) (%) | Not Enrolled (At Any Institution) (%) | |
| Four-Year | Two-Year | |||||
| Overall | 56.05 | 42.95 | 9.81 | 3.29 | 15.33 | 28.62 |
| Exclusively Full-Time | 77.72 | 66.70 | 8.97 | 2.05 | 3.43 | 18.85 |
| Exclusively Part-Time | 21.84 | 18.48 | 1.33 | 2.04 | 11.03 | 67.13 |
| Mixed Enrollment | 43.17 | 27.27 | 11.49 | 4.41 | 25.17 | 31.66 |
Data in this table are displayed in the report in Figures 5 and 6.
Table 8. Six-Year Outcomes by Gender (N=2,205,243)
| Gender | Total Completion Rate (%) | Completion at Same Institution (%) | Completion at Different Institution (%) | Still Enrolled (At Any Institution) (%) | Not Enrolled (At Any Institution) (%) | |
| Four-Year | Two-Year | |||||
| Overall | 56.05 | 42.95 | 9.81 | 3.29 | 15.33 | 28.62 |
| Men | 52.80 | 40.78 | 9.00 | 3.02 | 16.27 | 30.93 |
| Women | 59.54 | 45.14 | 10.78 | 3.62 | 14.93 | 25.53 |
Data in this table are displayed in the report in Figure 7.
Table 9. Six-Year Outcomes by Age at First Entry (N=2,373,802)
| Age at First Entry | Total Completion Rate (%) | Completion at Same Institution (%) | Completion at Different Institution (%) | Still Enrolled (At Any Institution) (%) | Not Enrolled (At Any Institution) (%) | |
| Four-Year | Two-Year | |||||
| Overall | 56.05 | 42.95 | 9.81 | 3.29 | 15.33 | 28.62 |
| 20 or Younger | 59.79 | 45.04 | 11.23 | 3.52 | 15.88 | 24.33 |
| >20–24 | 40.85 | 32.41 | 5.37 | 3.07 | 16.35 | 42.80 |
| Over Age 24 | 43.51 | 36.74 | 4.52 | 2.25 | 12.55 | 43.94 |
Data in this table are displayed in the report in Figures 8 and 9.
Table 10. Six-Year Outcomes by Gender and Age at First Entry (N=2,194,795)
| Gender | Age Group | Total Completion Rate (%) | Completion at Same Institution (%) | Completion at Different Institution (%) | Still Enrolled (At Any Institution) (%) | Not Enrolled (At Any Institution) (%) | |
| Four-Year | Two-Year | ||||||
| Men | 20 or Younger | 55.59 | 42.42 | 10.05 | 3.12 | 17.15 | 27.25 |
| >20–24 | 39.21 | 30.81 | 5.47 | 2.94 | 15.66 | 45.13 | |
| Over Age 24 | 43.52 | 36.32 | 4.75 | 2.46 | 11.72 | 44.76 | |
| Women | 20 or Younger | 64.22 | 47.82 | 12.47 | 3.93 | 15.04 | 20.74 |
| >20–24 | 40.86 | 31.89 | 5.48 | 3.49 | 18.41 | 40.72 | |
| Over Age 24 | 43.45 | 36.71 | 4.52 | 2.22 | 13.69 | 42.87 | |
Data in this table are displayed in the report in Figure 10.
Table 11. Six-Year Outcomes by Age at First Entry and Enrollment Intensity (N=2,373,802)
| Age at First Entry | Enrollment Intensity | Total Completion Rate (%) | Completion at Same Institution (%) | Completion at Different Institution (%) | Still Enrolled (At Any Institution) (%) | Not Enrolled (At Any Institution) (%) | |
| Four-Year | Two-Year | ||||||
| 20 or Younger | Exclusively Full-Time | 80.96 | 68.87 | 9.92 | 2.16 | 3.40 | 15.64 |
| Exclusively Part-Time | 11.37 | 9.11 | 0.48 | 1.79 | 12.58 | 76.05 | |
| Mixed Enrollment | 44.40 | 26.82 | 12.85 | 4.73 | 26.49 | 29.11 | |
| >20–24 | Exclusively Full-Time | 58.94 | 51.68 | 5.42 | 1.84 | 4.30 | 36.76 |
| Exclusively Part-Time | 14.98 | 10.66 | 1.00 | 3.32 | 12.26 | 72.76 | |
| Mixed Enrollment | 34.44 | 24.55 | 6.12 | 3.77 | 24.40 | 41.16 | |
| Over Age 24 | Exclusively Full-Time | 60.99 | 56.77 | 3.00 | 1.22 | 3.38 | 35.64 |
| Exclusively Part-Time | 29.23 | 25.33 | 1.88 | 2.01 | 10.20 | 60.57 | |
| Mixed Enrollment | 40.73 | 31.13 | 6.65 | 2.95 | 18.81 | 40.46 | |
Data in this table are displayed in the report in Figure 11.
Table 12. Six-Year Outcomes of Men by Age at First Entry and Enrollment Intensity (N=981,074)
| Age at First Entry | Enrollment Intensity | Total Completion Rate (%) | Completion at Same Institution (%) | Completion at Different Institution (%) | Still Enrolled (At Any Institution) (%) | Not Enrolled (At Any Institution) (%) | |
| Four-Year | Two-Year | ||||||
| 20 or Younger | Exclusively Full-Time | 77.33 | 66.03 | 9.19 | 2.10 | 4.14 | 18.53 |
| Exclusively Part-Time | 9.97 | 8.19 | 0.31 | 1.46 | 12.06 | 77.97 | |
| Mixed Enrollment | 40.81 | 25.58 | 11.21 | 4.01 | 27.65 | 31.54 | |
| >20–24 | Exclusively Full-Time | 55.61 | 48.15 | 5.59 | 1.87 | 4.45 | 39.94 |
| Exclusively Part-Time | 12.84 | 8.69 | 0.81 | 3.34 | 10.47 | 76.69 | |
| Mixed Enrollment | 33.47 | 23.69 | 6.24 | 3.54 | 23.75 | 42.78 | |
| Over Age 24 | Exclusively Full-Time | 60.36 | 55.72 | 3.19 | 1.45 | 3.29 | 36.35 |
| Exclusively Part-Time | 28.38 | 23.59 | 1.93 | 2.86 | 9.56 | 62.05 | |
| Mixed Enrollment | 39.98 | 29.86 | 7.19 | 2.93 | 18.39 | 41.64 | |
Table 13. Six-Year Outcomes of Women by Age at First Entry and Enrollment Intensity (N=1,213,721)
| Age at First Entry | Enrollment Intensity | Total Completion Rate (%) | Completion at Same Institution (%) | Completion at Different Institution (%) | Still Enrolled (At Any Institution) (%) | Not Enrolled (At Any Institution) (%) | |
| Four-Year | Two-Year | ||||||
| 20 or Younger | Exclusively Full-Time | 84.67 | 71.75 | 10.68 | 2.25 | 2.84 | 12.49 |
| Exclusively Part-Time | 13.58 | 10.74 | 0.65 | 2.19 | 14.03 | 72.39 | |
| Mixed Enrollment | 48.35 | 28.27 | 14.58 | 5.50 | 25.89 | 25.76 | |
| >20–24 | Exclusively Full-Time | 61.03 | 53.33 | 5.63 | 2.07 | 4.32 | 34.65 |
| Exclusively Part-Time | 17.59 | 12.85 | 1.23 | 3.52 | 15.10 | 67.31 | |
| Mixed Enrollment | 34.44 | 24.05 | 6.16 | 4.23 | 26.36 | 39.20 | |
| Over Age 24 | Exclusively Full-Time | 61.74 | 57.70 | 2.88 | 1.16 | 3.34 | 34.93 |
| Exclusively Part-Time | 30.48 | 26.97 | 1.95 | 1.56 | 11.22 | 58.30 | |
| Mixed Enrollment | 40.92 | 31.36 | 6.52 | 3.04 | 19.77 | 39.31 | |
Table 14. Six-Year Outcomes by Starting Institution Type (N=2,386,235)
| Institution Type | Total Completion Rate (%) | Completion at Same Institution (%) | Completion at Different Institution (%) | Still Enrolled (At Any Institution) (%) | Not Enrolled (At Any Institution) (%) | |
| Four-Year | Two-Year | |||||
| Overall | 56.05 | 42.95 | 9.81 | 3.29 | 15.33 | 28.62 |
| Four-Year Public | 63.38 | 50.55 | 9.25 | 3.58 | 14.98 | 21.64 |
| Four-Year Private Nonprofit | 72.88 | 59.04 | 11.20 | 2.64 | 9.66 | 17.46 |
| Four-Year Private For-Profit | 42.32 | 33.46 | 6.57 | 2.29 | 13.42 | 44.26 |
| Two-Year Public | 39.87 | 26.46 | 10.04 | 3.37 | 18.89 | 41.24 |
| Two-YearPrivate Nonprofit | 52.78 | 36.25 | 11.53 | 4.99 | 14.92 | 32.30 |
| Two-YearPrivate For-Profit | 62.39 | 57.38 | 2.01 | 3.00 | 7.84 | 29.77 |
Data in this table are displayed in the report in Figures 12 and 13.
Table 15. Six-Year Outcomes for Students Who Started at Four-Year Public Institutions by Enrollment Intensity (N=1,002,788)
| Enrollment Intensity | Total Completion Rate (%) | Completion at Same Institution (%) | Completion at Different Institution (%) | Still Enrolled (At Any Institution) (%) | Not Enrolled (At Any Institution) (%) | |
| Four-Year | Two-Year | |||||
| Overall | 63.38 | 50.55 | 9.25 | 3.58 | 14.98 | 21.64 |
| Exclusively Full-Time | 82.34 | 71.95 | 8.21 | 2.18 | 3.82 | 13.84 |
| Exclusively Part-Time | 20.46 | 16.54 | 1.70 | 2.23 | 10.80 | 68.73 |
| Mixed Enrollment | 49.44 | 33.43 | 10.97 | 5.04 | 25.99 | 24.57 |
Data in this table are displayed in the report in Figure 14.
Table 16. Six-Year Outcomes for Students Who Started at Four-Year Public Institutions by Gender (N=925,438)
| Gender | Total Completion Rate (%) | Completion at Same Institution (%) | Completion at Different Institution (%) | Still Enrolled (At Any Institution) (%) | Not Enrolled (At Any Institution) (%) | |
| Four-Year | Two-Year | |||||
| Overall | 63.38 | 50.55 | 9.25 | 3.58 | 14.98 | 21.64 |
| Men | 59.50 | 48.15 | 8.14 | 3.21 | 16.48 | 24.01 |
| Women | 67.31 | 52.71 | 10.56 | 4.04 | 14.05 | 18.65 |
Data in this table are displayed in the report in Figure 15.
Table 17. Six-Year Outcomes for Students Who Started at Four-Year Public Institutions by Age at First Entry (N=997,543)
| Age at First Entry | Total Completion Rate | Completion at Same Institution (%) | Completion at Different Institution (%) | Still Enrolled (At Any Institution) (%) | Not Enrolled (At Any Institution) (%) | |
| Four-Year | Two-Year | |||||
| Overall | 63.38 | 50.55 | 9.25 | 3.58 | 14.98 | 21.64 |
| 20 or Younger | 65.86 | 52.00 | 10.08 | 3.78 | 15.34 | 18.80 |
| >20–24 | 53.75 | 45.57 | 4.87 | 3.31 | 14.19 | 32.06 |
| Over Age 24 | 46.98 | 40.95 | 4.09 | 1.95 | 12.78 | 40.24 |
Data in this table are displayed in the report in Figure 16.
Table 18. Six-Year Outcomes for Students Who Started at Four-Year Public Institutions by Gender and Age at First Entry (N=921,145)
| Gender | Age at First Entry | Total Completion Rate (%) | Completion at Same Institution (%) | Completion at Different Institution (%) | Still Enrolled (At Any Institution) (%) | Not Enrolled (At Any Institution) (%) | |
| Four-Year | Two-Year | ||||||
| Men | 20 or Younger | 61.58 | 49.45 | 8.79 | 3.35 | 17.07 | 21.35 |
| >20-24 | 50.04 | 42.00 | 4.84 | 3.20 | 14.85 | 35.11 | |
| Over Age 24 | 46.34 | 40.28 | 4.04 | 2.02 | 12.40 | 41.26 | |
| Women | 20 or Younger | 70.23 | 54.56 | 11.43 | 4.25 | 14.06 | 15.71 |
| >20-24 | 54.35 | 44.84 | 5.42 | 4.09 | 15.42 | 30.23 | |
| Over Age 24 | 45.38 | 38.83 | 4.45 | 2.10 | 14.13 | 40.49 | |
Data in this table are displayed in the report in Figure 17.
Table 19. Six-Year Outcomes for Students Who Started at Four-Year Public Institutions by Age at First Entry and Enrollment Intensity (N=997,543)
| Age at First Entry | Enrollment Intensity | Total Completion Rate (%) | Completion at Same Institution (%) | Completion at Different Institution (%) | Still Enrolled (At Any Institution) (%) | Not Enrolled (At Any Institution) (%) | |
| Four-Year | Two-Year | ||||||
| 20 or Younger | Exclusively Full-Time | 83.78 | 72.82 | 8.69 | 2.26 | 3.70 | 12.53 |
| Exclusively Part-Time | 5.71 | 2.40 | 0.67 | 2.64 | 11.91 | 82.38 | |
| Mixed Enrollment | 49.71 | 32.67 | 11.72 | 5.32 | 26.99 | 23.30 | |
| >20-24 | Exclusively Full-Time | 69.49 | 63.11 | 4.46 | 1.91 | 4.73 | 25.77 |
| Exclusively Part-Time | 16.15 | 8.58 | 1.78 | 5.79 | 11.47 | 72.39 | |
| Mixed Enrollment | 46.95 | 37.14 | 5.75 | 4.06 | 22.68 | 30.38 | |
| Over Age 24 | Exclusively Full-Time | 69.51 | 65.69 | 2.84 | 0.98 | 5.59 | 24.90 |
| Exclusively Part-Time | 27.13 | 23.31 | 2.12 | 1.70 | 10.71 | 62.16 | |
| Mixed Enrollment | 49.31 | 40.35 | 6.28 | 2.68 | 18.43 | 32.27 | |
Data in this table are displayed in the report in Figure 18.
Table 20. Six-Year Outcomes of Men Who Started at Four-Year Public Institutions by Age at First Entry and Enrollment Intensity (N=419,499)
| Age at First Entry | Enrollment Intensity | Total Completion Rate (%) | Completion at Same Institution (%) | Completion at Different Institution (%) | Still Enrolled (At Any Institution) (%) | Not Enrolled (At Any Institution) (%) | |
| Four-Year | Two-Year | ||||||
| 20 or Younger | Exclusively Full-Time | 80.41 | 70.37 | 7.86 | 2.18 | 4.54 | 15.05 |
| Exclusively Part-Time | 4.90 | 2.06 | 0.48 | 2.36 | 11.80 | 83.30 | |
| Mixed Enrollment | 46.30 | 32.05 | 9.84 | 4.41 | 28.41 | 25.29 | |
| >20-24 | Exclusively Full-Time | 65.27 | 58.53 | 4.87 | 1.88 | 5.12 | 29.60 |
| Exclusively Part-Time | 14.20 | 7.34 | 1.16 | 5.70 | 10.78 | 75.01 | |
| Mixed Enrollment | 44.16 | 34.86 | 5.48 | 3.81 | 23.46 | 32.38 | |
| Over Age 24 | Exclusively Full-Time | 68.07 | 64.36 | 2.87 | 0.83 | 5.68 | 26.25 |
| Exclusively Part-Time | 26.31 | 22.15 | 2.03 | 2.13 | 10.09 | 63.60 | |
| Mixed Enrollment | 47.54 | 38.48 | 6.34 | 2.72 | 18.55 | 33.92 | |
Table 21. Six-Year Outcomes of Women Who Started at Four-Year Public Institutions by Age at First Entry and Enrollment Intensity (N=501,646)
| Age at First Entry | Enrollment Intensity | Total Completion Rate (%) | Completion at Same Institution (%) | Completion at Different Institution (%) | Still Enrolled (At Any Institution) (%) | Not Enrolled (At Any Institution) (%) | |
| Four-Year | Two-Year | ||||||
| 20 or Younger | Exclusively Full-Time | 87.11 | 75.24 | 9.51 | 2.35 | 3.05 | 9.84 |
| Exclusively Part-Time | 6.73 | 2.83 | 0.83 | 3.07 | 12.98 | 80.29 | |
| Mixed Enrollment | 53.54 | 33.44 | 13.77 | 6.33 | 26.02 | 20.44 | |
| >20-24 | Exclusively Full-Time | 72.23 | 65.21 | 4.61 | 2.42 | 4.24 | 23.53 |
| Exclusively Part-Time | 18.06 | 9.00 | 2.46 | 6.60 | 13.75 | 68.19 | |
| Mixed Enrollment | 46.84 | 35.35 | 6.56 | 4.93 | 24.28 | 28.88 | |
| Over Age 24 | Exclusively Full-Time | 69.20 | 64.56 | 3.19 | 1.45 | 4.97 | 25.84 |
| Exclusively Part-Time | 28.21 | 24.41 | 2.32 | 1.48 | 12.01 | 59.78 | |
| Mixed Enrollment | 48.84 | 39.34 | 6.64 | 2.87 | 19.61 | 31.55 | |
Table 22. Six-Year Outcomes and First Completion for Students Who Started at Two-Year Public Institutions by Enrollment Intensity (N=857,607)
| Enrollment Intensity | Total Completion Rate (%) | 1st Completion at Same Institution (%) | 1st Completion at Different Institution (%) | Subsequent Completion at a Four-Year (%) | Total Four-Year Completion Rate (%) | Still Enrolled (At Any Institution) (%) | Not Enrolled (At Any Institution) (%) | |
| Two-Year | Four-Year | |||||||
| Overall | 39.87 | 26.46 | 3.37 | 10.04 | 7.14 | 17.18 | 18.89 | 41.24 |
| Exclusively Full-Time | 57.57 | 42.87 | 2.86 | 11.85 | 17.22 | 29.07 | 3.70 | 38.73 |
| Exclusively Part-Time | 19.92 | 17.66 | 1.54 | 0.73 | 1.86 | 2.58 | 11.77 | 68.31 |
| Mixed Enrollment | 36.47 | 21.99 | 3.79 | 10.69 | 4.37 | 15.06 | 25.11 | 38.42 |
Data in this table are displayed in the report in Figures 19 and 20.
Table 23. Six-Year Outcomes and First Completion for Students Who Started at Two-Year Public Institutions by Gender (N=790,662)
| Gender | Total Completion Rate(%) | 1st Completion at Same Institution (%) | 1st Completion at Different Institution (%) | Subsequent Completion at a Four-Year (%) | Total Four-Year Completion Rate (%) | Still Enrolled (At Any Institution) (%) | Not Enrolled (At Any Institution) (%) | |
| Two-Year | Four-Year | |||||||
| Overall | 39.87 | 26.46 | 3.37 | 10.04 | 7.14 | 17.18 | 18.89 | 41.24 |
| Men | 37.21 | 24.82 | 2.98 | 9.42 | 6.26 | 15.67 | 18.82 | 43.96 |
| Women | 43.23 | 28.63 | 3.78 | 10.82 | 8.18 | 19.00 | 19.46 | 37.31 |
Data in this table are displayed in the report in Figure 21.
Table 24. Six-Year Outcomes and First Completion for Students Who Started at Two-Year Public Institutions by Age at First Entry (N=851,583)
| Age at First Entry | Total Completion Rate(%) | 1st Completion at Same Institution (%) | 1st Completion at Different Institution (%) | Subsequent Completion at a Four-Year (%) | Total Four-Year Completion Rate (%) | Still Enrolled (At AnyInstitution) (%) | Not Enrolled (At Any Institution) (%) | |
| Two-Year | Four-Year | |||||||
| Overall | 39.87 | 26.46 | 3.37 | 10.04 | 7.14 | 17.18 | 18.89 | 41.24 |
| 20 or Younger | 41.79 | 26.03 | 3.65 | 12.10 | 8.30 | 20.40 | 20.45 | 37.77 |
| >20-24 | 29.25 | 20.85 | 2.89 | 5.51 | 3.98 | 9.48 | 18.79 | 51.96 |
| Over Age 24 | 37.47 | 30.40 | 2.55 | 4.52 | 3.84 | 8.37 | 13.54 | 48.99 |
Data in this table are displayed in the report in Figures 22 and 23.
Table 25. Six-Year Outcomes and First Completion for Students Who Started at Two-Year Public Institutions by Gender and Age at First Entry (N=785,609)
| Gender | Age at First Entry | Total Completion Rate (%) | 1st Completion at Same Institution (%) | 1st Completion at Different Institution (%) | Subsequent Completion at a Four-Year (%) | Total Four-Year Completion Rate (%) | Still Enrolled (At Any Institution) (%) | Not Enrolled (At Any Institution) (%) | |
| Two-Year | Four-Year | ||||||||
| Men | 20 or Younger | 38.31 | 24.16 | 3.16 | 10.98 | 7.01 | 17.99 | 20.62 | 41.08 |
| >20-24 | 28.64 | 20.43 | 2.62 | 5.60 | 3.79 | 9.39 | 16.99 | 54.37 | |
| Over Age 24 | 37.20 | 30.32 | 2.36 | 4.53 | 3.92 | 8.45 | 11.97 | 50.83 | |
| Women | 20 or Younger | 45.96 | 28.49 | 4.16 | 13.30 | 9.79 | 23.09 | 20.75 | 33.29 |
| >20-24 | 30.60 | 21.91 | 3.27 | 5.41 | 4.17 | 9.59 | 21.26 | 48.14 | |
| Over Age 24 | 38.76 | 31.34 | 2.71 | 4.71 | 4.00 | 8.71 | 14.92 | 46.32 | |
Data in this table are displayed in the report in Figure 24.
Table 26. Six-Year Outcomes and First Completion for Students Who Started at Two-Year Public Institutions by Age at First Entry and Enrollment Intensity (N=851,583)
| Age at First Entry | Enrollment Intensity | Total Completion Rate (%) | 1st Completion at Same Institution (%) | 1st Completion at Different Institution (%) | Subsequent Completion at a Four-Year (%) | Total Four-Year Completion Rate (%) | Still Enrolled (At Any Institution) (%) | Not Enrolled (At Any Institution) (%) | |
| Two-Year | Four-Year | ||||||||
| 20 or Younger | Exclusively Full-Time | 61.83 | 43.93 | 3.24 | 14.66 | 20.76 | 35.42 | 4.03 | 34.14 |
| Exclusively Part-Time | 13.50 | 11.68 | 1.46 | 0.36 | 1.67 | 2.03 | 13.00 | 73.50 | |
| Mixed Enrollment | 37.31 | 21.18 | 3.96 | 12.16 | 4.67 | 16.83 | 26.51 | 36.18 | |
| >20-24 | Exclusively Full-Time | 40.12 | 31.33 | 2.23 | 6.56 | 7.99 | 14.55 | 4.19 | 55.69 |
| Exclusively Part-Time | 13.32 | 11.27 | 1.62 | 0.43 | 0.99 | 1.41 | 12.96 | 73.72 | |
| Mixed Enrollment | 28.29 | 18.84 | 3.37 | 6.08 | 3.08 | 9.16 | 25.21 | 46.50 | |
| Over Age 24 | Exclusively Full-Time | 48.40 | 43.49 | 1.66 | 3.25 | 6.30 | 9.55 | 2.25 | 49.35 |
| Exclusively Part-Time | 28.13 | 25.34 | 1.61 | 1.18 | 2.28 | 3.45 | 10.45 | 61.43 | |
| Mixed Enrollment | 36.97 | 27.40 | 3.25 | 6.31 | 3.52 | 9.83 | 19.03 | 44.00 | |
Data in this table are displayed in the report in Figures 25 and 26.
Table 27. Overall Completion Rates of Men by Entering Age Group and Enrollment Intensity For Students Who Started at Two-Year Public Institutions (N=353,395)
| Age at First Entry | Enrollment Intensity | Total Completion Rate (%) | 1st Completion at Same Institution (%) | 1st Completion at Different Institution (%) | Subsequent Completion at a Four-Year (%) | Total Four-Year Completion Rate (%) | Still Enrolled (At Any Institution) (%) | Not Enrolled (At Any Institution) (%) | |
| Two-Year | Four-Year | ||||||||
| 20 or Younger | Exclusively Full-Time | 58.03 | 41.39 | 3.04 | 13.60 | 17.12 | 30.72 | 4.42 | 37.54 |
| Exclusively Part-Time | 11.94 | 10.59 | 1.14 | 0.21 | 1.30 | 1.50 | 12.34 | 75.72 | |
| Mixed Enrollment | 33.45 | 19.13 | 3.38 | 10.94 | 3.86 | 14.81 | 27.12 | 39.43 | |
| >20-24 | Exclusively Full-Time | 39.70 | 31.05 | 2.24 | 6.42 | 6.92 | 13.34 | 4.13 | 56.17 |
| Exclusively Part-Time | 11.03 | 9.41 | 1.37 | 0.25 | 0.99 | 1.23 | 10.24 | 78.73 | |
| Mixed Enrollment | 27.07 | 17.84 | 3.01 | 6.23 | 2.95 | 9.18 | 23.83 | 49.09 | |
| Over Age 24 | Exclusively Full-Time | 49.02 | 44.18 | 1.72 | 3.12 | 5.46 | 8.58 | 1.96 | 49.03 |
| Exclusively Part-Time | 26.24 | 23.55 | 1.66 | 1.03 | 2.16 | 3.18 | 9.35 | 64.41 | |
| Mixed Enrollment | 35.20 | 25.61 | 2.96 | 6.63 | 3.79 | 10.41 | 18.27 | 46.53 | |
Table 28. Overall Completion Rates of Women by Age at First Entry and Enrollment Intensity for Students Who Started at Two-Year Public Institutions (N=432,214)
| Age at First Entry | Enrollment Intensity | Total Completion Rate (%) | 1st Completion at Same Institution (%) | 1st Completion at Different Institution (%) | Subsequent Completion at a Four-Year (%) | Total Four-Year Completion Rate (%) | Still Enrolled (At Any Institution) (%) | Not Enrolled (At Any Institution) (%) | |
| Two-Year | Four-Year | ||||||||
| 20 or Younger | Exclusively Full-Time | 67.17 | 47.83 | 3.47 | 15.87 | 25.11 | 40.98 | 3.80 | 29.03 |
| Exclusively Part-Time | 16.00 | 13.63 | 1.83 | 0.54 | 2.19 | 2.72 | 14.57 | 69.44 | |
| Mixed Enrollment | 41.43 | 23.48 | 4.54 | 13.40 | 5.52 | 18.92 | 26.50 | 32.07 | |
| >20-24 | Exclusively Full-Time | 42.08 | 33.01 | 2.40 | 6.68 | 9.44 | 16.12 | 4.59 | 53.33 |
| Exclusively Part-Time | 16.24 | 13.65 | 1.95 | 0.64 | 1.14 | 1.78 | 16.18 | 67.58 | |
| Mixed Enrollment | 30.00 | 20.27 | 3.78 | 5.96 | 3.22 | 9.17 | 27.06 | 42.94 | |
| Over Age 24 | Exclusively Full-Time | 49.92 | 44.62 | 1.72 | 3.58 | 7.53 | 11.12 | 2.72 | 47.36 |
| Exclusively Part-Time | 30.40 | 27.41 | 1.65 | 1.34 | 2.55 | 3.88 | 11.39 | 58.21 | |
| Mixed Enrollment | 38.74 | 28.99 | 3.42 | 6.34 | 3.54 | 9.87 | 19.83 | 41.43 | |
Table 29. Six-Year Outcomes and First Completion for Non-Degree-Seeking Students Who Started at Two-Year Public Institutions by Enrollment Intensity (N=505,183)
| Enrollment Intensity | Total Completion Rate (%) | 1st Completion at Same Institution (%) | 1st Completion at Different Institution (%) | Subsequent Completion at a Four-Year (%) | Total Four-Year Completion Rate (%) | Still Enrolled (At Any Institution) (%) | Not Enrolled (At Any Institution) (%) | |
| Two-Year | Four-Year | |||||||
| Overall | 24.16 | 8.40 | 3.05 | 12.71 | 1.36 | 14.07 | 24.40 | 51.43 |
| Exclusively Full-Time | 6.42 | 2.65 | 3.03 | 0.73 | 0.34 | 1.07 | 9.44 | 84.14 |
| Exclusively Part-Time | 9.50 | 7.40 | 1.42 | 0.69 | 0.69 | 1.38 | 11.29 | 79.21 |
| Mixed Enrollment | 34.16 | 9.11 | 4.16 | 20.89 | 1.82 | 22.72 | 33.34 | 32.50 |
Table 30. Six-Year Outcomes and First Completion for Non-Degree-Seeking Students Who Started at Two-Year Public Institutions by Gender (N=464,736)
| Gender | Total Completion Rate (%) | 1st Completion at Same Institution (%) | 1st Completion at Different Institution (%) | Subsequent Completion at a Four-Year (%) | Total Four-Year Completion Rate (%) | Still Enrolled (At Any Institution) (%) | Not Enrolled (At Any Institution) (%) | |
| Two-Year | Four-Year | |||||||
| Overall | 24.16 | 8.40 | 3.05 | 12.71 | 1.36 | 14.07 | 24.40 | 51.43 |
| Men | 21.05 | 7.47 | 2.87 | 10.71 | 1.12 | 11.83 | 24.63 | 54.32 |
| Women | 27.74 | 9.53 | 3.31 | 14.90 | 1.66 | 16.56 | 25.24 | 47.02 |
Table 31. Six-Year Outcomes and First Completion for Non-Degree-Seeking Students Who Started at Two-Year Public Institutions by Age at First Entry (N=500,086)
| Age at First Entry | Total Completion Rate (%) | 1st Completion at Same Institution (%) | 1st Completion at Different Institution (%) | Subsequent Completion at a Four-Year (%) | Total Four-Year Completion Rate (%) | Still Enrolled (At Any Institution) (%) | Not Enrolled (At Any Institution) (%) | |
| Two-Year | Four-Year | |||||||
| Overall | 24.16 | 8.40 | 3.05 | 12.71 | 1.36 | 14.07 | 24.40 | 51.43 |
| 20 or Younger | 31.09 | 8.48 | 3.49 | 19.12 | 1.86 | 20.98 | 28.45 | 40.46 |
| >20-24 | 11.11 | 5.45 | 3.18 | 2.48 | 0.53 | 3.01 | 22.65 | 66.24 |
| Over Age 24 | 13.95 | 9.13 | 2.17 | 2.65 | 0.59 | 3.24 | 16.95 | 69.10 |
Table 32. Six-Year Outcomes and First Completion for Non-Degree-Seeking Students Who Started at Two-Year Public Institutions by Gender and Age at First Entry (N=460,304)
| Gender | Age at First Entry | Total Completion Rate (%) | 1st Completion at Same Institution (%) | 1st Completion at Different Institution (%) | Subsequent Completion at a Four-Year (%) | Total Four-Year Completion Rate (%) | Still Enrolled (At Any Institution) (%) | Not Enrolled (At Any Institution) (%) | |
| Two-Year | Four-Year | ||||||||
| Men | 20 or Younger | 26.17 | 7.43 | 3.03 | 15.71 | 1.41 | 17.12 | 28.83 | 45.01 |
| >20–24 | 10.11 | 4.90 | 3.06 | 2.15 | 0.54 | 2.69 | 21.14 | 68.76 | |
| Over Age 24 | 13.26 | 8.51 | 2.48 | 2.27 | 0.64 | 2.90 | 16.50 | 70.25 | |
| Women | 20 or Younger | 36.33 | 9.73 | 3.98 | 22.61 | 2.34 | 24.95 | 28.92 | 34.76 |
| >20–24 | 12.70 | 6.34 | 3.42 | 2.94 | 0.56 | 3.50 | 25.76 | 61.53 | |
| Over Age 24 | 15.00 | 9.90 | 2.05 | 3.05 | 0.60 | 3.65 | 18.33 | 66.67 | |
Table 33. Six-Year Outcomes and First Completion for Non-Degree-Seeking Students Who Started at Two-Year Public Institutions by Age at First Entry and Enrollment Intensity (N=500,086)
| Age at First Entry | Enrollment Intensity | Total Completion Rate (%) | 1st Completion at Same Institution (%) | 1st Completion at Different Institution (%) | Subsequent Completion at a Four-Year (%) | Total Four-Year Completion Rate (%) | Still Enrolled (At Any Institution) (%) | Not Enrolled (At Any Institution) (%) | |
| Two-Year | Four-Year | ||||||||
| 20 or Younger | Exclusively Full-Time | 6.38 | 2.04 | 4.03 | 0.30 | 0.58 | 0.89 | 8.29 | 85.34 |
| Exclusively Part-Time | 8.12 | 6.19 | 1.55 | 0.38 | 1.05 | 1.42 | 11.41 | 80.47 | |
| Mixed Enrollment | 38.49 | 9.22 | 4.11 | 25.16 | 2.12 | 27.28 | 33.95 | 27.56 | |
| >20-24 | Exclusively Full-Time | 7.77 | 2.31 | 5.00 | 0.46 | 0.00 | 0.46 | 14.84 | 77.39 |
| Exclusively Part-Time | 7.17 | 4.80 | 1.66 | 0.71 | 0.39 | 1.10 | 11.17 | 81.66 | |
| Mixed Enrollment | 15.67 | 6.23 | 4.90 | 4.54 | 0.70 | 5.24 | 35.93 | 48.41 | |
| Over Age 24 | Exclusively Full-Time | 6.14 | 3.62 | 1.12 | 1.40 | 0.18 | 1.58 | 9.03 | 84.83 |
| Exclusively Part-Time | 11.10 | 8.88 | 1.29 | 0.92 | 0.50 | 1.43 | 11.49 | 77.42 | |
| Mixed Enrollment | 20.37 | 9.74 | 4.15 | 6.48 | 0.80 | 7.28 | 29.15 | 50.48 | |
Table 34. Six-Year Outcomes and First Completion for Male Non-Degree-Seeking Students Who Started at Two-Year Public Institutions by Age at First Entry and Enrollment Intensity (N=207,531)
| Age at First Entry | Enrollment Intensity | Total Completion Rate (%) | 1st Completion at Same Institution (%) | 1st Completion at Different Institution (%) | Subsequent Completion at a Four-Year (%) | Total Four-Year Completion Rate (%) | Still Enrolled (At Any Institution) (%) | Not Enrolled (At Any Institution) (%) | |
| Two-Year | Four-Year | ||||||||
| 20 or Younger | Exclusively Full-Time | 3.69 | 1.66 | 2.03 | 0.00 | 0.00 | 0.00 | 6.24 | 90.06 |
| Exclusively Part-Time | 6.40 | 5.07 | 1.16 | 0.17 | 0.65 | 0.81 | 10.72 | 82.88 | |
| Mixed Enrollment | 33.61 | 8.33 | 3.73 | 21.55 | 1.70 | 23.26 | 35.65 | 30.74 | |
| >20-24 | Exclusively Full-Time | 5.87 | 1.08 | 4.79 | 0.00 | 0.00 | 0.00 | 12.23 | 81.90 |
| Exclusively Part-Time | 6.33 | 4.27 | 1.60 | 0.46 | 0.36 | 0.82 | 10.35 | 83.32 | |
| Mixed Enrollment | 14.92 | 5.74 | 4.88 | 4.30 | 0.78 | 5.08 | 34.86 | 50.23 | |
| Over Age 24 | Exclusively Full-Time | 6.82 | 3.57 | 1.09 | 2.16 | 0.51 | 2.67 | 11.92 | 81.26 |
| Exclusively Part-Time | 10.93 | 8.56 | 1.59 | 0.78 | 0.58 | 1.36 | 11.77 | 77.30 | |
| Mixed Enrollment | 19.32 | 8.46 | 4.78 | 6.08 | 0.78 | 6.86 | 28.67 | 52.01 | |
Table 35. Six-Year Outcomes and First Completion for Female Non-Degree-Seeking Students Who Started at Two-Year Public Institutions by Age at First Entry and Enrollment Intensity (N=252,773)
| Age at First Entry | Enrollment Intensity | Total Completion Rate (%) | 1st Completion at Same Institution (%) | 1st Completion at Different Institution (%) | Subsequent Completion at a Four-Year (%) | Total Four-Year Completion Rate (%) | Still Enrolled (At Any Institution) (%) | Not Enrolled (At Any Institution) (%) | |
| Two-Year | Four-Year | ||||||||
| 20 or Younger | Exclusively Full-Time | 7.64 | 2.33 | 4.62 | 0.69 | 1.00 | 1.69 | 9.54 | 82.82 |
| Exclusively Part-Time | 10.64 | 8.00 | 1.99 | 0.65 | 1.60 | 2.25 | 12.94 | 76.42 | |
| Mixed Enrollment | 43.08 | 10.20 | 4.50 | 28.38 | 2.54 | 30.92 | 33.12 | 23.80 | |
| >20-24 | Exclusively Full-Time | 10.90 | 3.83 | 6.11 | 0.96 | 0.00 | 0.96 | 15.11 | 73.99 |
| Exclusively Part-Time | 8.54 | 5.68 | 1.83 | 1.03 | 0.44 | 1.46 | 13.15 | 78.31 | |
| Mixed Enrollment | 16.85 | 7.02 | 4.96 | 4.87 | 0.69 | 5.56 | 38.39 | 44.76 | |
| Over Age 24 | Exclusively Full-Time | 5.71 | 3.11 | 1.40 | 1.20 | 0.00 | 1.20 | 8.80 | 85.49 |
| Exclusively Part-Time | 11.66 | 9.49 | 1.12 | 1.06 | 0.48 | 1.54 | 12.16 | 76.17 | |
| Mixed Enrollment | 21.63 | 10.78 | 3.88 | 6.97 | 0.85 | 7.82 | 30.53 | 47.84 | |
Table 36. Six-Year Outcomes for Students Who Started at Four-Year Private Nonprofit Institutions by Enrollment Intensity (N=446,378)
| Enrollment Intensity | Total Completion Rate (%) | Completion at Same Institution (%) | Completion at Different Institution (%) | Still Enrolled (At Any Institution) (%) | Not Enrolled (At Any Institution) (%) | |
| Four-Year | Two-Year | |||||
| Overall | 72.88 | 59.04 | 11.20 | 2.64 | 9.66 | 17.46 |
| Exclusively Full-Time | 86.18 | 76.08 | 8.75 | 1.35 | 2.60 | 11.22 |
| Exclusively Part-Time | 32.72 | 26.47 | 2.38 | 3.86 | 8.96 | 58.32 |
| MixedEnrollment | 52.35 | 30.37 | 17.03 | 4.95 | 23.34 | 24.31 |
Data in this table are displayed in the report in Figure 27.
Table 37. Six-Year Outcomes for Students Who Started at Four-Year Private Nonprofit Institutions by Gender (N=414,073)
| Gender | Total Completion Rate (%) | Completion at Same Institution (%) | Completion at Different Institution (%) | Still Enrolled (At Any Institution) (%) | Not Enrolled (At Any Institution) (%) | |
| Four-Year | Two-Year | |||||
| Overall | 72.88 | 59.04 | 11.20 | 2.64 | 9.66 | 17.46 |
| Men | 69.44 | 56.44 | 10.31 | 2.69 | 11.22 | 19.35 |
| Women | 76.06 | 61.08 | 12.28 | 2.71 | 8.68 | 15.26 |
Data in this table are displayed in the report in Figure 28.
Table 38. Six-Year Outcomes for Students Who Started at Four-Year Private Nonprofit Institutions by Age at First Entry (N=445,264)
| Age at First Entry | Total Completion Rate (%) | Completion at Same Institution (%) | Completion at Different Institution (%) | Still Enrolled (At Any Institution) (%) | Not Enrolled (At Any Institution) (%) | |
| Four-Year | Two-Year | |||||
| Overall | 72.88 | 59.04 | 11.20 | 2.64 | 9.66 | 17.46 |
| 20 or Younger | 76.07 | 61.05 | 12.36 | 2.66 | 9.59 | 14.33 |
| >20-24 | 60.89 | 51.51 | 6.36 | 3.02 | 10.46 | 28.65 |
| Over Age 24 | 54.53 | 47.58 | 4.58 | 2.37 | 10.02 | 35.46 |
Data in this table are displayed in the report in Figure 29.
Table 39. Six-Year Outcomes for Students Who Started at Four-Year Private Nonprofit Institutions by Gender and Age at First Entry (N=413,060)
| Gender | Age at First Entry | Total Completion Rate (%) | Completion at Same Institution (%) | Completion at Different Institution (%) | Still Enrolled (At Any Institution) (%) | Not Enrolled (At Any Institution) (%) | |
| Four-Year | Two-Year | ||||||
| Men | 20 or Younger | 72.05 | 58.34 | 11.20 | 2.51 | 11.37 | 16.58 |
| >20-24 | 56.71 | 47.11 | 6.15 | 3.45 | 11.61 | 31.68 | |
| Over Age 24 | 55.13 | 46.04 | 5.28 | 3.80 | 10.02 | 34.85 | |
| Women | 20 or Younger | 79.71 | 63.30 | 13.55 | 2.86 | 8.33 | 11.96 |
| >20-24 | 62.96 | 52.39 | 7.43 | 3.14 | 10.85 | 26.20 | |
| Over Age 24 | 52.79 | 47.10 | 4.20 | 1.49 | 10.88 | 36.33 | |
Data in this table are displayed in the report in Figure 30.
Table 40. Six-Year Outcomes for Students Who Started at Four-Year Private Nonprofit Institutions by Age at First Entry and Enrollment Intensity (N=445,264)
| Age at First Entry | Enrollment Intensity | Total Completion Rate (%) | Completion at Same Institution (%) | Completion at Different Institution (%) | Still Enrolled (At Any Institution) (%) | Not Enrolled (At Any Institution) (%) | |
| Four-Year | Two-Year | ||||||
| 20 or Younger | Exclusively Full-Time | 87.53 | 77.00 | 9.14 | 1.39 | 2.54 | 9.93 |
| Exclusively Part-Time | 7.59 | 3.20 | 1.63 | 2.76 | 9.40 | 83.01 | |
| Mixed Enrollment | 52.27 | 27.38 | 19.48 | 5.41 | 24.82 | 22.91 | |
| >20-24 | Exclusively Full-Time | 73.44 | 66.56 | 5.85 | 1.03 | 3.33 | 23.23 |
| Exclusively Part-Time | 24.85 | 13.10 | 2.65 | 9.09 | 10.43 | 64.73 | |
| Mixed Enrollment | 46.59 | 33.55 | 7.82 | 5.21 | 22.08 | 31.32 | |
| Over Age 24 | Exclusively Full-Time | 72.56 | 67.32 | 4.26 | 0.98 | 3.17 | 24.27 |
| Exclusively Part-Time | 36.42 | 30.26 | 2.46 | 3.70 | 8.95 | 54.64 | |
| Mixed Enrollment | 54.91 | 46.18 | 6.34 | 2.39 | 15.64 | 29.44 | |
Data in this table are displayed in the report in Figure 31.
Table 41. Overall Completion Rates of Men Who Started at Four-Year Private Nonprofit Institutions by Age at First Entry and Enrollment Intensity (N=180,123)
| Age at First Entry | Enrollment Intensity | Total Completion Rate (%) | Completion at Same Institution (%) | Completion at Different Institution (%) | Still Enrolled (At Any Institution) (%) | Not Enrolled (At Any Institution) (%) | |
| Four-Year | Two-Year | ||||||
| 20 or Younger | Exclusively Full-Time | 85.16 | 75.50 | 8.31 | 1.35 | 3.28 | 11.56 |
| Exclusively Part-Time | 6.39 | 2.47 | 1.38 | 2.54 | 9.02 | 84.59 | |
| Mixed Enrollment | 47.57 | 25.87 | 16.94 | 4.75 | 27.09 | 25.34 | |
| >20-24 | Exclusively Full-Time | 69.60 | 62.99 | 5.51 | 1.10 | 3.56 | 26.84 |
| Exclusively Part-Time | 23.07 | 10.30 | 3.28 | 9.49 | 11.60 | 65.33 | |
| Mixed Enrollment | 44.22 | 30.94 | 7.55 | 5.73 | 22.98 | 32.80 | |
| Over Age 24 | Exclusively Full-Time | 71.99 | 65.32 | 5.01 | 1.66 | 3.31 | 24.69 |
| Exclusively Part-Time | 38.47 | 28.94 | 2.59 | 6.95 | 8.97 | 52.56 | |
| Mixed Enrollment | 54.37 | 43.75 | 7.48 | 3.15 | 15.98 | 29.65 | |
Table 42. Overall Completion Rates of Women Who Started at Four-Year Private Nonprofit Institutions by Age at First Entry and Enrollment Intensity (N=232,937)
| Age at First Entry | Enrollment Intensity | Total Completion Rate (%) | Completion at Same Institution (%) | Completion at Different Institution (%) | Still Enrolled (At Any Institution) (%) | Not Enrolled (At Any Institution) (%) | |
| Four-Year | Two-Year | ||||||
| 20 or Younger | Exclusively Full-Time | 89.77 | 78.38 | 9.93 | 1.46 | 2.00 | 8.23 |
| Exclusively Part-Time | 9.52 | 4.32 | 1.80 | 3.41 | 10.77 | 79.70 | |
| Mixed Enrollment | 56.99 | 28.68 | 22.19 | 6.13 | 23.15 | 19.86 | |
| >20-24 | Exclusively Full-Time | 76.48 | 68.21 | 7.11 | 1.17 | 3.27 | 20.25 |
| Exclusively Part-Time | 27.13 | 15.96 | 2.29 | 8.88 | 10.55 | 62.33 | |
| Mixed Enrollment | 46.62 | 32.30 | 8.90 | 5.42 | 23.70 | 29.68 | |
| Over Age 24 | Exclusively Full-Time | 72.12 | 67.87 | 3.66 | 0.60 | 3.07 | 24.81 |
| Exclusively Part-Time | 34.89 | 30.90 | 2.39 | 1.59 | 9.74 | 55.37 | |
| Mixed Enrollment | 54.52 | 46.75 | 5.84 | 1.93 | 16.27 | 29.21 | |
Table 43. Six-Year Outcomes for Students Who Started at Four-Year Private For-Profit Institutions by Enrollment Intensity (N=72,922)
| Enrollment Intensity | Total Completion Rate (%) | Completion at Same Institution (%) | Completion at Different Institution (%) | Still Enrolled (At Any Institution) (%) | Not Enrolled (At Any Institution) (%) | |
| Four-Year | Two-Year | |||||
| Overall | 42.32 | 33.46 | 6.57 | 2.29 | 13.42 | 44.26 |
| Exclusively Full-Time | 61.85 | 56.55 | 4.14 | 1.16 | 3.47 | 34.68 |
| Exclusively Part-Time | 22.75 | 18.13 | 3.20 | 1.42 | 9.69 | 67.55 |
| Mixed Enrollment | 28.13 | 15.38 | 9.31 | 3.44 | 22.93 | 48.94 |
Data in this table are displayed in the report in Figure 32.
Table 44. Six-Year Outcomes for Students Who Started at Four-Year Private For-Profit Institutions By Gender (N=69,102)
| Gender | Total Completion Rate (%) | Completion at Same Institution (%) | Completion at Different Institution (%) | Still Enrolled (At Any Institution) (%) | Not Enrolled (At Any Institution) (%) | |
| Four-Year | Two-Year | |||||
| Overall | 42.32 | 33.46 | 6.57 | 2.29 | 13.42 | 44.26 |
| Men | 41.42 | 30.43 | 8.42 | 2.57 | 13.21 | 45.37 |
| Women | 43.87 | 36.54 | 5.20 | 2.12 | 13.79 | 42.34 |
Data in this table are displayed in the report in Figure 33.
Table 45. Six-Year Outcomes for Students Who Started at Four-Year Private For-Profit Institutions by Age at First Entry (N=72,890)
| Age at First Entry | Total Completion Rate (%) | Completion at Same Institution (%) | Completion at Different Institution (%) | Still Enrolled (At Any Institution) (%) | Not Enrolled (At Any Institution) (%) | |
| Four-Year | Two-Year | |||||
| Overall | 42.32 | 33.46 | 6.57 | 2.29 | 13.42 | 44.26 |
| 20 or Younger | 42.25 | 23.94 | 14.47 | 3.83 | 16.73 | 41.03 |
| >20-24 | 30.79 | 22.46 | 4.80 | 3.53 | 19.25 | 49.96 |
| Over Age 24 | 44.12 | 37.13 | 5.21 | 1.78 | 11.84 | 44.04 |
Data in this table are displayed in the report in Figure 34.
Table 46. Six-Year Outcomes for Students Who Started at Four-Year Private For-Profit Institutions by Gender and Age at First Entry (N=69,073)
| Gender | Age at First Entry | Total Completion Rate (%) | Completion at Same Institution (%) | Completion at Different Institution (%) | Still Enrolled (At Any Institution) (%) | Not Enrolled (At Any Institution) (%) | |
| Four-Year | Two-Year | ||||||
| Men | 20 or Younger | 40.17 | 19.37 | 17.28 | 3.52 | 16.22 | 43.61 |
| >20-24 | 29.05 | 18.92 | 6.77 | 3.36 | 18.50 | 52.45 | |
| Over Age 24 | 43.76 | 35.29 | 6.28 | 2.19 | 11.55 | 44.69 | |
| Women | 20 or Younger | 44.37 | 28.45 | 11.71 | 4.20 | 17.91 | 37.72 |
| >20-24 | 32.73 | 25.62 | 3.56 | 3.55 | 20.29 | 46.98 | |
| Over Age 24 | 45.42 | 39.44 | 4.41 | 1.58 | 12.18 | 42.39 | |
Data in this table are displayed in the report in Figure 35.
Table 47. Six-Year Outcomes for Students Who Started at Four-Year Private For-Profit Institutions by Age at First Entry and Enrollment Intensity (N=72,890)
| Age at First Entry | Enrollment Intensity | Total Completion Rate (%) | Completion at Same Institution (%) | Completion at Different Institution (%) | Still Enrolled (At Any Institution) (%) | Not Enrolled (At Any Institution) (%) | |
| Four-Year | Two-Year | ||||||
| 20 or Younger | Exclusively Full-Time | 63.36 | 42.00 | 19.49 | 1.87 | 3.98 | 32.66 |
| Exclusively Part-Time | 8.01 | 6.12 | 0.42 | 1.47 | 10.36 | 81.63 | |
| Mixed Enrollment | 34.48 | 16.30 | 13.14 | 5.04 | 23.78 | 41.74 | |
| >20-24 | Exclusively Full-Time | 50.15 | 45.04 | 3.18 | 1.93 | 5.89 | 43.97 |
| Exclusively Part-Time | 11.66 | 7.57 | 1.68 | 2.40 | 10.59 | 77.75 | |
| Mixed Enrollment | 21.63 | 10.95 | 6.09 | 4.59 | 27.99 | 50.38 | |
| Over Age 24 | Exclusively Full-Time | 62.95 | 59.88 | 2.10 | 0.97 | 3.13 | 33.92 |
| Exclusively Part-Time | 25.91 | 20.87 | 3.73 | 1.31 | 9.51 | 64.58 | |
| Mixed Enrollment | 27.62 | 16.03 | 8.86 | 2.74 | 21.65 | 50.74 | |
Data in this table are displayed in the report in Figure 36.
Table 48. Six-Year Outcomes for Men Who Started at Four-Year Private For-Profit Institutions by Age at First Entry and Enrollment Intensity (N=25,347)
| Age at First Entry | Enrollment Intensity | Total Completion Rate (%) | Completion at Same Institution (%) | Completion at Different Institution (%) | Still Enrolled (At Any Institution) (%) | Not Enrolled (At Any Institution) (%) | |
| Four-Year | Two-Year | ||||||
| 20 or Younger | Exclusively Full-Time | 60.20 | 34.02 | 24.83 | 1.35 | 4.00 | 35.79 |
| Exclusively Part-Time | 3.64 | 2.91 | 0.41 | 0.33 | 9.60 | 86.76 | |
| Mixed Enrollment | 34.79 | 14.41 | 15.57 | 4.82 | 22.39 | 42.82 | |
| >20-24 | Exclusively Full-Time | 46.79 | 40.05 | 4.42 | 2.32 | 5.85 | 47.36 |
| Exclusively Part-Time | 6.59 | 3.75 | 1.37 | 1.48 | 9.39 | 84.01 | |
| Mixed Enrollment | 23.03 | 10.14 | 8.73 | 4.16 | 26.28 | 50.69 | |
| Over Age 24 | Exclusively Full-Time | 62.70 | 58.76 | 2.41 | 1.52 | 2.95 | 34.36 |
| Exclusively Part-Time | 21.32 | 14.53 | 5.05 | 1.74 | 9.56 | 69.12 | |
| Mixed Enrollment | 28.80 | 15.31 | 10.52 | 2.98 | 20.84 | 50.36 | |
Table 49. Six-Year Outcomes for Women Who Started at Four-Year Private For-Profit Institutions by Age at First Entry and Enrollment Intensity (N=43,726)
| Age at First Entry | Enrollment Intensity | Total Completion Rate (%) | Completion at Same Institution (%) | Completion at Different Institution (%) | Still Enrolled (At Any Institution) (%) | Not Enrolled (At Any Institution) (%) | |
| Four-Year | Two-Year | ||||||
| 20 or Younger | Exclusively Full-Time | 65.67 | 47.90 | 15.54 | 2.23 | 4.35 | 29.98 |
| Exclusively Part-Time | 15.35 | 11.78 | 0.58 | 2.99 | 12.17 | 72.48 | |
| Mixed Enrollment | 33.58 | 17.92 | 10.18 | 5.48 | 26.46 | 39.97 | |
| >20-24 | Exclusively Full-Time | 53.24 | 49.23 | 2.40 | 1.62 | 6.11 | 40.65 |
| Exclusively Part-Time | 16.57 | 11.33 | 2.36 | 2.88 | 13.66 | 69.77 | |
| Mixed Enrollment | 20.85 | 11.57 | 4.41 | 4.86 | 30.06 | 49.09 | |
| Over Age 24 | Exclusively Full-Time | 64.48 | 61.99 | 1.79 | 0.71 | 3.23 | 32.28 |
| Exclusively Part-Time | 29.16 | 24.92 | 3.23 | 1.01 | 10.15 | 60.69 | |
| Mixed Enrollment | 26.43 | 16.10 | 7.65 | 2.68 | 22.88 | 50.69 | |
Table 50. Completion Rates at Different Institutions Across State Lines by Enrollment Intensity (N=2,315,081)
| Enrollment Intensity | Total Completion Rate (%) | Completion at Same Institution (%) | Completion at Different Institution, In-State (%) | Completion at Different Institution, Out-Of-State (%) | Completion at Different Institution, Multiple State (%) | |||
| Four-Year | Two-Year | Four-Year | Two-Year | Four-Year | Two-Year | |||
| Overall | 56.34 | 43.15 | 6.64 | 2.47 | 2.94 | 0.70 | 0.32 | 0.13 |
| Exclusively Full-Time | 78.07 | 66.87 | 5.78 | 1.54 | 3.15 | 0.45 | 0.19 | 0.08 |
| Exclusively Part-Time | 21.76 | 18.56 | 0.71 | 1.06 | 0.40 | 0.79 | 0.13 | 0.12 |
| Mixed Enrollment | 43.57 | 27.64 | 8.01 | 3.36 | 3.07 | 0.88 | 0.44 | 0.17 |
Note: Students who started at multistate institutions are not included in the rates presented in this table. Data in this table are displayed in the report in Figure 37.
Table 51. Completion Rates at Different Institutions Across State Lines by Gender (N=2,137,941)
| Gender | Total Completion Rate (%) | Completion at Same Institution (%) | Completion at Different Institution, In-State (%) | Completion at Different Institution, Out-Of-State (%) | Completion at Different Institution, Multiple State (%) | |||
| Four-Year | Two-Year | Four-Year | Two-Year | Four-Year | Two-Year | |||
| Overall | 56.34 | 43.15 | 6.24 | 2.33 | 2.77 | 0.66 | 0.30 | 0.12 |
| Men | 52.97 | 40.97 | 5.99 | 2.19 | 2.77 | 0.73 | 0.25 | 0.08 |
| Women | 59.95 | 45.34 | 7.38 | 2.79 | 3.19 | 0.70 | 0.39 | 0.17 |
Note: Students who started at multistate institutions are not included in the rates presented in this table. Data in this table are displayed in the report in Figure 38.
Table 52. Completion Rates at Different Institutions Across State Lines by Age at First Entry (N=2,302,632)
| Age at First Entry | Total Completion Rate (%) | Completion at Same Institution (%) | Completion at Different Institution, In-State (%) | Completion at Different Institution, Out-Of-State (%) | Completion at Different Institution, Multiple State (%) | |||
| Four-Year | Two-Year | Four-Year | Two-Year | Four-Year | Two-Year | |||
| Overall | 56.34 | 43.15 | 6.64 | 2.47 | 2.94 | 0.70 | 0.32 | 0.13 |
| 20 or Younger | 59.82 | 45.09 | 7.60 | 2.70 | 3.36 | 0.68 | 0.27 | 0.14 |
| >20-24 | 41.33 | 32.96 | 3.40 | 1.86 | 1.59 | 0.96 | 0.39 | 0.17 |
| Over Age 24 | 43.23 | 36.66 | 2.62 | 1.44 | 1.12 | 0.73 | 0.59 | 0.08 |
Note: Students who started at multistate institutions are not included in the rates presented in this table. Data in this table are displayed in the report in Figure 39.
Table 53. Completion Rates at Different Institutions Across State Lines by Gender and Age at First Entry (N=2,127,531)
| Gender | Age at First Entry | Total Completion Rate (%) | Completion at Same Institution (%) | Completion at Different Institution, In-State (%) | Completion at Different Institution, Out-Of-State (%) | Completion at Different Institution, Multiple State (%) | |||
| Four-Year | Two-Year | Four-Year | Two-Year | Four-Year | Two-Year | ||||
| Men | 20 or Younger | 55.60 | 42.47 | 6.72 | 2.37 | 3.08 | 0.66 | 0.21 | 0.08 |
| >20-24 | 39.55 | 31.30 | 3.40 | 1.70 | 1.67 | 1.05 | 0.33 | 0.09 | |
| Over Age 24 | 43.28 | 36.54 | 2.56 | 1.23 | 1.35 | 1.07 | 0.49 | 0.05 | |
| Women | 20 or Younger | 64.26 | 47.85 | 8.48 | 3.04 | 3.69 | 0.71 | 0.32 | 0.18 |
| >20-24 | 41.45 | 32.38 | 3.50 | 2.22 | 1.57 | 0.97 | 0.54 | 0.27 | |
| Over Age 24 | 42.90 | 36.11 | 2.77 | 1.64 | 1.01 | 0.56 | 0.73 | 0.09 | |
Data in this table are displayed in the report in Figure 40.
Table 54. Completion Rates at Different Institutions Across State Lines by Age at First Entry and Enrollment Intensity (N=2,302,632)
| Age at First Entry | Enrollment Intensity | Total Completion Rate (%) | Completion at Same Institution (%) | Completion at Different Institution, In-State (%) | Completion at Different Institution,Out-Of-State (%) | Completion at Different Institution, Multiple State (%) | |||
| Four-Year | Two-Year | Four-Year | Two-Year | Four-Year | Two-Year | ||||
| 20 or Younger | Exclusively Full-Time | 80.98 | 68.90 | 6.29 | 1.63 | 3.45 | 0.45 | 0.17 | 0.08 |
| Exclusively Part-Time | 11.44 | 9.19 | 0.20 | 1.19 | 0.18 | 0.32 | 0.10 | 0.26 | |
| Mixed Enrollment | 44.46 | 26.90 | 9.04 | 3.67 | 3.44 | 0.88 | 0.35 | 0.17 | |
| >20-24 | Exclusively Full-Time | 59.26 | 51.90 | 3.32 | 1.22 | 1.94 | 0.46 | 0.30 | 0.14 |
| Exclusively Part-Time | 15.02 | 10.82 | 0.56 | 1.49 | 0.29 | 1.62 | 0.12 | 0.11 | |
| Mixed Enrollment | 35.20 | 25.45 | 3.97 | 2.32 | 1.60 | 1.15 | 0.50 | 0.21 | |
| Over Age 24 | Exclusively Full-Time | 59.62 | 55.15 | 2.06 | 0.82 | 0.81 | 0.36 | 0.35 | 0.07 |
| Exclusively Part-Time | 29.27 | 25.63 | 1.04 | 0.93 | 0.55 | 0.94 | 0.14 | 0.03 | |
| Mixed Enrollment | 42.67 | 33.52 | 3.72 | 2.00 | 1.57 | 0.80 | 0.94 | 0.10 | |
Data in this table are displayed in the report in Figure 41.
Table 55. Completion Rates for Men at Different Institutions Across State Lines by Age at First Entry and Enrollment Intensity (N=953,198)
| Age at First Entry | Enrollment Intensity | Total Completion Rate (%) | Completion at Same Institution (%) | Completion at Different Institution, In-State (%) | Completion at Different Institution, Out-Of-State (%) | Completion at Different Institution, Multiple State (%) | |||
| Four-Year | Two-Year | Four-Year | Two-Year | Four-Year | Two-Year | ||||
| 20 or Younger | Exclusively Full-Time | 77.31 | 66.06 | 5.78 | 1.55 | 3.23 | 0.50 | 0.14 | 0.06 |
| Exclusively Part-Time | 10.09 | 8.31 | 0.14 | 0.99 | 0.13 | 0.32 | 0.04 | 0.16 | |
| Mixed Enrollment | 40.84 | 25.67 | 7.80 | 3.09 | 3.11 | 0.81 | 0.27 | 0.09 | |
| >20-24 | Exclusively Full-Time | 55.77 | 48.31 | 3.32 | 1.21 | 2.07 | 0.52 | 0.25 | 0.08 |
| Exclusively Part-Time | 12.96 | 8.93 | 0.47 | 1.21 | 0.26 | 2.00 | 0.06 | 0.04 | |
| Mixed Enrollment | 33.93 | 24.42 | 3.98 | 2.11 | 1.67 | 1.22 | 0.42 | 0.10 | |
| Over Age 24 | Exclusively Full-Time | 59.23 | 54.65 | 2.01 | 0.84 | 0.97 | 0.46 | 0.26 | 0.04 |
| Exclusively Part-Time | 28.53 | 24.17 | 0.87 | 0.79 | 0.77 | 1.83 | 0.08 | 0.02 | |
| Mixed Enrollment | 41.59 | 32.24 | 3.82 | 1.71 | 1.89 | 1.03 | 0.84 | 0.06 | |
Table 56. Completion Rates for Women at Different Institutions Across State Lines by Age at First Entry and Enrollment Intensity (N=1,174,333)
| Age at First Entry | Enrollment Intensity | Total Completion Rate (%) | Completion at Same Institution (%) | Completion at Different Institution, In-State (%) | Completion at Different Institution, Out-Of-State (%) | Completion at Different Institution, Multiple State (%) | |||
| Four-Year | Two-Year | Four-Year | Two-Year | Four-Year | Two-Year | ||||
| 20 or Younger | Exclusively Full-Time | 84.71 | 71.77 | 6.80 | 1.72 | 3.70 | 0.43 | 0.20 | 0.10 |
| Exclusively Part-Time | 13.58 | 10.77 | 0.25 | 1.48 | 0.23 | 0.34 | 0.16 | 0.35 | |
| Mixed Enrollment | 48.43 | 28.35 | 10.33 | 4.28 | 3.83 | 0.98 | 0.44 | 0.24 | |
| >20-24 | Exclusively Full-Time | 61.58 | 53.54 | 3.49 | 1.43 | 2.02 | 0.45 | 0.43 | 0.22 |
| Exclusively Part-Time | 17.55 | 12.93 | 0.71 | 1.87 | 0.31 | 1.34 | 0.18 | 0.21 | |
| Mixed Enrollment | 35.54 | 25.13 | 4.01 | 2.68 | 1.58 | 1.17 | 0.66 | 0.31 | |
| Over Age 24 | Exclusively Full-Time | 59.33 | 54.58 | 2.23 | 0.90 | 0.67 | 0.33 | 0.50 | 0.11 |
| Exclusively Part-Time | 30.48 | 27.12 | 1.20 | 1.06 | 0.45 | 0.45 | 0.18 | 0.03 | |
| Mixed Enrollment | 43.18 | 33.85 | 3.77 | 2.21 | 1.42 | 0.71 | 1.09 | 0.12 | |
Table 57. Completion Rates for Students Who Started at Multistate Institutions by Enrollment Intensity (N=71,209)
| Enrollment Intensity | Total Completion Rate (%) | Completion at Same Institution (%) | Completion at Different Institution (%) | |
| Four-Year | Two-Year | |||
| Overall | 46.54 | 36.45 | 7.17 | 2.93 |
| Exclusively Full-Time | 67.84 | 62.04 | 4.37 | 1.43 |
| Exclusively Part-Time | 24.18 | 15.91 | 4.15 | 4.11 |
| Mixed Enrollment | 28.08 | 13.30 | 10.50 | 4.28 |
Table 58. Completion Rates for Students Who Started at Multistate Institutions by Gender (N=67,301)
| Gender | Total Completion Rate (%) | Completion at Same Institution (%) | Completion at Different Institution (%) | |
| Four-Year | Two-Year | |||
| Overall | 46.54 | 36.45 | 6.59 | 2.76 |
| Men | 46.87 | 34.22 | 9.02 | 3.63 |
| Women | 47.21 | 39.28 | 5.53 | 2.41 |
Table 59. Completion Rates for Students Who Started at Multistate Institutions by Age at First Entry (N=71,170)
| Age at First Entry | Total Completion Rate (%) | Completion at Same Institution (%) | Completion at Different Institution (%) | |
| Four-Year | Two-Year | |||
| Overall | 46.54 | 36.45 | 7.17 | 2.93 |
| 20 or Younger | 56.39 | 40.42 | 11.95 | 4.03 |
| >20-24 | 31.88 | 22.25 | 5.21 | 4.41 |
| Over Age 24 | 45.32 | 37.27 | 5.75 | 2.29 |
Table 60. Completion Rates for Students Who Started at Multistate Institutions by Gender and Age at First Entry (N=67,264)
| Gender | Age at First Entry | Total Completion Rate (%) | Completion at Same Institution (%) | Completion at Different Institution (%) | |
| Four-Year | Two-Year | ||||
| Men | 20 or Younger | 55.10 | 37.89 | 13.22 | 3.99 |
| >20-24 | 31.71 | 19.59 | 7.17 | 4.95 | |
| Over Age 24 | 45.16 | 34.81 | 7.13 | 3.22 | |
| Age Missing | 32.50 | 21.60 | 10.90 | 0.00 | |
| Women | 20 or Younger | 58.20 | 43.89 | 10.21 | 4.10 |
| >20-24 | 32.59 | 24.90 | 3.71 | 3.98 | |
| Over Age 24 | 46.67 | 40.27 | 4.64 | 1.76 | |
| Age Missing | 49.85 | 49.85 | 0.00 | 0.00 | |
Table 61. Completion Rates for Students Who Started at Multistate Institutions by Age at First Entry and Enrollment Intensity (N=71,170)
| Age at First Entry | Enrollment Intensity | Total Completion Rate (%) | Completion at Same Institution (%) | Completion at Different Institution (%) | |
| Four-Year | Two-Year | ||||
| 20 or Younger | Exclusively Full-Time | 79.15 | 66.53 | 10.57 | 2.04 |
| Exclusively Part-Time | 5.49 | 2.25 | 0.79 | 2.46 | |
| Mixed Enrollment | 37.23 | 16.99 | 14.11 | 6.13 | |
| >20-24 | Exclusively Full-Time | 53.22 | 47.75 | 3.15 | 2.31 |
| Exclusively Part-Time | 13.85 | 6.24 | 1.48 | 6.13 | |
| Mixed Enrollment | 20.81 | 8.40 | 6.89 | 5.51 | |
| Over Age 24 | Exclusively Full-Time | 65.47 | 62.08 | 2.28 | 1.11 |
| Exclusively Part-Time | 28.23 | 19.17 | 4.94 | 4.12 | |
| Mixed Enrollment | 25.95 | 12.85 | 9.82 | 3.27 | |
Table 62. Completion Rates for Men Who Started at Multistate Institutions by Age at First Entry and Enrollment Intensity (N=27,876)
| Age at First Entry | Enrollment Intensity | Total Completion Rate (%) | Completion at Same Institution (%) | Completion at Different Institution (%) | |
| Four-Year | Two-Year | ||||
| 20 or Younger | Exclusively Full-Time | 78.66 | 64.04 | 12.65 | 1.97 |
| Exclusively Part-Time | 2.27 | 0.60 | 0.38 | 1.30 | |
| Mixed Enrollment | 37.80 | 17.05 | 14.72 | 6.03 | |
| >20-24 | Exclusively Full-Time | 51.71 | 44.21 | 4.31 | 3.19 |
| Exclusively Part-Time | 9.75 | 2.81 | 1.31 | 5.63 | |
| Mixed Enrollment | 23.98 | 8.51 | 9.63 | 5.83 | |
| Over Age 24 | Exclusively Full-Time | 65.04 | 60.14 | 3.01 | 1.88 |
| Exclusively Part-Time | 25.66 | 12.86 | 5.81 | 6.99 | |
| Mixed Enrollment | 28.47 | 12.92 | 11.72 | 3.83 | |
Table 63. Completion Rates for Women Who Started at Multistate Institutions by Age at First Entry and Enrollment Intensity (N=39,388)
| Age at First Entry | Enrollment Intensity | Total Completion Rate (%) | Completion at Same Institution (%) | Completion at Different Institution (%) | |
| Four-Year | Two-Year | ||||
| 20 or Younger | Exclusively Full-Time | 79.98 | 69.37 | 8.43 | 2.18 |
| Exclusively Part-Time | 13.23 | 6.37 | 1.90 | 4.96 | |
| Mixed Enrollment | 35.44 | 16.45 | 12.71 | 6.28 | |
| >20-24 | Exclusively Full-Time | 54.97 | 51.03 | 2.11 | 1.83 |
| Exclusively Part-Time | 18.81 | 9.99 | 2.12 | 6.70 | |
| Mixed Enrollment | 18.49 | 8.35 | 4.92 | 5.23 | |
| Over Age 24 | Exclusively Full-Time | 67.19 | 64.77 | 1.70 | 0.72 |
| Exclusively Part-Time | 30.35 | 23.42 | 4.91 | 2.02 | |
| Mixed Enrollment | 23.81 | 12.54 | 8.26 | 3.01 | |
Table S-1. Seven-Year Completion Outcomes by Enrollment Intensity: Fall 2006 Cohort (N=1,862,840)
| Enrollment Intensity | Total Completion Rate (%) | Completion at Same Institution (%) | Completion at Different Institution (%) | Still Enrolled (At Any Institution) (%) | Not Enrolled (At Any Institution) (%) | |
| Four-Year | Two-Year | |||||
| Overall | 58.12 | 43.75 | 10.94 | 3.43 | 11.07 | 30.81 |
| Exclusively Full-Time | 78.77 | 67.41 | 9.38 | 1.98 | 1.78 | 19.46 |
| Exclusively Part-Time | 22.67 | 19.07 | 1.38 | 2.23 | 8.16 | 69.17 |
| Mixed Enrollment | 46.57 | 28.42 | 13.42 | 4.73 | 18.73 | 34.70 |
Data in this table are displayed in the report in Figures S-1 and S-2.
Table S-2. Seven-Year Completion Outcomes by Age at First Entry: Fall 2006 Cohort (N=1,847,108)
| Age at First Entry | Total Completion Rate (%) | Completion at Same Institution (%) | Completion at Different Institution (%) | Still Enrolled (At Any Institution) (%) | Not Enrolled (At Any Institution) (%) | |
| Four-Year | Two-Year | |||||
| Overall | 58.12 | 43.75 | 10.94 | 3.43 | 11.07 | 30.81 |
| 20 or Younger | 62.70 | 46.22 | 12.78 | 3.70 | 11.28 | 26.02 |
| >20-24 | 44.10 | 33.96 | 6.85 | 3.29 | 12.82 | 43.08 |
| Over Age 24 | 44.78 | 37.35 | 5.00 | 2.43 | 9.89 | 45.32 |
| Age Missing | 37.02 | 34.36 | 0.96 | 1.70 | 1.34 | 61.64 |
Data in this table are displayed in the report in Figure S-3.