

Current Term Enrollment – Spring 2019
Overview
In spring 2019, overall postsecondary enrollments decreased 1.7 percent from the previous spring. Figure 1 shows the 12-month percentage change (fall-to-fall and spring-to-spring) for each term over the last three years. Enrollments increased 3.2 percent at four-year private nonprofit institutions, but this increase was largely due to the recent conversion of a large for-profit institution to nonprofit status. Enrollments decreased among four-year for-profit institutions (-19.7 percent), two-year public institutions (-3.4 percent), and four-year public institutions (-0.9 percent). Taken as a whole, public sector enrollment (2-year and 4-year combined) declined by 1.9 percent this spring.
Current Term Enrollment Estimates, published every December and May by the National Student Clearinghouse Research Center, include national enrollment estimates by institutional sector, state, enrollment intensity, age group, and gender. Enrollment estimates are adjusted for Clearinghouse data coverage rates by institutional sector, state, and year. As of spring 2019, postsecondary institutions actively submitting enrollment data to the Clearinghouse account for 97 percent of enrollments at U.S. Title IV, degree-granting institutions. Most institutions submit enrollment data to the Clearinghouse several times per term, resulting in highly current data. Moreover, since the Clearinghouse collects data at the student level, it is possible to report an unduplicated headcount, which avoids double-counting students who are simultaneously enrolled at multiple institutions.
Figure 1: Percent Change from Previous Year, Enrollment by Sector (Title IV, Degree-Granting Institutions)
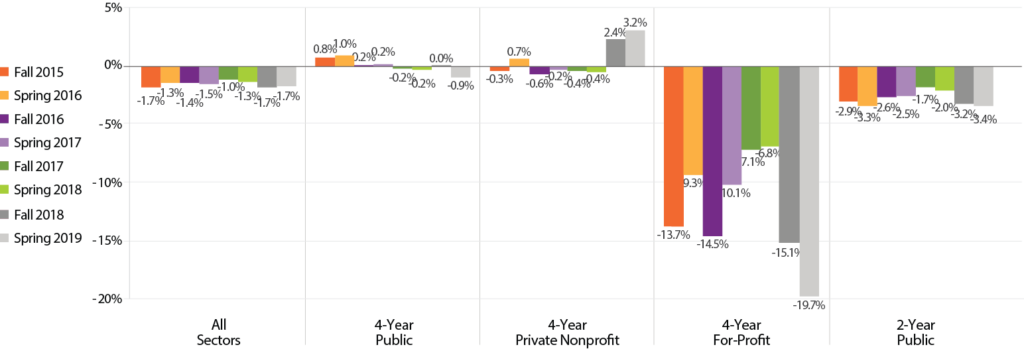
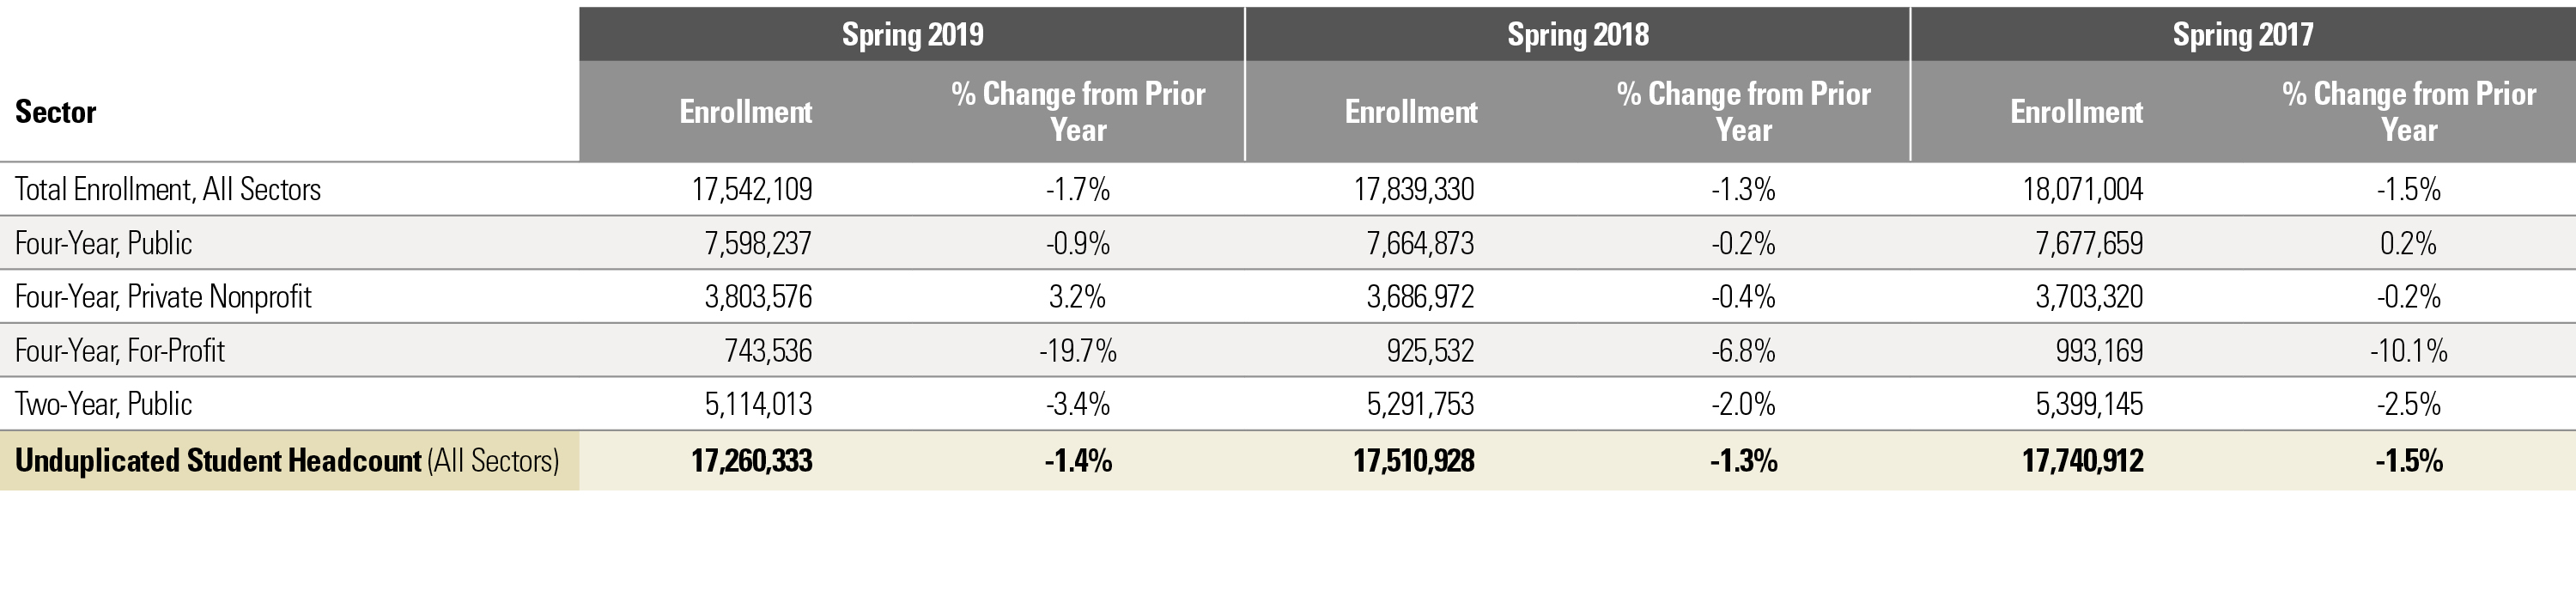
Table 1: Estimated National Enrollment by Sector (Title IV, Degree-Granting Institutions)
UNDERSTANDING THE NUMBERS
Table 1 provides counts of spring term enrollments submitted to the Clearinghouse by April 11 of each year. Enrollments represent one student in one institution and thus would count twice a student enrolled simultaneously at two institutions. The unduplicated headcount provides the number of unique students with no double-counting. This figure can be used to determine the percentage of concurrent enrollments in any given year. In each term, fewer than 2.0 percent of total enrollments can be accounted for by students enrolling in more than one institution.
Institutional classifications for the current term are based on the most recently available IPEDS institutional characteristics at the time of publication. Less-than-two-year institutions have been aggregated with two-year institutions. Two-year for-profits and two-year private nonprofits are not shown in the table due to small counts, but enrollments from those sectors are included in the overall totals. Additional notes on data and coverage are included at the end of this document.
Table 2: Estimated Enrollment in Private Non-Profit Institutions by Size of Institution (Title IV, Degree-Granting Institutions)

UNDERSTANDING THE NUMBERS
Table 2 provides a deeper look at the enrollment counts for private nonprofit institutions, by institution size. The size of institution is based on the most recently available IPEDS fall enrollment totals. Additional notes on data and coverage are included at the end of this document.
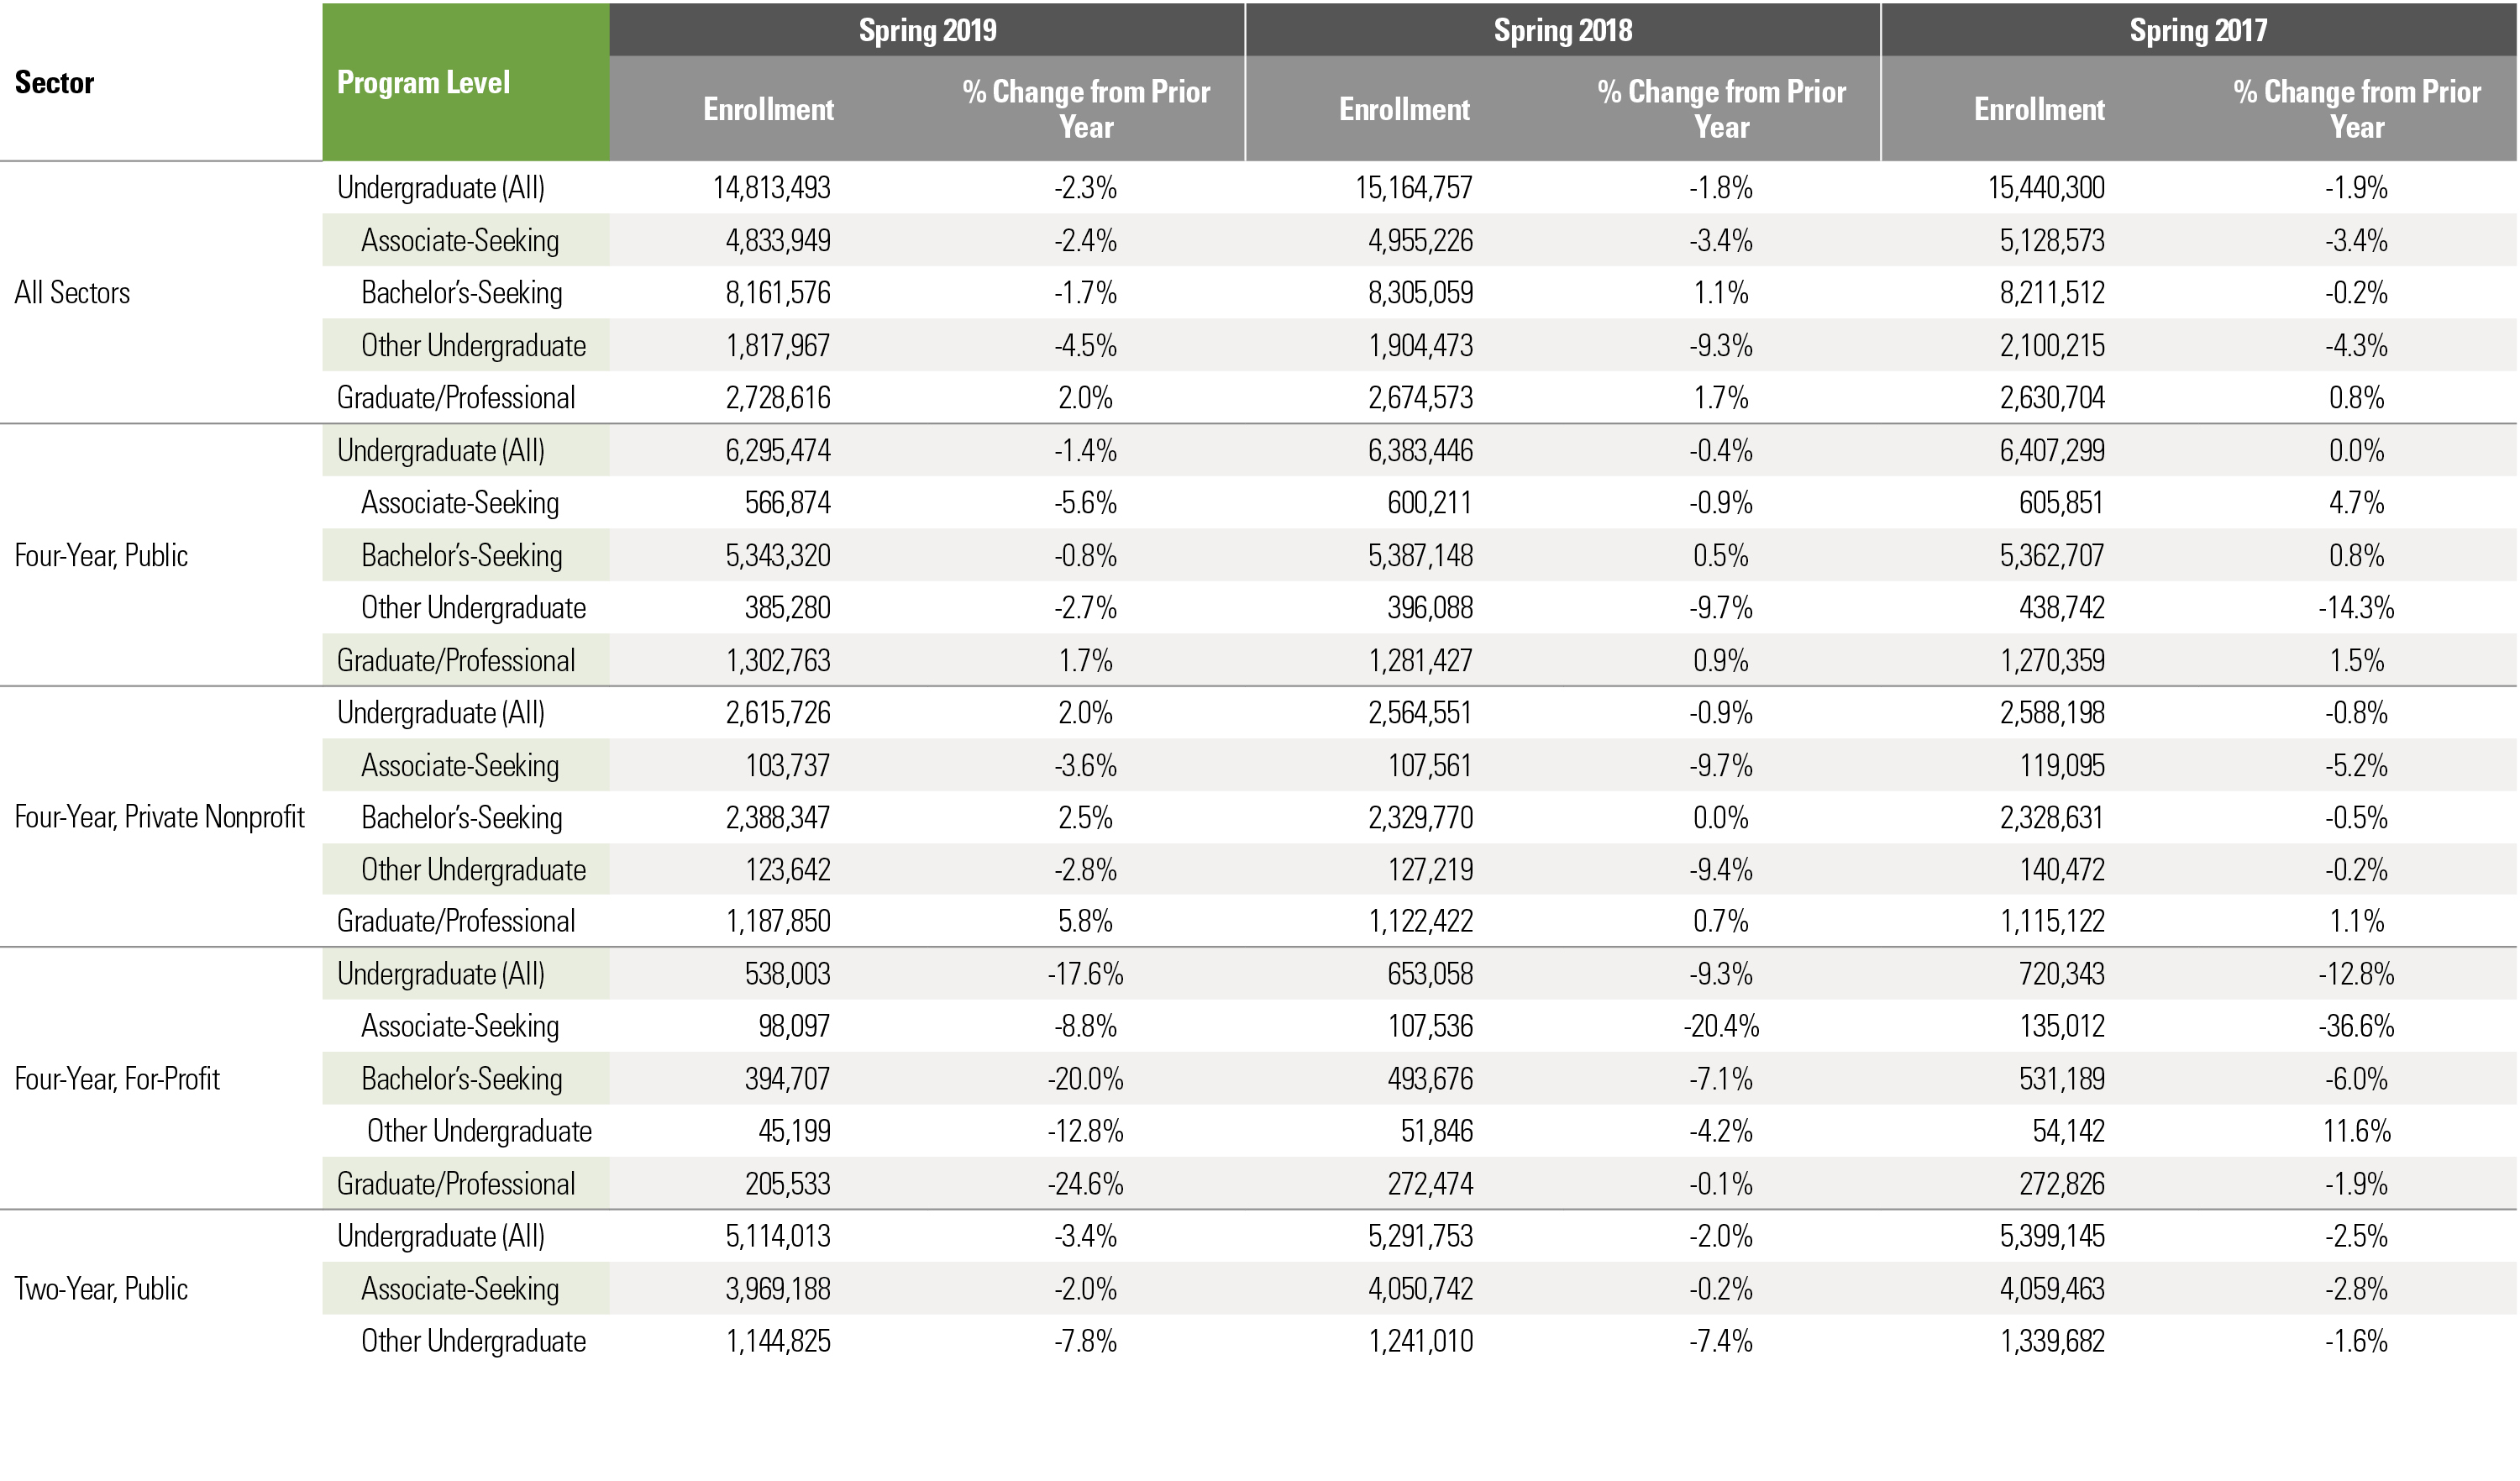
Table 3: Estimated National Enrollment by Sector and Program Level (Title IV, Degree-Granting Institutions)
UNDERSTANDING THE NUMBERS
Table 3 provides enrollment counts by program level. Beginning in the 2014-15 academic year, institutions began submitting additional data elements to the Clearinghouse to satisfy new reporting requirements for the National Student Loan Data System (NSLDS). This makes it possible to measure undergraduate and graduate enrollments separately for the current term, starting with fall 2015. The other undergraduate category includes: undergraduate certificate/diploma, teacher preparation and special non-credential programs that have been classified by institutions as undergraduate programs, as well as enrollments that are not part of any structured program. The graduate/professional category includes: post-baccalaureate certificate, master’s degree, doctoral degree, first-professional degree, graduate/professional certificate, and special non-credential programs that have been specifically classified by institutions as graduate-level programs.
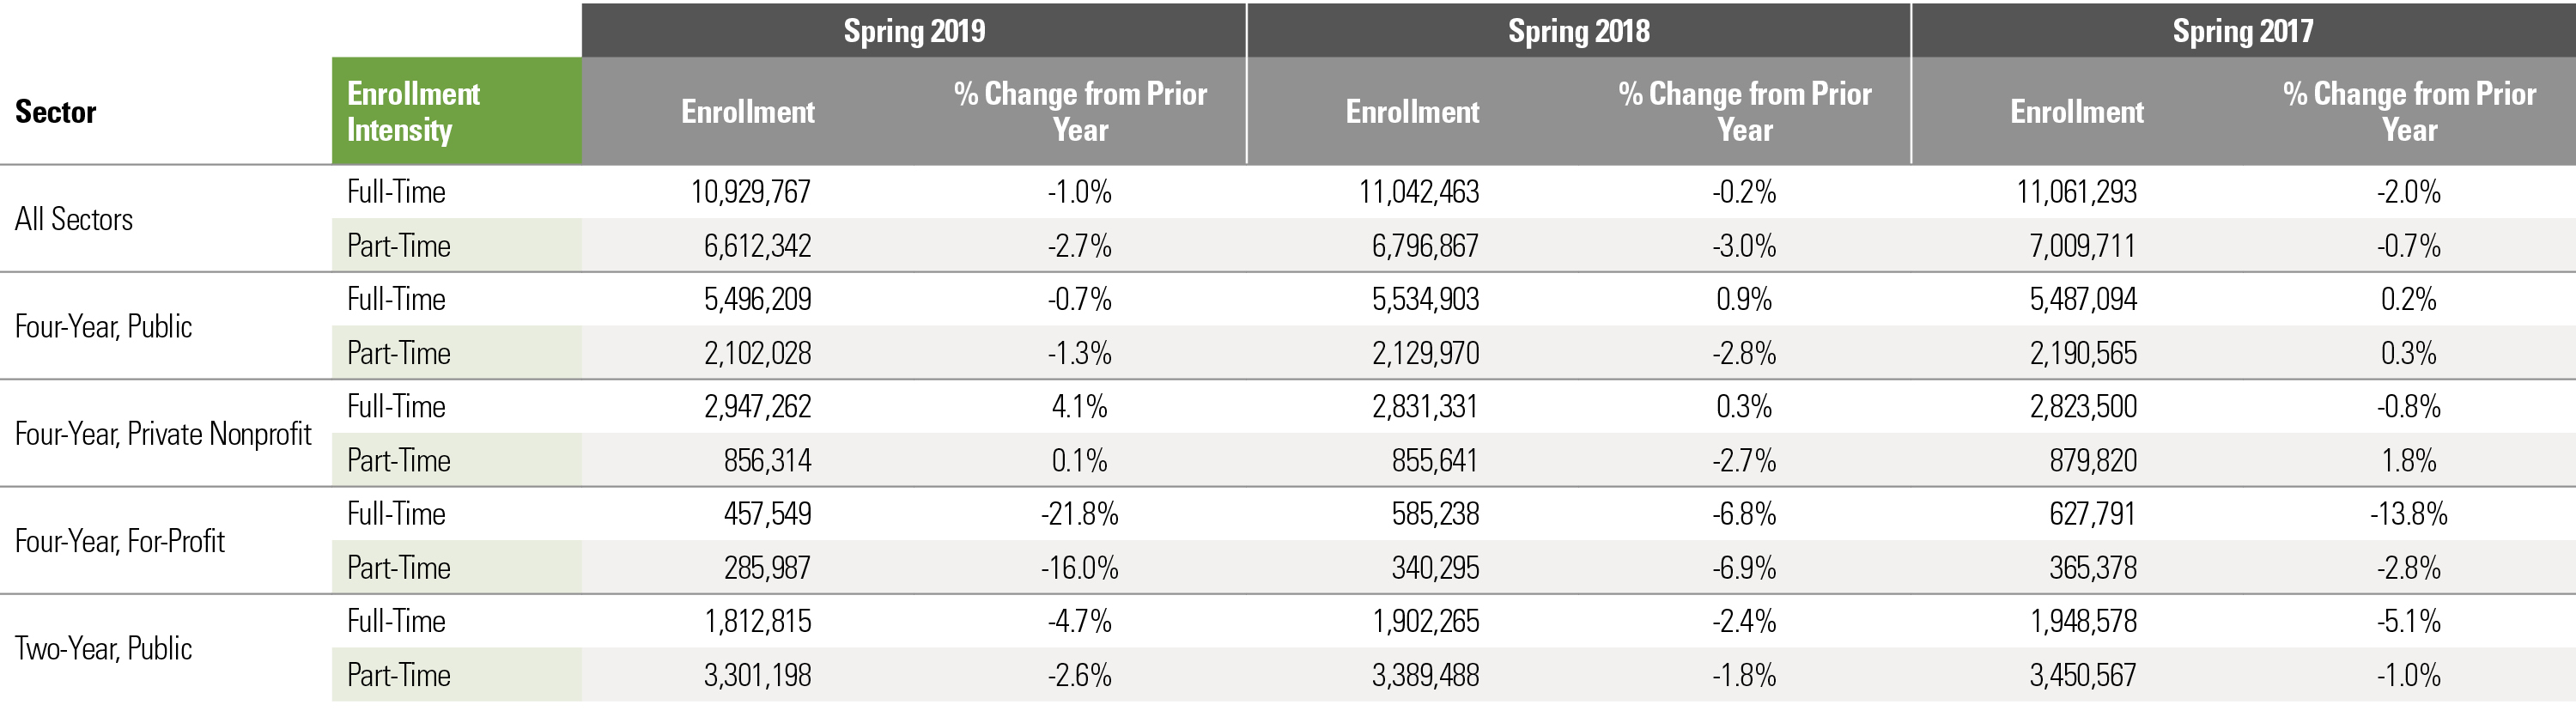
Table 4: Estimated National Enrollment by Sector and Intensity Level (Title IV, Degree-Granting Institutions)
UNDERSTANDING THE NUMBERS
Table 4 provides enrollment counts by the enrollment intensity of the student. The part-time category includes enrollments reported to the Clearinghouse as three-quarter time, half-time, and less-than-half-time. Enrollment intensity is defined by the institution and based on the earliest data submitted for a student in any given term. As a result, the intensity generally reflects the student’s intended workload at the beginning of the term. Less-than-two-year institutions have been aggregated with two-year institutions. Two-year for-profits and two-year private nonprofits are not shown in the table due to small counts, but enrollments from those sectors are included in the overall totals.
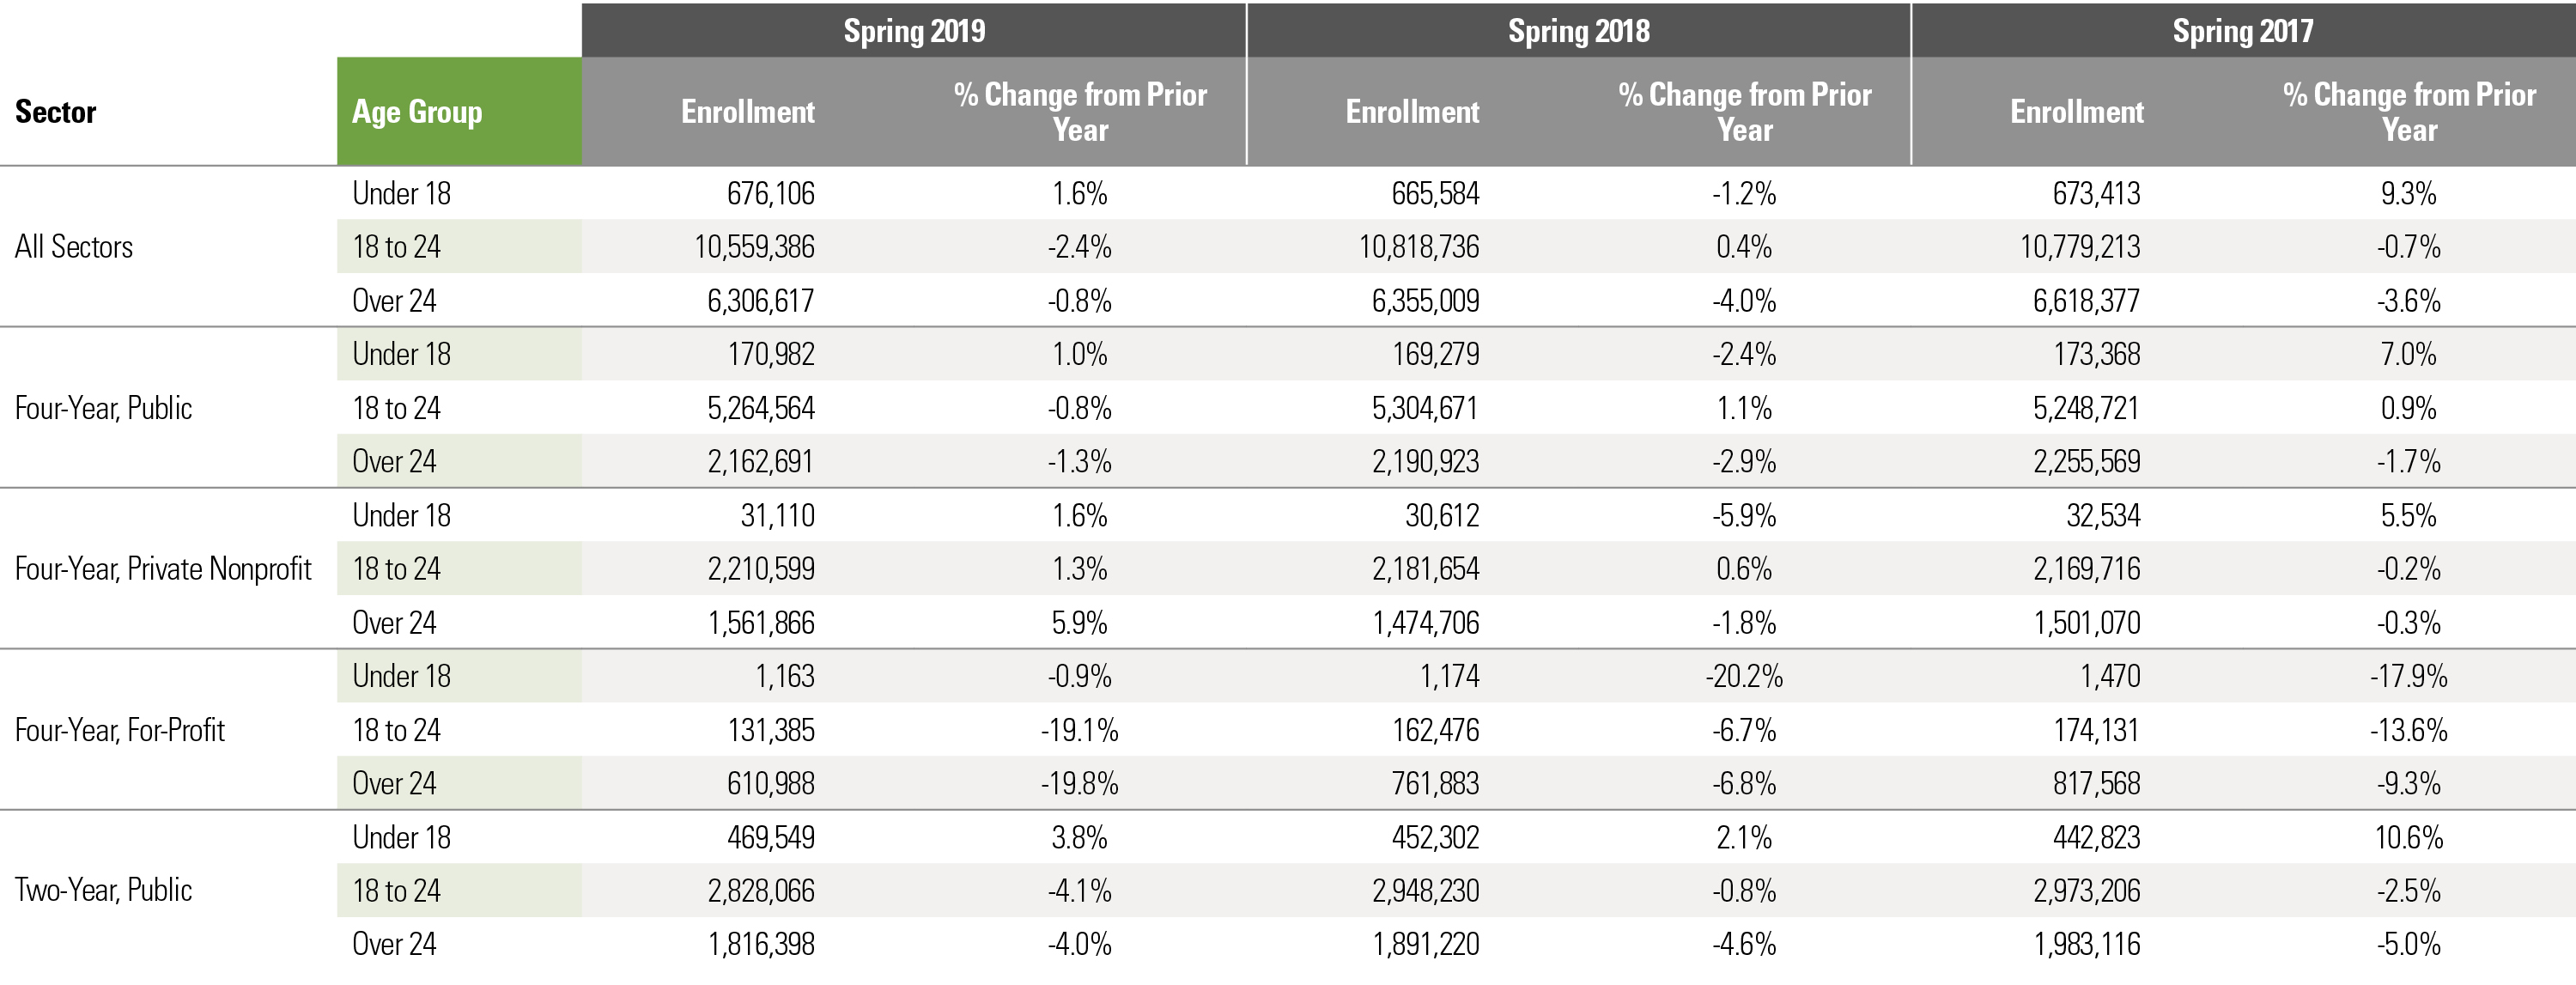
Table 5: Estimated National Enrollment by Sector and Age Group (Title IV, Degree-Granting Institutions)
UNDERSTANDING THE NUMBERS
Table 5 provides enrollment counts by student age group. This table includes all enrollments reported to the Clearinghouse, regardless of whether or not the student is enrolled in a credential-seeking program. Student age is calculated as of the first day of the term (a date specific to the institution). Less-than-two-year institutions have been aggregated with two-year institutions. Two-year for-profits and two-year private nonprofits are not shown in the table due to small counts, but enrollments from those sectors are included in the overall totals. Additional notes on data and coverage are included at the end of this document.
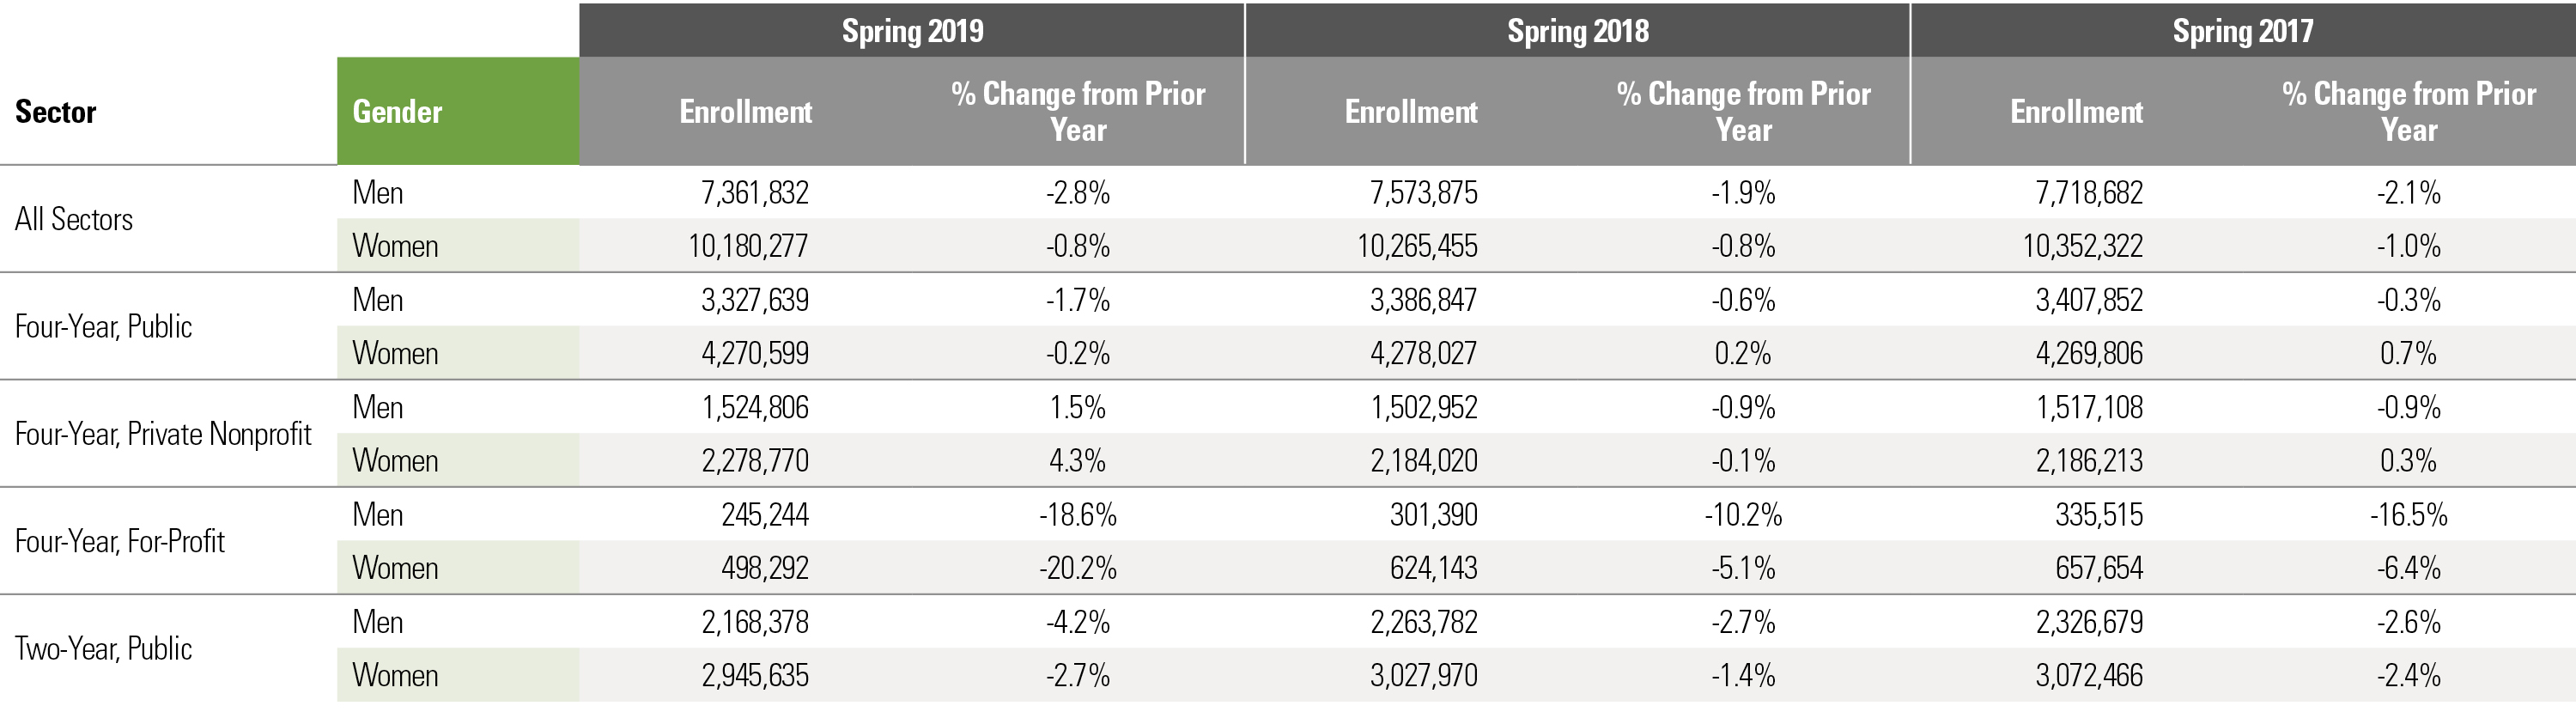
Table 6: Estimated National Enrollment by Sector and Gender (Title IV, Degree-Granting Institutions)
UNDERSTANDING THE NUMBERS
Table 6 provides enrollment counts by gender. Institutions reported student gender to the Clearinghouse for about one-half of all students. Gender was imputed based on first name for all other students. Less-than-two-year institutions have been aggregated with two-year institutions. Two-year for-profits and two-year private nonprofits are not shown in the table due to small counts, but enrollments from those sectors are included in the overall totals. Additional notes on data, coverage, and imputation of gender are included at the end of this document.
Table 7: Estimated Enrollment by State of Institution (Title IV, Degree-Granting Institutions)

UNDERSTANDING THE NUMBERS
Table 7 provides enrollment counts by the state where the institution is located. Institutions that span multiple states have been included in a separate line called “multi-state institutions.” Enrollments for these institutions are not included in any of the other state-level totals.
Table 8: Estimated Undergraduate Enrollment at Four-Year Institutions by Classification of Instructional Program Family

UNDERSTANDING THE NUMBERS
Table 8 provides college enrollment totals disaggregated by Classification of Instructional Program Family codes. The table excludes the following CIP family codes, each of which had total enrollments of less than 5,000: 25 (Library Science), 28 (Military Science, Leadership, and Operational Art), 29 (Military Technologies and Applied Sciences), 32 (Basic Skills and Developmental/Remedial Education), 33 (Citizenship Activities), 34 (Health-Related Knowledge and Skills), 35 (Interpersonal and Social Skills), 36 (Leisure and Recreational Activities), 37 (Personal Awareness and Self-Improvement), 53 (High School/Secondary Diplomas and Certificates), 60 (Residency Programs).
Table 9: Estimated Undergraduate Enrollment at Two-Year Institutions by Classification of Instructional Program Family

UNDERSTANDING THE NUMBERS
Table 9 provides college enrollment totals disaggregated by Classification of Instructional Program Family codes. The table excludes the following CIP family codes, each of which had total enrollments of less than 5,000: 05 (Area, Ethnic, Cultural, Gender, and Group Studies), 25 (Library Science), 28 (Military Science, Leadership, and Operational Art), 29 (Military Technologies and Applied Sciences), 33 (Citizenship Activities), 34 (Health-Related Knowledge and Skills), 35 (Interpersonal and Social Skills), 36 (Leisure and Recreational Activities), 37 (Personal Awareness and Self-Improvement), 38 (Philosophy and Religious Studies), 39 (Theology and Religious Vocations), 53 (High School/Secondary Diplomas and Certificates), 60 (Residency Programs).
Notes on the Data
National Coverage of the Data
As of spring 2019, institutions actively submitting enrollment data to the Clearinghouse account for 97 percent of all enrollments at Title IV, degree-granting institutions in the nation. Because Clearinghouse participation grew over the period covered by this report, and because coverage of institutions (i.e., percentage of all institutions participating in the Clearinghouse) is not 100 percent for any individual year, weights were applied by institutional sector and state to better approximate enrollment figures for all institutions nationally. Using all IPEDS Title IV, degree-granting institutions as the base study population, weights for each institution type and state were calculated using the inverse of the rate of enrollment coverage for that sector or state in the relevant year. Given the unavailability of fall 2018 IPEDS enrollments at the time of publication, fall 2017 IPEDS enrollments were used as the basis for calculating the spring 2019 Clearinghouse coverage rates.
For detailed statistics on enrollment coverage, as well as several other aspects of Clearinghouse data, visit the National Student Clearinghouse Research Center’s “Working With Our Data” page.
Differences from IPEDS
National Student Clearinghouse data are nonadjudicated, administrative data that come directly from college and university registrars. The data differ from IPEDS survey data in a number of important ways:
- Term definition: IPEDS does not conduct a spring enrollment survey, so there are no comparable IPEDS numbers for the spring. For Clearinghouse reporting, institutions provide the start- and end-dates for each enrollment, rather than formally designating fall or spring terms.
Spring Terms included in the Current Term Enrollment Estimates are those that:
- began between January 15 and March 31, inclusive OR
- ended between February 15 and April 30, inclusive OR
- began before January 15 AND ended after April 30.
- Degree-granting status: When referencing IPEDS enrollment counts, it is important to distinguish counts limited to degree-granting institutions from those that also include non-degree granting institutions. NCES publishes both of these counts in IPEDS First-Look Reports. The Clearinghouse counts in this report are limited to Title IV, degree-granting institutions.
- Enrollment status changes: Institutions submit data to the Clearinghouse throughout a given term, capturing changes in enrollment status from one submission to the next. The counts in this report include all students whose institution submitted at least one enrollment record showing the student as enrolled either full-time, three-quarters time, half-time, or less-than-half-time during the term. For IPEDS reporting, an institution generally counts a student according to the student’s enrollment status as of the institution’s IPEDS census date.
- International students: As the Clearinghouse continues to enhance its data collections to better support the needs of the education community, enrollment records for international students are starting to become more complete than in past years. Because this is a recent development, in order to ensure consistent year-to-year comparisons, international students have been excluded from this report. In recent years, IPEDS enrollments in the nonresident alien category have accounted for nearly five percent of all IPEDS enrollments.
Imputation of Gender
Institutions reported student gender to the Clearinghouse for slightly less than half of all students included in this report. The genders of the remaining students were imputed using a table of name-gender pairs that the Research Center developed using data publicly available from the Census Bureau and the Social Security Administration as well as the institution-reported data. The imputation used only those pairs in which the name had at least two instances and was associated with a single gender in at least 95 percent of the instances. The imputation is accurate in 99.6 percent of the cases with known gender. A detailed document on the development of our approach resides on the National Student Clearinghouse Research Center’s “Working With Our Data” Web page.
Customized Report Generation
The National Student Clearinghouse can generate focused or specialized versions of this report. If you are an educational agency, researcher, or nonprofit entity, please contact us through https://go.studentclearinghouse.org/custom-research for additional information. If you are a for profit business, please contact our Industry and Workforce team at reports@studentclearinghouse.org.