Watts-et-al.-2018-CSRP-PLOS-ONE


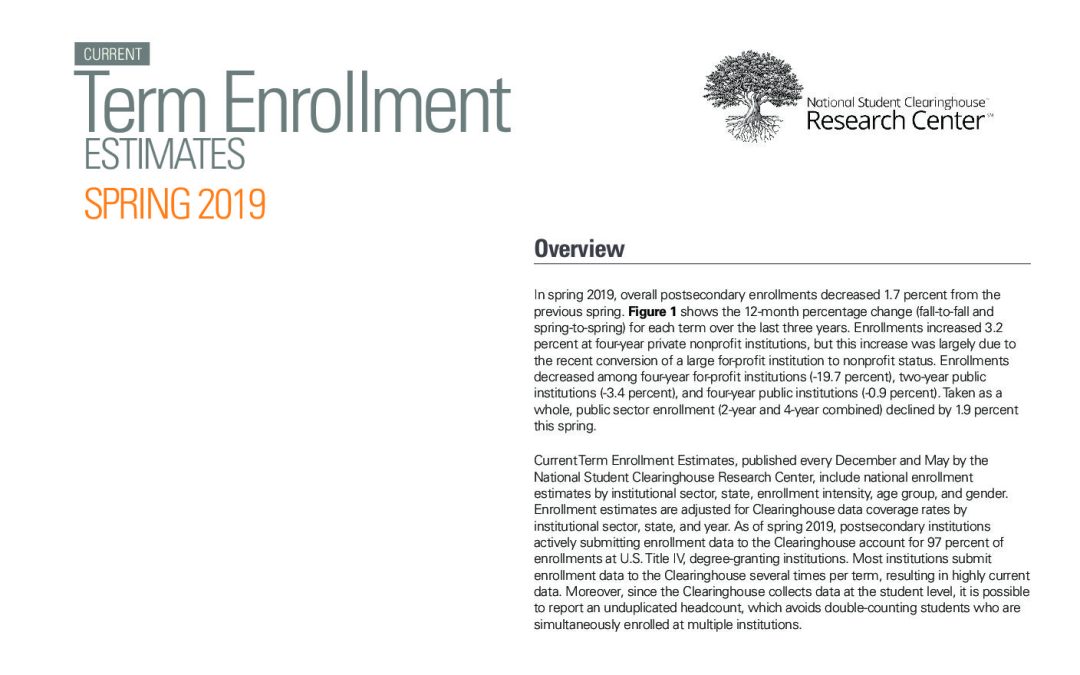
In spring 2019, overall postsecondary enrollments decreased 1.7 percent from the previous spring….
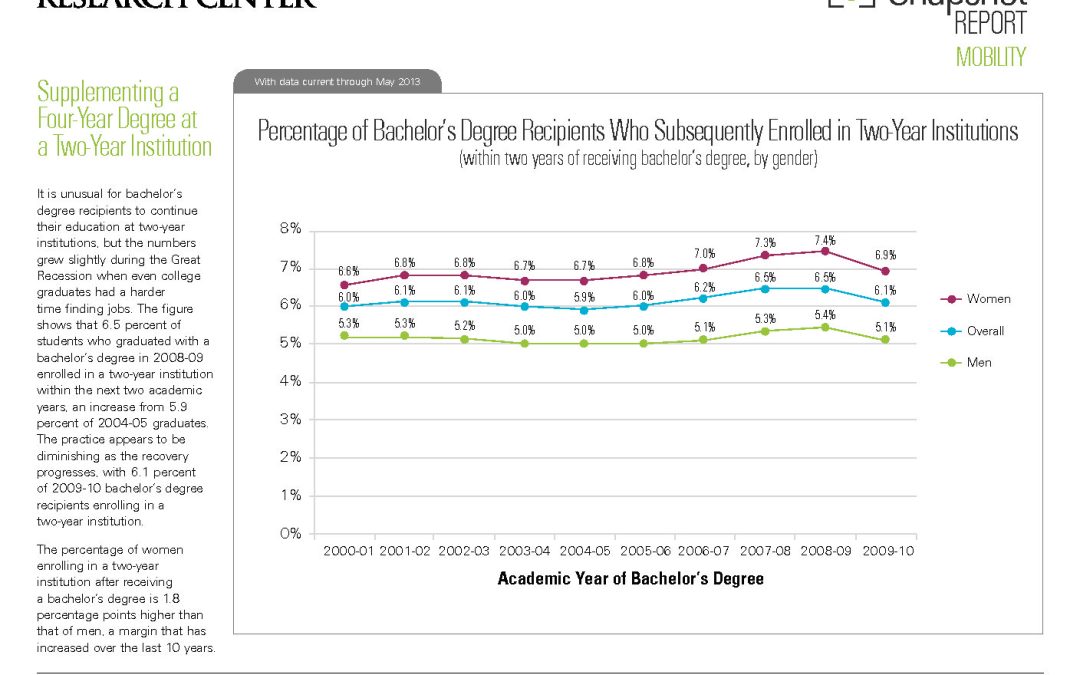
6.5 percent of students who graduated with a bachelor’s degree in 2008-09 enrolled in a two-year institution within the next two academic years, an increase from 5.9 percent of 2004-05…
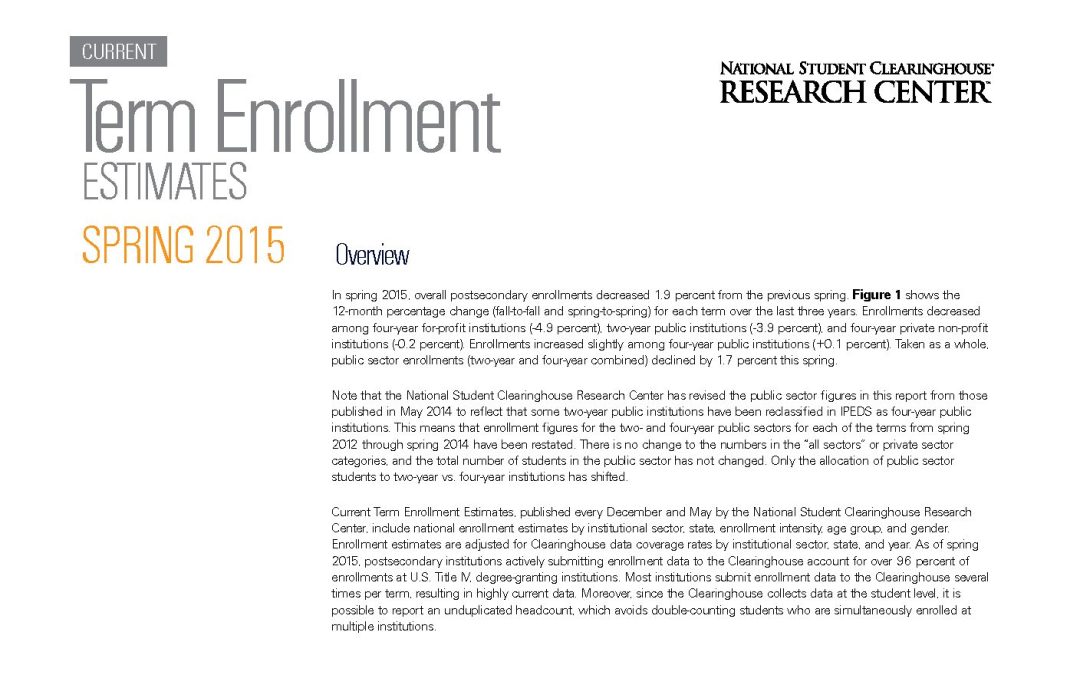
In spring 2015, overall postsecondary enrollments decreased 1.9 percent from the previous spring.
Students from higher-income high schools were 25 percent more likely to enroll in college immediately after high school than those from low-income schools (69 percent and 55 percent, respectively). The…
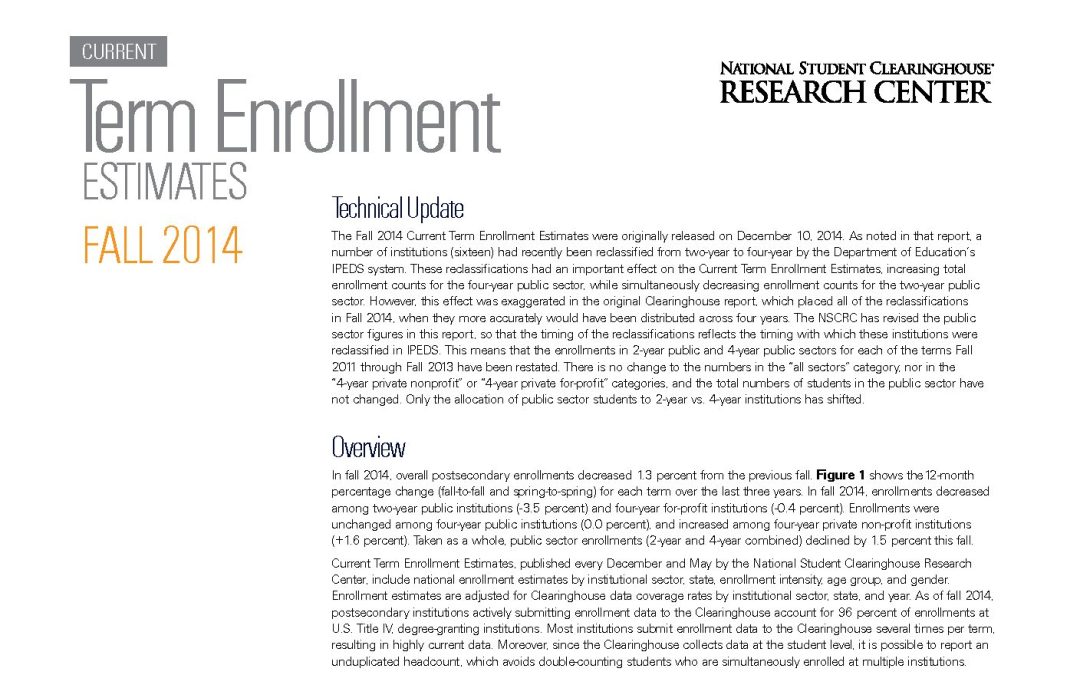
In fall 2014, overall postsecondary enrollments decreased 1.3 percent from the previous fall.
Two-Year Degrees by Age Group From 2007-08 to 2010-11, the number of degrees awarded to students age 25 and older increased by 22%, compared to 17% for those under age…
This crosswalk table provides a general guideline for mapping between the 8-digit postsecondary institution codes in the Clearinghouse’s database and the 6-digit IPEDS unit IDs. Every postsecondary institution and branch…
The Undergraduate Degree Earners Report provides a demographic and education credential profile for all students who graduate with an undergraduate-level credential, encompassing undergraduate certificates and associate and bachelor’s degrees. In…
As a supplement to Completing College: A National View of Student Attainment Rates – Fall 2010 Cohort (2016), this report focuses on six-year student success outcomes and college completion rates…
This workbook contains national statistics of post-secondary two-to four-year institutional transfer patterns for the fall 2013 cohort of first-time degree-seeking students who started at a two-year institution….
Two-Year Contributions to Four-Year Degrees 45% of 2010-11 degree completers at four-year institutions had previous enrollments at two-year institutions….

This fifth annual High School Benchmarks Report provides the most updated data on high school graduates’ college access, persistence, and completion outcomes. The report was designed with several features particularly…