Completing College – National – 2016 – Eight Year Outcomes Supplement
This supplemental feature to our Signature Report on College Completions released in December 2016, contains an analysis of the eight-year completion outcomes for the fall 2010 cohort. In our previous signature reports on college completions, we provided a brief analysis of the eight-year outcomes following the main discussion of six-year outcomes. In response to the growing need for educational researchers to extend the time period given for graduation rate analyses, the Signature Report series on College Completions will now include an expanded examination of the eight-year completion outcomes as a supplemental feature.
Suggested Citation: Shapiro, D., Dundar, A., Huie, F., Wakhungu, P., Bhimdiwala, A., & Wilson, S. E. (2019, February). Completing College: Eight Year Completion Outcomes for the Fall 2010 Cohort (Signature Report No. 12c). Herndon, VA: National Student Clearinghouse Research Center.
List of Figures
-
Figure 1. Six-Year and Eight-Year Overall Outcomes for the Fall 2010 Cohort
-
Figure 2. Six-Year and Eight-Year Overall Outcomes by Starting Institution Type for the Fall 2010 Cohort
-
Figure 3. Six-Year and Eight-Year Completion at Starting vs. Different Institution by Enrollment Intensity
-
Figure 4. Six-Year and Eight-Year Completion Outcomes by Race and Ethnicity
-
Figure 5. Six-Year and Eight-Year Completion Outcomes by Gender
-
Figure 6. Six-Year and Eight-Year Outcomes for Students Who Started at Four-Year Public Institutions
by Race and Ethnicity -
Figure 7. Six-Year and Eight-Year Outcomes for Students Who Started at Two-Year Public Institutions
by Race and Ethnicity
Supplemental Feature: Eight Year Completion Outcomes for the Fall 2010 Cohort
Key Results
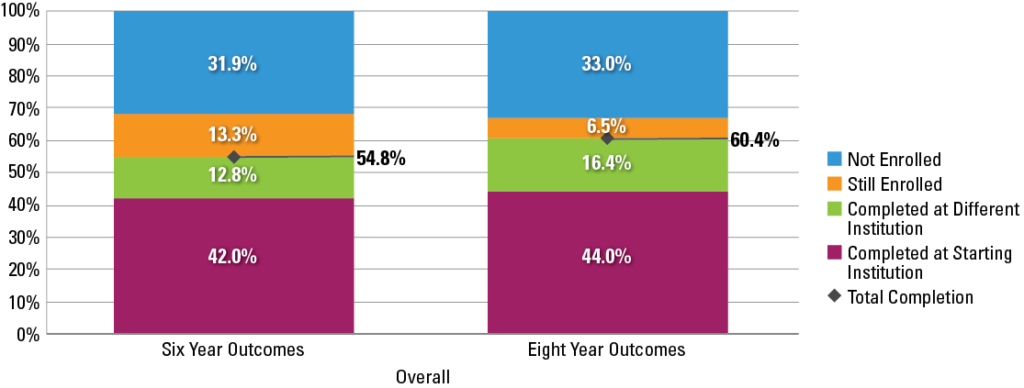
The national total completion rate for the fall 2010 cohort increased 5.6 percentage points, from 54.8 percent at the end of six years to 60.4 percent at the end of eight years.
Four-year public and two-year public institution starters had fairly similar completion gains. The completion rate for four-year public starters increased 6.4 percentage points (from 62.4 percent to 68.8 percent) whereas the completion rate for two-year public starters increased 6.0 percentage points (from 39.3 percent to 45.3 percent).
Two-year public starters had the highest proportion of completions at a different institution (36.8 percent of all completions) by the end of eight years in comparison to four-year public (24.1 percent) and four-year private nonprofit starters (20.3 percent).
The completion rate increased approximately 6 percentage points for both men and women. Overall, women complete a credential at higher rates than men, where the six-year completion rate for women (58.2 percent) is higher than the eight-year completion rate for men (57.4 percent).
For four-year public starters, the Hispanic student total completion rate increased 8.3 percentage points, from 55.0 percent to 63.3 percent, representing the largest completion increase in comparison to any other race and ethnicity group. The second largest increase was observed for Asian students (7.4 percentage points increase from 71.7 to 79.2 percent), closely followed by Black students (7.2 percentage points increase from 45.9 percent to 53.1 percent) then white students (6.0 percentage points from 67.2 percent to 73.1 percent).
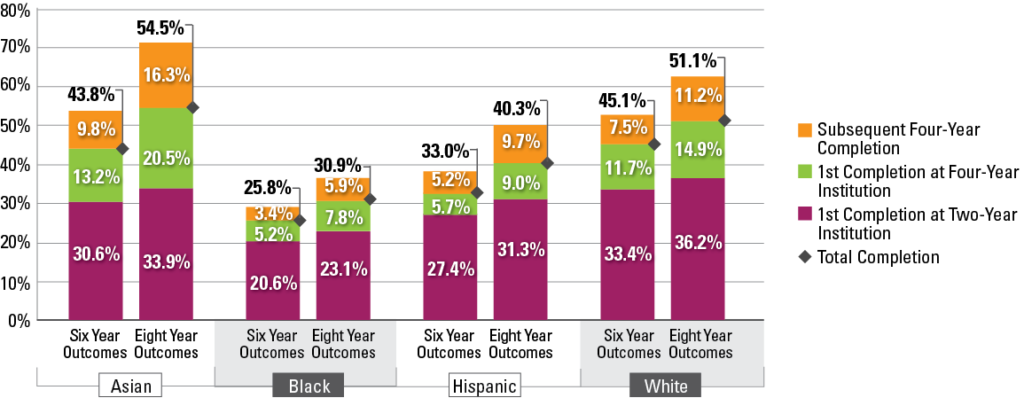
Among two-year public starters, Asian students’ completion rate increased from 43.8 percent at the end of six years to 54.5 percent at the end of eight years, representing an 11 percentage point total increase. This was followed by Hispanic students with a 7.2 percentage point increase (from 33.0 percent to 40.3 percent), white students with a 6.0 percentage point increase (from 45.1 percent to 51.1 percent), and black students with a 5.1 percentage point increase (from 30.9 percent to 33.0 percent).
In terms of four-year completions for two-year starters, an additional 13.8 percent of Asian students subsequently completed a four-year degree at the end of eight years (from 23.0 percentage points to 36.8 percentage points), followed by Hispanic students, with an additional 7.9 percent total four-year completions (from 10.8 percentage points to 18.7 percentage points).
A Note on the Data
Detailed methodological information, including data sources, coverage, and cohort definitions can be found in the Signature 12 national report and the Signature 12 race and ethnicity supplement. It is important to note here that the data used for race and ethnicity analyses was scientifically selected as a stratified random sample of the national student population. Therefore, the race and ethnicity analyses were based on a subset of the national student population. See Signature 12 race and ethnicity supplement on the procedures used to select the sample and ensure representativeness.
Results
Figure 1 shows that overall, regardless of starting institution, the six to eight-year national completion rate rose 5.6 percentage points, from 54.8 percent to 60.4 percent. Completions at a different institution rose 3.6 percentage points, from 12.8 percent at the end of six years to 16.4 percent at the end of eight years. This increase was larger than that in the completion rate at the starting institution, which was 2.0 percentage points. Little change was observed for the no longer enrolled rate, which suggests that drop-out slows down after the sixth year.
Figure 1. Six-Year and Eight-Year Overall Outcomes for the Fall 2010 Cohort
In terms of the overall outcomes by starting institution type, Figure 2 shows that four-year public and two-year public institution starters benefit similarly from an extended time to completion. Specifically, the completion rate for four-year public starters increased 6.4 percentage points (from 62.4 percent to 68.8 percent) whereas the completion rate for two-year public starters increased 6.0 percentage points (from 39.3 percent to 45.3 percent). Although the overall completion rate for four-year private nonprofit starters was the highest at 78.4 percent at the end of eight years, this group also experienced the smallest six- to eight-year gain (4.5 percentage point completion rate increase to 78.4 percent). As expected, two-year public starters had the highest proportion of completions a different institution (36.8 percent of all completions) by the end of eight years in comparison to four-year public (24.1 percent) and four-year private nonprofit starters (20.3 percent).
Figure 2. Six-Year and Eight-Year Overall Outcomes by Starting Institution Type for the Fall 2010 Cohort
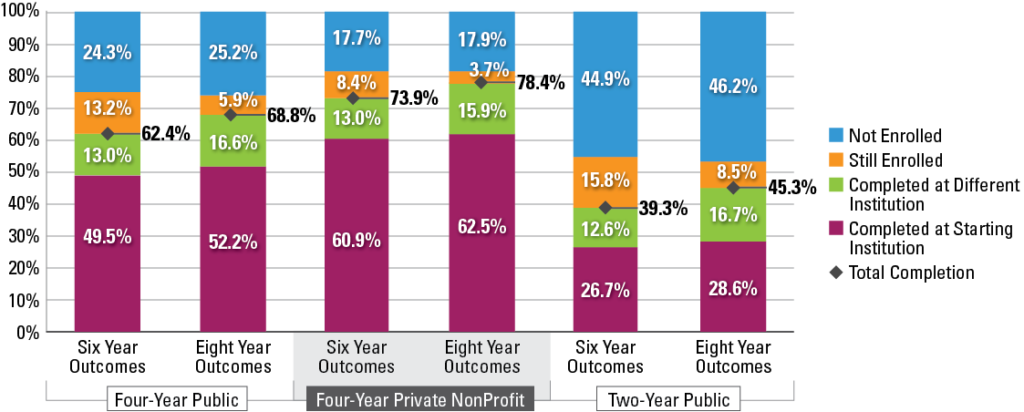
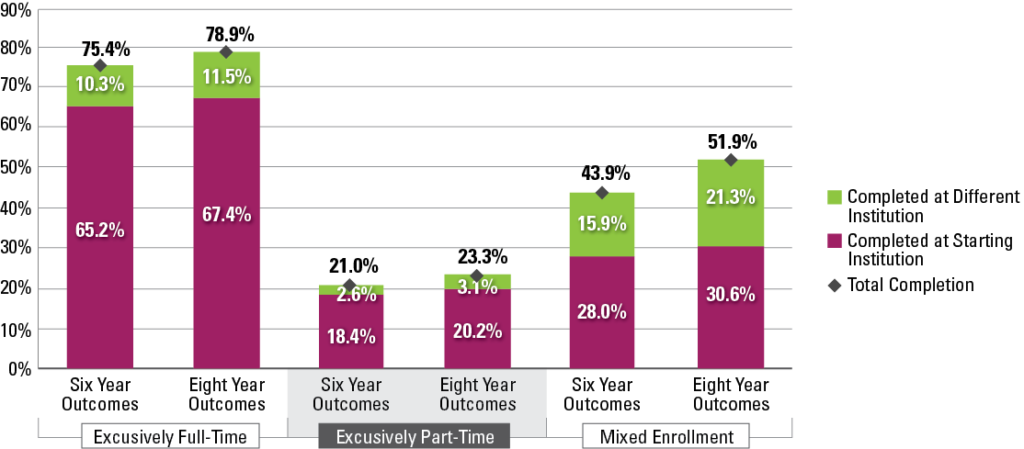
Figure 3 depicts the six- and eight-year outcomes by enrollment intensity. The results show that mixed enrollment students experienced the strongest gains, where their total completion increased 8.0 percentage points, from 43.9 percent at the end of six years to 51.9 percent at the end of eight years. The completion rate for exclusively full-time and exclusively part-time students increased 3.5 percentage points and 2.3 percentage points, respectively. Further, the proportion of students who completed at a different institution was also substantially higher for mixed enrollment students (5.4 percentage points, from 15.9 percent to 21.3 percent) than for exclusively full-time (1.3 percentage points increase from 10.3 percent to 11.5 percent) and exclusively part-time students (0.5 percentage points increase from 2.6 percent to 3.1 percent).
Figure 3. Six-Year and Eight-Year Completion at Starting vs. Different Institution by Enrollment Intensity
With an additional two years, the eight-year graduation rate increased the sharpest for Asian students, from 63.2 percent to 71.5 percent, representing an 8.3 percentage points total increase (Figure 4). This was followed by Hispanic students, whose total completion rate increased 7.4 percentage points (from 45.8 percent to 53.2 percent). Black students’ completion rate increased 6.3 percentage points (from 38.0 percent to 44.3 percent), whereas white students’ completion rate increased 5.4 percentage points (from 67.4 percent to 62.0 percent).
Figure 4. Six-Year and Eight-Year Completion Outcomes by Race and Ethnicity
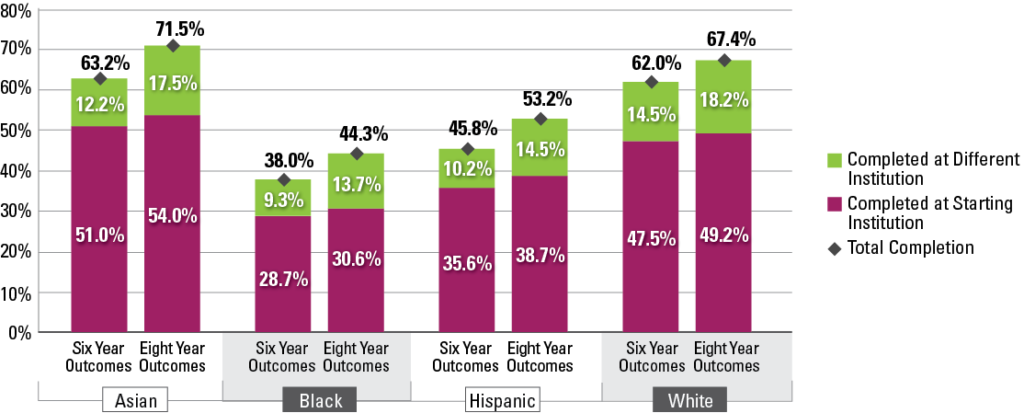
Figure 5 shows the six- and eight-year completion rate outcomes by gender. These results show that the completion rate increase from six to eight years are generally the same regardless of gender. Specifically, at the end of eight years the completion rate increased approximately 6 percentage points for both men and women. Overall, women complete a credential at higher rates than men. In fact, the six-year completion rate for women (58.2 percent) is higher than the eight-year completion rate for men (57.4 percent).
Figure 5. Six-Year and Eight-Year Completion Outcomes by Gender
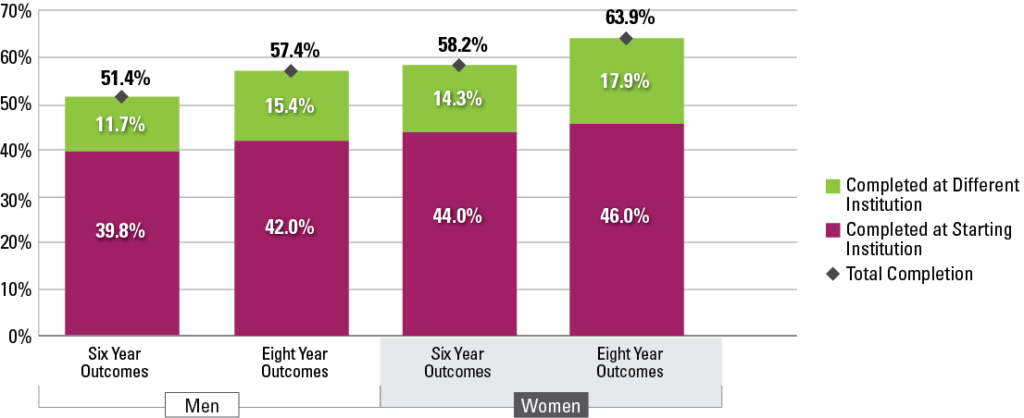
Figure 6 shows the six- and eight-year outcomes by race and ethnicity for students who started in four-year public institutions. The results revealed that the Hispanic and Black student completion rate increased considerably from six years to the end of eight years. With two additional years, the Hispanic student total completion rate increased 8.3 percentage points, from 55.0 percent to 63.3 percent, representing the largest increase in total completion in comparison to any other race and ethnicity group. This was followed by Asian students with a 7.4 percentage point increase (from 71.7 to 79.2 percent), closely followed by Black students with a 7.2 percentage point increase (from 45.9 percent to 53.1 percent). White students had 6.0 percentage points increase in completion rate (from 67.2 percent to 73.1 percent). Hispanic students also had the largest increase (4.2 percentage points) in the proportion of students who completed at the starting institution (from 43.7 percent to 47.9 percent) whereas Black and Hispanic students had the highest increase (4.1 percentage points) in proportion of students completing a credential elsewhere.
Figure 6. Six-Year and Eight-Year Outcomes for Students Who Started at Four-Year Public Institutions
by Race and Ethnicity
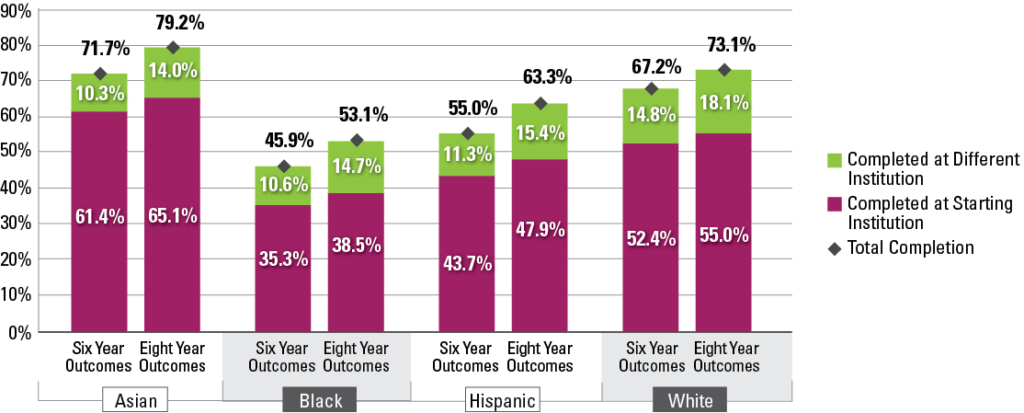
Figure 7 depicts the six- and eight-year outcomes of students who started at two-year public institutions by race and ethnicity. Out of the four race and ethnicity categories examined, Asian students had the highest completion rate increase from 43.8 percent total six-year completion to 54.5 percent at the end of eight years, representing an 11 percentage point increase. This was followed by Hispanic students with a 7.2 percentage point increase (from 33.0 percent to 40.3 percent), white students with a 6.0 percentage point increase (from 45.1 percent to 51.1 percent), and black students with a 5.1 percentage point increase (from 30.9 percent to 33.0 percent). In terms of four-year completions, black students’ total four-year completions increased from 8.6 percent to 13.7 percent whereas Hispanic students’ total four-year completions rate nearly doubled from 10.7 percent to 18.7 percent at the end of eight years.
Figure 7. Six-Year and Eight-Year Outcomes for Students Who Started at Two-Year Public Institutions
by Race and Ethnicity