

Transfer & Mobility – 2018
This Data Extra provides the state-level breakdown of the Transfer and Mobility national numbers presented in Signature Report 15 “Transfer and Mobility: A National View of Student Movement in Postsecondary Institutions, Fall 2011 Cohort” published in July 2018.
This workbook contains the following result tables by state:
Table 1. Total Transfer and Mobility of Students Who Transferred 2008–2014, Fall 2008 Cohort
Table 2. Transfer and Mobility of Students Who Transferred 2008–2014 by Sector and Control of Starting Institution, Fall 2008 Cohort
Table 3. Destination of First Transfer or Mobility 2008–2014 by Sector and Control of Starting Institution, All Transfer Students, Fall 2008 Cohort
Table 4. Total Transfer and Mobility to Two-Year Public Institutions for Students who Began at Four-Year Institutions, Fall 2008 Cohort
Table 5. Transfer and Mobility 2008–2014 by Enrollment Intensity, Fall 2008 Cohort
Table 6. Transfer and Mobility Within State and Out of State 2008–2014 by Sector and Control of Starting Institution, All Transfer Students, Fall 2008 Cohort
Table 7. Frequency of Transfer and Mobility, 2008-2014, Fall 2008 Cohort
Suggested Citation: Shapiro, D., Dundar, A., Huie, F., Wakhungu, P.K., Bhimdiwali, A., Nathan, A., & Youngsik, H. (2018, July). Transfer and Mobility: A National View of Student Movement in Postsecondary Institutions, Fall 2011 Cohort (Signature Report No. 15). Herndon, VA: National Student Clearinghouse Research Center.
Table of Contents
- Executive Summary
- List of Figures
- Introduction
- Defining Transfer and Mobility
- Results
- Section 1: Overall Transfer and Mobility of the Fall 2011 First-Time Student Cohort
- Section 2: Transfer and Mobility Rates by Institutional Sector
- Section 3: Transfer and Mobility Patterns by Starting and Destination Institutions
- Section 4: Transfer and Mobility Across States
- Discussion
- Trends in Transfer and Mobility
- Student Transfer and Mobility to and from Two-Year Institutions
- Transfer and Mobility for Students in Four-Year Institutions
- Transfer and Mobility by Race and Ethnicity
- Out-of-State Transfer and Mobility
- Implications for Policymaking
- References
Authors
National Student Clearinghouse Research Center
- Doug Shapiro
- Afet Dundar
- Faye Huie
Project on Academic Success, Indiana University
- Phoebe Khasiala Wakhungu
- Ayesha Bhimdiwala
- Angel Nathan
- Youngsik Hwang
Acknowledgements
The authors express their deepest appreciation to the contributions of Victor Borden, director of Project on Academic Success (PAS) and Professor of Higher Education and Student Affairs at Indiana University at Indiana University Bloomington, for his contribution and suggestions, which were extremely helpful in writing this report. From the National Student Clearinghouse Research Center, Diana Gillum, for her work to make the Clearinghouse data analysis ready. Of course, any remaining errors or omissions are solely the responsibility of the authors.
Executive Summary
The fall 2011 cohort consisted of 2.8 million first-time students. Within their first six years, over one million of them continued their studies at a different institution, resulting in an overall transfer rate of 38.0 percent.
This report defines student transfer and mobility as any change in a student’s institution of enrollment irrespective of the timing, direction, or location of the move, and regardless of whether any credits were transferred from one institution to another. The transfer rate reported here considers the student’s first instance of movement to a different institution, before receiving a bachelor’s degree and within a period of six years. For those students who began at two-year public institutions, we also include transfers that happened after receiving a degree at the starting two-year institution.
This report analyzes student enrollment patterns across two-year and four-year, public and private institutions, and examines the distribution of transfers and mobility across state lines and over multiple years. For the first time, this report also includes transfer patterns disaggregated by race and ethnicity. This will not only provide insight into how various groups of students move through their post-secondary education, but also show how students from traditionally underrepresented groups navigate the pipeline in comparison to their peers.
Two-year institutions served almost 1.5 million students of the fall 2011 cohort, including those who started in two year institutions and those who transferred. This figure represents more than half of the entire fall 2011 cohort and all transfers, indicating that two-year institutions not only served most of the starting cohort, but most of the transfer population as well. However, many two year students who transfer from community colleges do so without a degree. Only 5.6 percent of this cohort transferred after receiving a credential from their starting institution, either a certificate or an associate’s degree. The vast majority transferred without a degree.
Other findings include:
- Student mobility often involves out-of-state transfers. Out of all students who transferred, regardless of the starting institution, the out-of-state transfer rate for the fall 2011 cohort was 27.2 percent.
- The transfer rate for students who started at a four-year institution, was slightly higher
(38.5 percent) than for students who started at a two-year institution (37.1 percent). For those who started at a two-year public institution, 5.6 percent of students transferred after earning a degree at their starting institution. - The primary transfer destination for two-year starters was a four-year institution (50.5 percent of transfers) whereas the primary destination for four-year starters was a two-year institution (59.2 percent of transfers).
- Out of all four to two-year transfers, over one in three were summer swirlers (36.2 percent), students who transferred from four-year institutions to community colleges and subsequently returned to their starting institution in the fall term. This strategy was found, in an earlier Clearinghouse report, to be correlated to higher degree completion rates at the starting four-year institution.
- Among those who transferred from a two-year institution, Asian and White students were more likely to transfer to four-year institutions (49.8 percent and 50.4 percent, respectively) than Black and Hispanic students (33.2 percent and 39.5 percent, respectively).
- Among those who transferred from a four-year to a two-year institution, Asian and White students were more likely to have done so during the summer only (45.6 percent and 40.6 percent, respectively) than Black and Hispanic students (26.5 percent and 32.8 percent, respectively).
List of Figures
Figure I1. Total Overall Initial Enrollments by Sector and Control of Starting Institution
Figure I2. Total Initial Enrollments by Sector and Control of Starting Institution by Race and Ethnicity
Figure 1. Total Transfer and Mobility
Figure 2. Transfer and Mobility of Students by Age
Figure 3. Transfer and Mobility of Students by Race and Ethnicity
Figure 4. Transfer and Mobility of Students by Enrollment Intensity
Figure 5. Timing of First Transfer or Mobility 2011-2017, All Transfer Students
Figure 6. Overall Transfer and Mobility of Students by Institutional Level
Figure 7. Transfer and Mobility of Students Who Transferred/Did Not Transfer 2011–2017 by Sector and Control of Starting Institution, Fall 2011 Cohort
Figure 8. Timing of Initial Transfer by Section Level of Starting Institution
Figure 9. Destination of First Transfer or Mobility 2011-2017 by Level of Starting Institution
Figure 10. Destination of First Transfer or Mobility 2011–2017 by Sector and Control of Starting Institution, All Transfer Students
Figure 11. Timing of Initial Transfer by Level of Starting and Destination Institutions
Figure 12. Percentage of Summer and Non-Summer Swirlers in All Four-Year to Two-Year Transfers by Sector, Fall 2011 Cohort
Figure 13. Percent of Transfers from Two-Year Public to Four-Year Public Institutions by Race and Ethnicity
Figure 14. Percent of Transfers from Four-Year Public to Two-Year Public Institutions by Race and Ethnicity
Figure 15. Summer Swirl as Percent of Four-Year to Two-Year Mobility, by Control of Starting Institution and Race and Ethnicity
Figure 16. Transfer and Mobility Within State and Out of State 2011–2017 by Sector and Control of Starting Institution, All Transfer Students
Introduction: Transfer and Mobility as Integral to Students’ Education Pathways
This report is the third in the series of reports that examine national postsecondary student transfer pathways and patterns. Whereas the last two reports focused on the fall 2006 and fall 2008 cohorts, this specific report focuses on the cohort of students who started postsecondary education in fall 2011. Our previous transfer and mobility reports showed that many students attend multiple institutions before graduating from college. Further, our research has also established that the frequency, timing, and direction of transfer vary greatly with factors such as starting institution type/sector and enrollment intensity (Hossler et al., 2012; Shapiro et al., 2015).
For the first time, this report will include transfer patterns disaggregated by race and ethnicity. This will not only provide insight into how various groups of students move through their postsecondary education, but also show how students from traditionally underrepresented groups navigate the pipeline in comparison to their peers. Investigating postsecondary student mobility in relation to race and ethnicity provides additional perspectives on the factors that influence degree attainment and ultimately help institutions better serve the transfer population (Hossler et al., 2012).
It is important to note that many of our other reports address transfer. However, those reports analyze transfer patterns only from the perspective of its effect on specific outcomes (e.g., Time to Degree, Persistence and Retention, College Completions, and Tracking Transfers). This report, unlike the Completions report, measures transfer rates for the cohort regardless of whether students have completed a credential or are still enrolled at the end of the study period. Unlike the Time to Degree report, this present report covers a starting cohort, not a graduating cohort through a six-year window. In comparison to the Tracking Transfer report, this report investigates all types of transfer, not just two- to
four-year transfers.
Student mobility is a term used to describe student movement between institutions. Different patterns of student mobility include transfer, swirling, and double-dipping (Adelman, 2006; de los Santos & Wright, 1990; Borden, 2004; McCormick, 2003). Various studies have focused on student transfer from two-year to four-year institutions, also known as traditional, vertical, or upward transfer (Dougherty & Kienzl, 2006; Doyle, 2009; Eagan & Jaeger, 2009). In addition, research has identified other transfer pathways such as reverse transfer (transfer from four-year to two-year institutions) or lateral transfer (transfer from one two-year to another or from one four-year institution to another) (Goldrick-Rab & Pfeffer, 2009; U.S. Department of Education, 2001).
This report analyzes student enrollment patterns across two-year and four-year, public and private institutions, and examines the distribution of transfers and mobility across state lines and over multiple years. Such a comprehensive look makes the findings useful for state and institutional policymakers as well as for college administrators and the general public. With a better understanding of student transfer and mobility, institutional policymakers can become more equipped to advise their students on different postsecondary pathways.
Defining Transfer and Mobility
This study tracks the transfer patterns of all first-time students in the fall 2011 cohort within a six year period and before bachelor’s degree completion. The study cohort includes former dual enrollment students, or those who had college enrollment prior to fall 2011 as a high school student. Transfer is defined as any change in a student’s initial enrollment institution irrespective of the timing, direction, or location of the move, and regardless of whether any credits were transferred from one institution to another. Our goal is to illustrate the complexity of student movement among institutions, regardless of postsecondary completion or progress after transfer. The report includes transfer and mobility across institutions, sectors, and states — even if these movements happen over summer terms, after a period of no enrollment, or if the movements later prove to have been temporary. Our report also includes all students, those enrolled exclusively full time, exclusively part time, and with mixed enrollment, without attempting to discern intent to earn a degree at either the starting or the destination institution.
Various studies of transfer among students at four-year institutions consider short-term movement as inconsequential, or “casual course-taking,” treating students who later return to the starting institution as not having moved at all. Our definition of transfer and mobility includes these types of “multi-institutional attendance” (Adelman, 2006). This is because, in part, we consider only student enrollment at institutions, not course credits earned, whether credits were accepted by the destination institution, or, if so, how many credits were accepted. We do, however, highlight the “summer swirl” pattern (i.e., transfers among students who started at four-year institutions that happen only in summer followed by a return to the starting four-year institution).
The findings in this report provide an in-depth analysis of the first instance of transfer or mobility within the six-year study period. The tables and figures present:
- The prevalence of transfer and mobility nationwide overall and by gender, race and ethnicity, and sector and control of both the starting and destination institution;
- In-state and out-of-state mobility (transfer across state lines) by institution sector and control;
- Timing of the first instance of transfer or mobility, broken out by sector and control of both the starting and destination institution;
- Transfer from a two-year to a four-year institution with and without first earning an associate’s degree;
- Lateral transfer from one two-year to another two-year institution, or from one four-year to another four-year institution, with and without an eventual return to the starting institution; and
- Transfer from a four-year to a two-year institution, with and without an eventual return to the four-year institution.
A total of 2,816,648 students enrolled in postsecondary education at U.S. colleges and universities for the first time in fall 2011. Initial enrollment descriptives show that overall, more students first enrolled at a two-year public institution (40.8 percent) than at a four-year public institution (37.6 percent, Figure I1).
When disaggregated by race and ethnicity (Figure I2), Black and Hispanic students were even more likely to first enroll in a two-year public institution (48.5 percent and 51.4 percent, respectively), whereas White and Asian students were more likely to enroll in a four-year public institution (44.6 percent and 47.7 percent, respectively) than a two-year public institution (34.6 percent and 34.2 percent, respectively).
Figure I1. Total Overall Initial Enrollments by Sector and Control of Starting Institution, Fall 2011 Cohort*
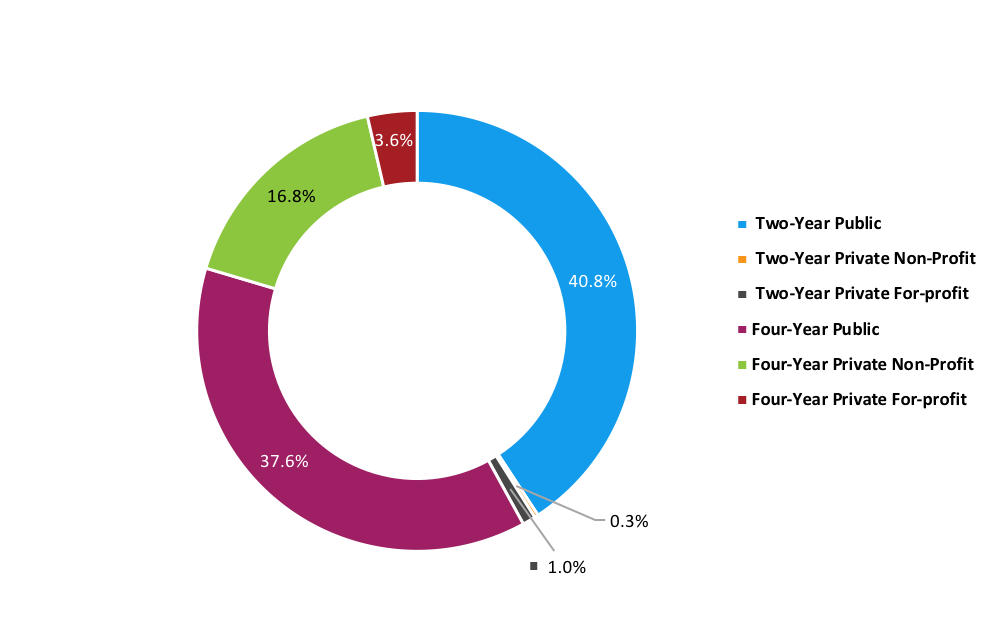
*This figure is based on data shown in Appendix C, Table 1a.
Figure I2. Total Initial Enrollments by Sector and Control of Starting Institution by Race and Ethnicity, Fall 2011 Cohort
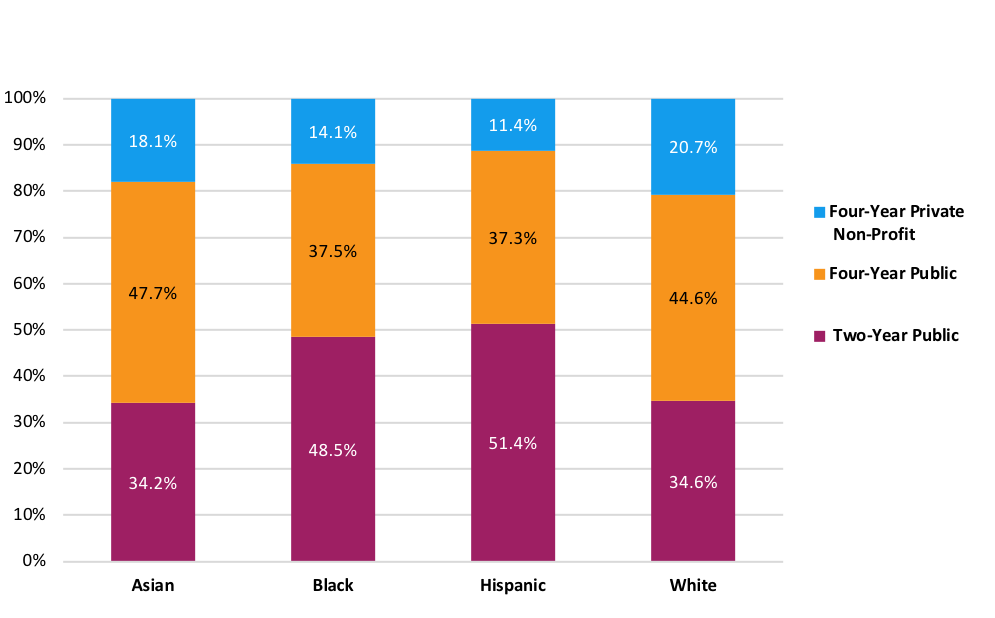
*This figure is based on data shown in Appendix C, Table 1c.
**Due to low coverage, race and ethnicity transfer statistics are only reported for students who started at a two year public non-profit, and four year public and four year private non-profit institution.
Results
The results are organized across four different sections. The first section describes the overall transfer patterns by different student demographic characteristics and the second section focuses on the transfer and mobility rates by institutional sector. The third section describes the transfer rates with respect to the starting and destination institutions and finally, the fourth section describes mobility across state lines.
SECTION 1: OVERALL TRANSFER AND MOBILITY: FALL 2011 FIRST-TIME STUDENT COHORT
The total six year transfer rate for the fall 2011 cohort was 38.0 percent, representing 1,069,243 transfer students (Figure 1).
Women had a slightly higher transfer rate than men (40.8 and 37.1 percent, respectively, Appendix C, Table 3). In terms of age, students 20 years old and younger were much more likely to transfer (45.0 percent) than students between 21-24 (27.3 percent) and adult learners (over age 24) (Figure 2). There was relatively little variation in the transfer and mobility patterns by race and ethnicity. Specifically, although Black students had the highest transfer rate (46.8 percent), Asian student transfer rate was 45.4 percent, followed by White students at 43.1 percent and Hispanic students at 43.4 percent (Figure 3). Breakdowns by enrollment intensity show that changing institutions was most common among mixed-enrollment students, with more than half of this group (51.4 percent) transferring to another institution at least once within the study period. The transfer rate was considerably lower among exclusively full-time students, with 28.7 percent in this group transferring at least once. Just over a tenth (12.0 percent) of part-time students transferred (Figure 4). Among all students who transferred, 28.5 percent made their first transfer during the second year, with another 21.0 percent transferring in their third year (Figure 5).
Figure 1. Total Transfer and Mobility, Fall 2011 Cohort (N= 2,816,648)*
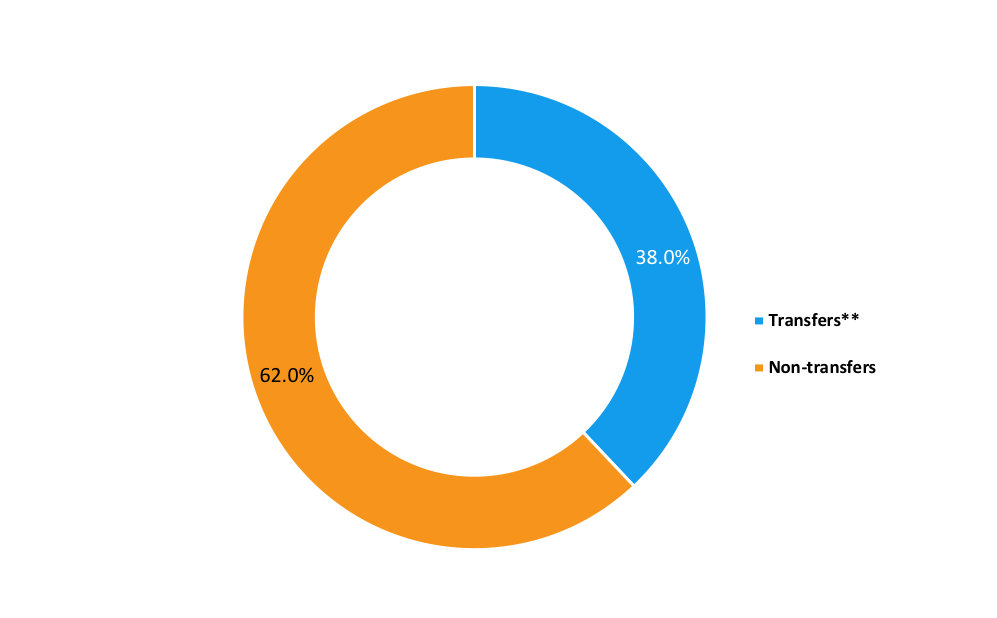
*This figure is based on data shown in Appendix C, Table 2.
**Includes post degree transfers for students who started in 2-year public institutions (n = 64,847)
Figure 2. Transfer and Mobility of Students by Age, Fall 2011 Cohort*
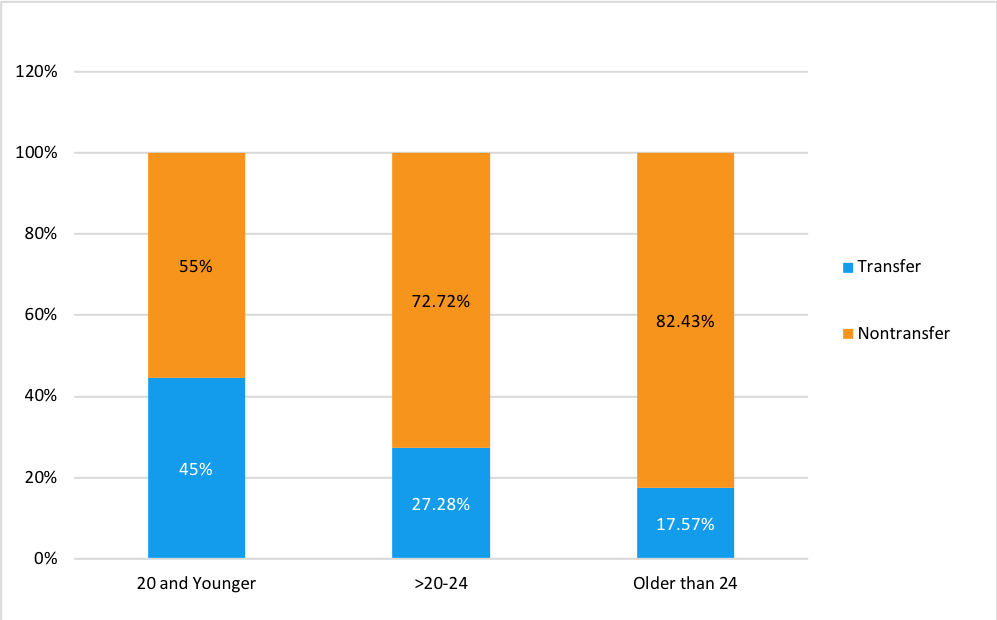
This figure is based on data shown in Appendix C, Table 5
Figure 3. Transfer and Mobility of Students by Race and Ethnicity, Fall 2011 Cohort*
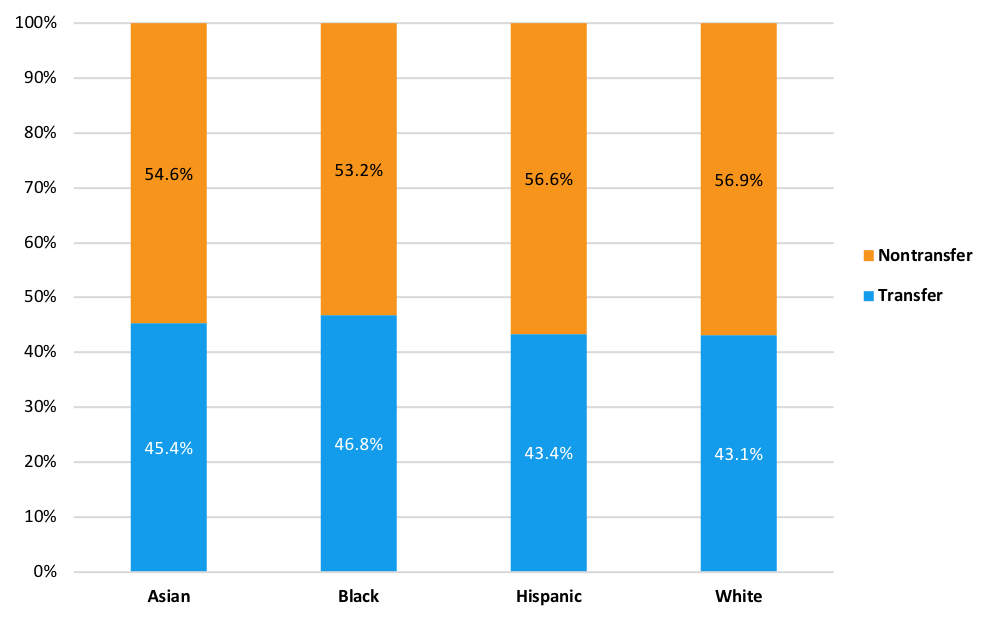
*This figure is based on data shown in Appendix C, Table 4.
Figure 4. Transfer and Mobility of Students by Enrollment Intensity, Fall 2011 Cohort*
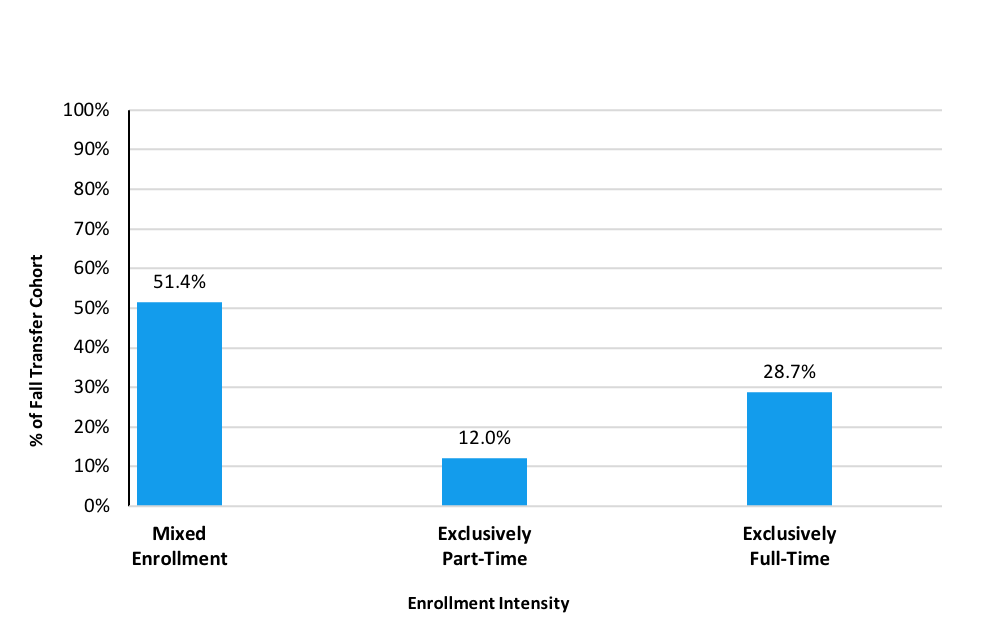
*This figure is based on data shown in Appendix C, Table 6.
Figure 5. Timing of First Transfer or Mobility 2011-2017, All Transfer Students, Fall 2011 Cohort*
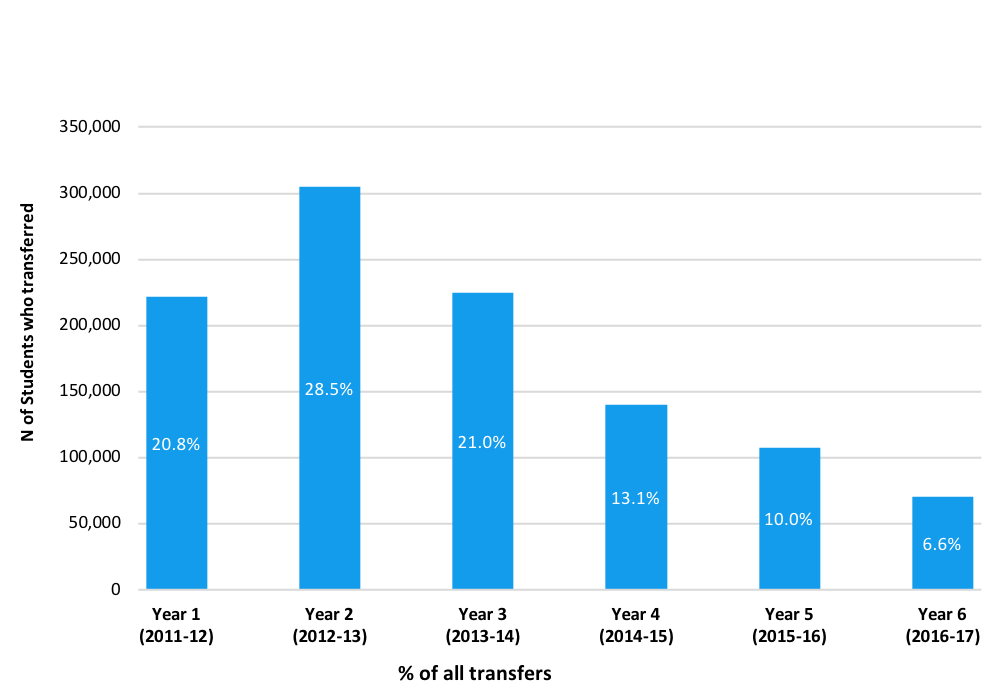
*This figure is based on data shown in Appendix C, Table 14.
SECTION 2: TRANSFER AND MOBILITY RATES BY INSTITUTIONAL SECTOR
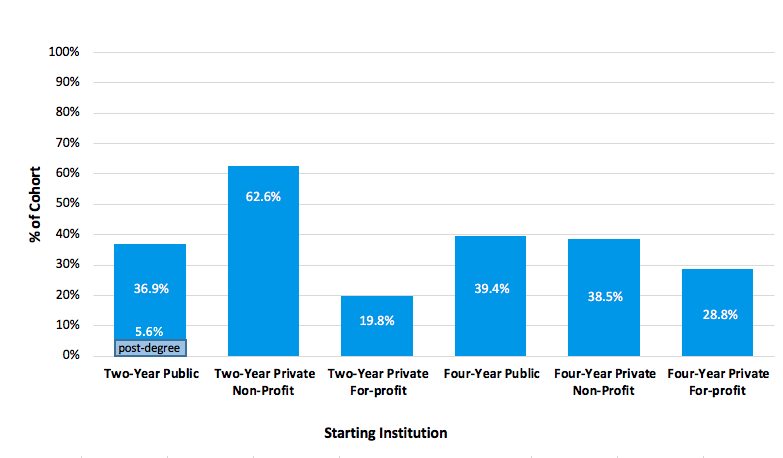
The transfer rate for students who started at two year institutions was 36.7 percent whereas the total transfer rate for students who started at all four year institutions was 38.5 percent (Figure 6). The transfer rate for students who started at two-year public institutions was 36.9 percent, including 5.6 percent who transferred after receiving a two-year certificate or degree (Figure 7). The transfer rate for students who started at four-year public and four-year private nonprofit institutions (39.4 percent and 38.5 percent, respectively) were both higher than the transfer rate for students who started at a two-year public institution (36.9 percent).
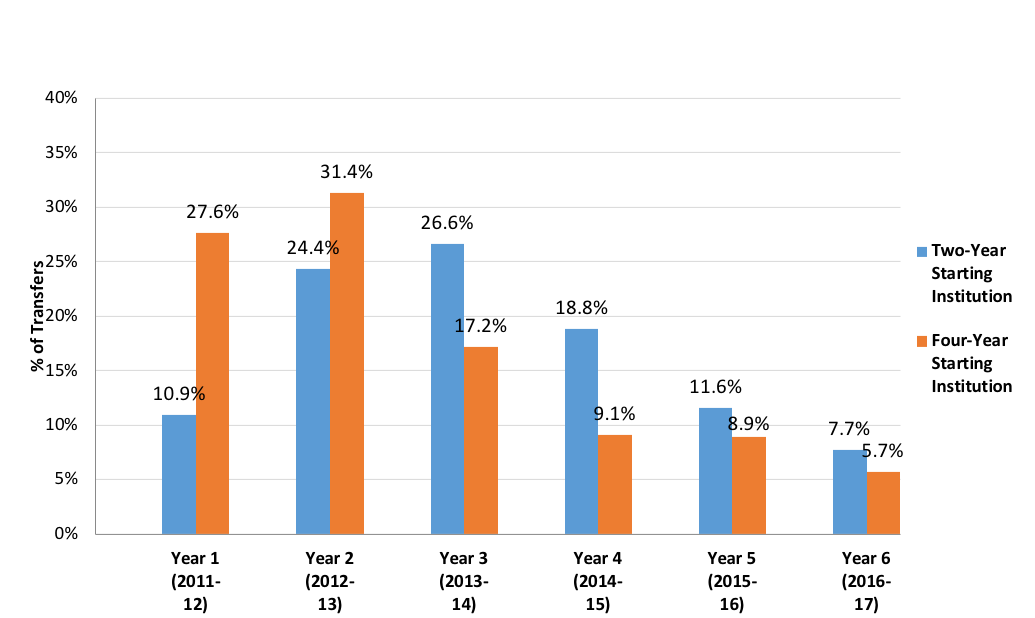
In section one of the results, we saw that the most common time of transfer overall was the second year of study. When disaggregated by the level of starting institution, another interesting pattern emerges: almost 60 percent of students who started at a four-year institution and transferred to another institution were more likely to transfer during the first (27.6 percent) and second year (31.4 percent) whereas almost half of all transfers for students who started at two-year institutions occurred in the second (24.4 percent) and third (26.6 percent) year (Figure 8).
Figure 6. Overall Transfer and Mobility of Students by Institutional Level, Fall 2011 Cohort*
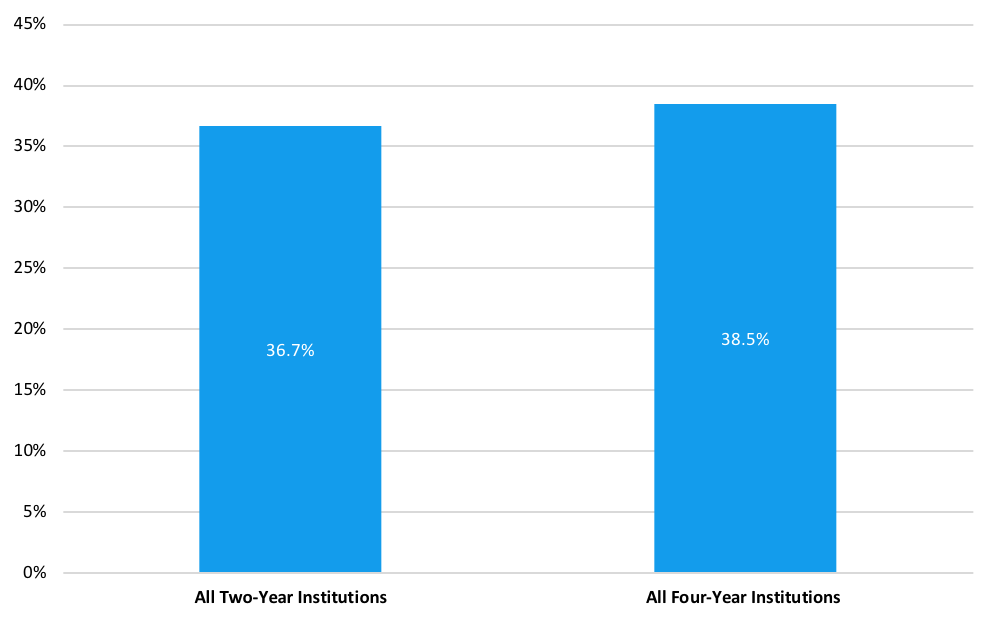
*This figure is based on data shown in Appendix C, Table 7.
Figure 7. Transfer and Mobility of Students Who Transferred/Did Not Transfer 2011–2017 by Sector and Control of Starting Institution, Fall 2011 Cohort*
*This figure is based on data shown in Appendix C, Table 7.
Figure 8. Timing of Initial Transfer by Level of Starting Institution, Fall 2011 Cohort*
*This figure is based on data shown in Appendix C, Table 20.
SECTION 3: TRANSFER AND MOBILITY PATTERNS BY STARTING AND DESTINATION INSTITUTIONS
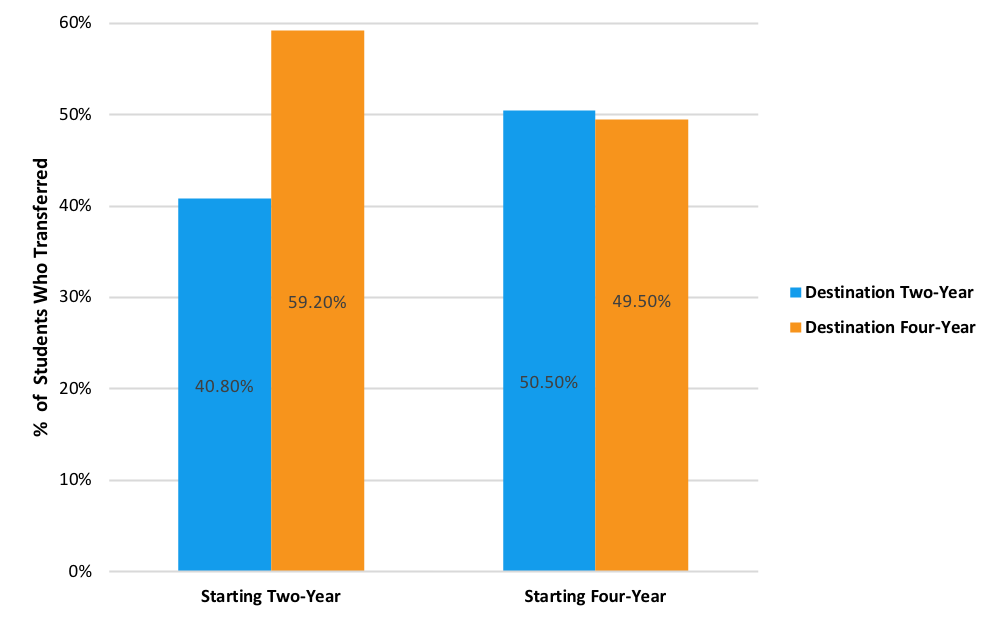
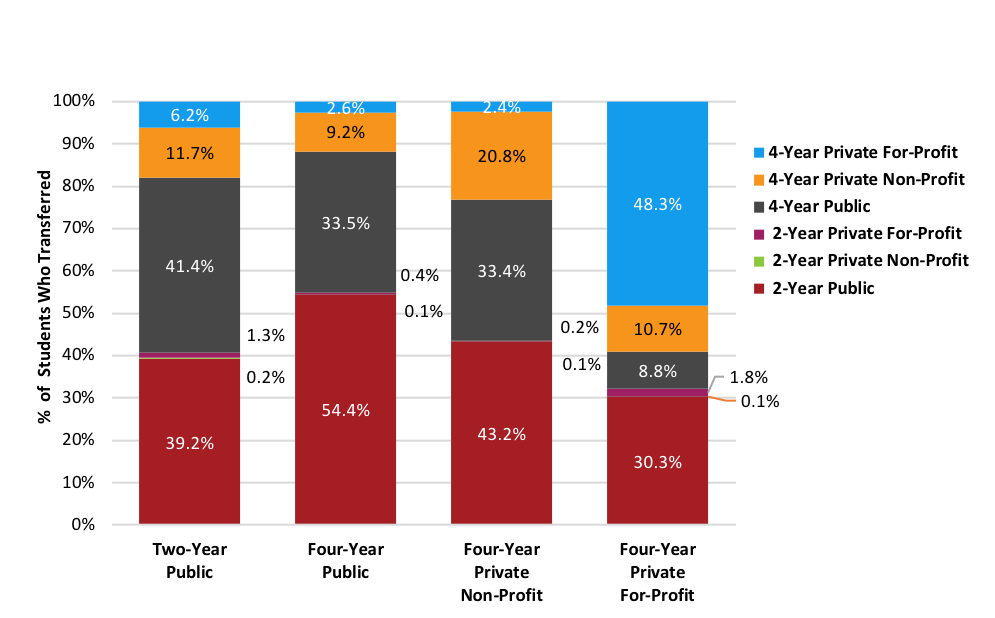
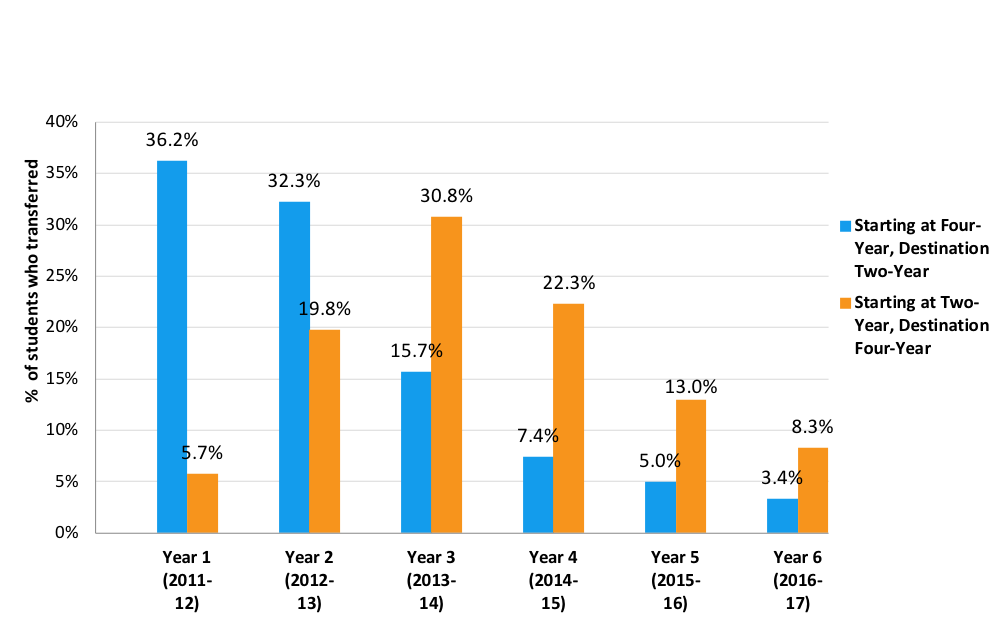
Out of all students who transferred from a two-year institution, 59.2 percent transferred to a four-year institution (Figure 9). For students who transferred from a four-year institution, half transferred to a two-year institution (50.5 percent). When disaggregated by sector (Figure 10), the results reveal that of the students who started at two-year public institutions, most transfers were to four-year public institutions (41.4 percent), while 39.2 percent were lateral to another two-year public institution. In terms of transfer timing, over half of all two to four year transfers occurred during the third and fourth years of studies (30.8 percent and 22.3 percent, respectively) whereas most four- to two-year transfers occurred earlier, in the first and second years (36.2 and 32.3, respectively, Figure 11).
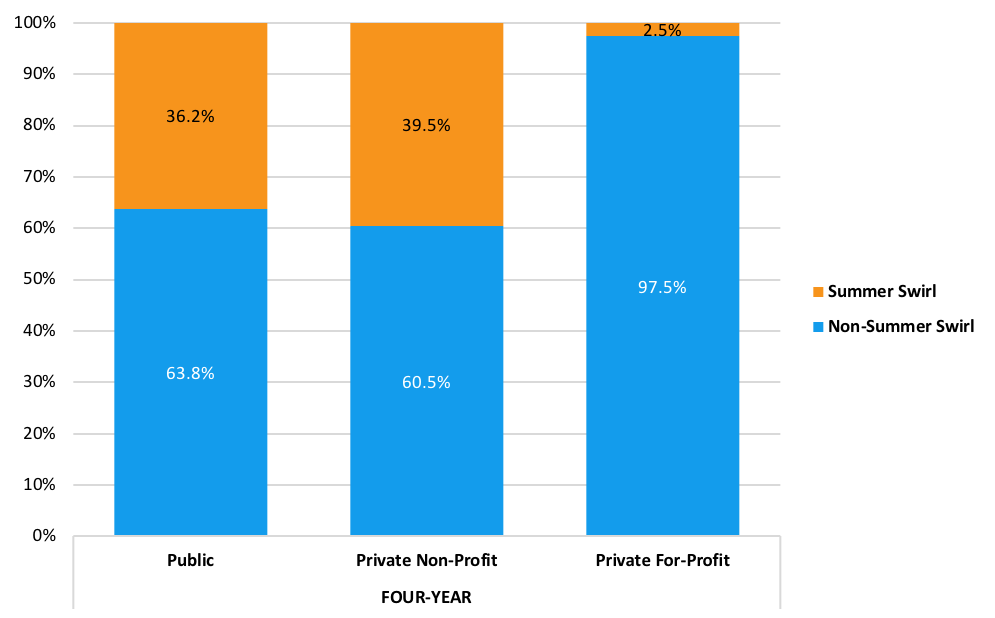
In terms of summer swirling, defined as enrollment in a two-year institution only during a summer term with a return to the starting four-year institution the following fall (Figure 12), the results show that for four-year public and private nonprofit starters, more than one-third of mobility to two-year institutions consisted of summer swirlers (36.2 percent and 39.5 percent, respectively). For students who started at a four-year private for-profit institutions, only 2.5 percent were summer swirlers.
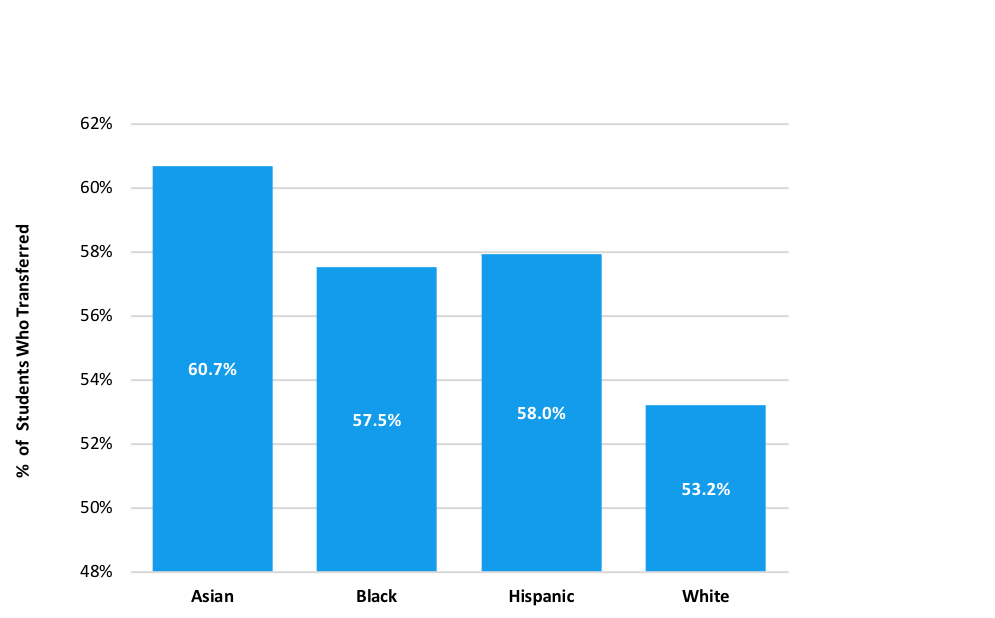
Within each racial and ethnic category measured, over half of the students who transfer from a four-year institution go to a two-year institution (Figures 13 and 14). However, Figure 15 shows that Asian and White students who do so are more likely to be swirling (45.6 percent and 40.6 percent of four-to-two year transfers, respectively) than Black and Hispanic students (26.5 percent and 32.8 percent, respectively).
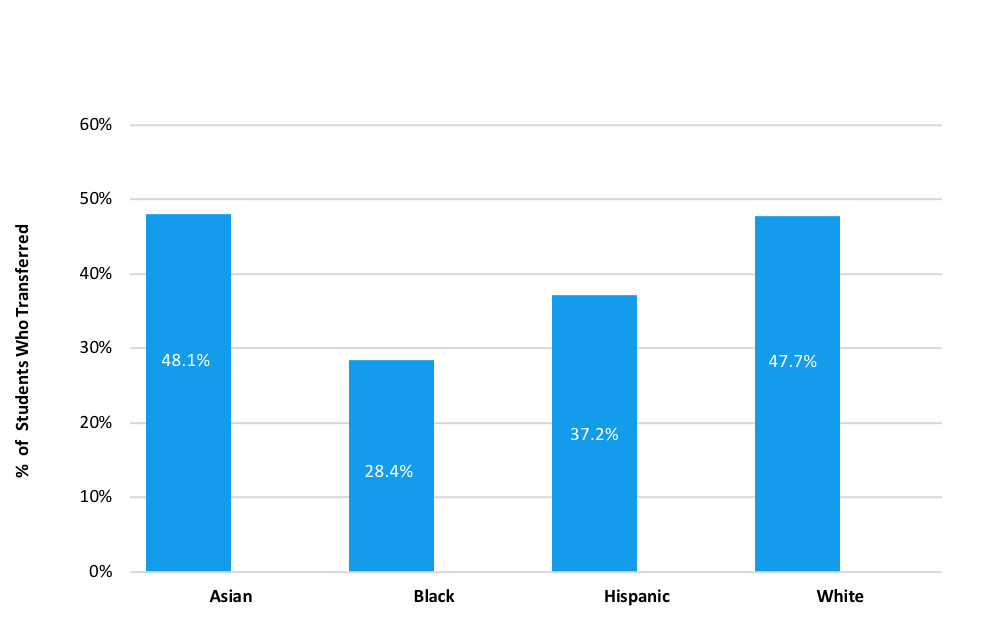
For students who start at a two-year institution, Asian and White students are more likely to go to a four-year institution (48.1 percent and 53.2 percent of transfers, respectively) than Black and Hispanic students (28.4 percent and 37.2 percent, respectively). As suggested in previous reports, these results continue to emphasize the important role that community colleges play in terms of meeting the needs of the transfer student population as well as show the disparities that exist in the community college-to-four-year transfer rates among students of different racial and ethnic background.
Figure 9. Destination of First Transfer or Mobility 2011-2017 by Level of Starting institution, Fall 2011 Cohort*
*This figure is based on data shown in Appendix C, Table 9a.
Figure 10. Destination of First Transfer or Mobility 2011–2017 by Sector and Control of Starting Institution, All Transfer Students, Fall 2011 Cohort*
*This figure is based on data shown in Appendix C, Table 9b.
Figure 11. Timing of Initial Transfer by Level of Starting and Destination Institutions, Fall 2011 Cohort*
*This figure is based on data shown in Appendix C, Table 20.
Figure 12. Percentage of Summer and Non-Summer Swirlers in All Four-Year to Two-Year Transfers by Sector, Fall 2011 Cohort*
*This figure is based on data shown in Appendix C, Table 8a.
Figure 13. Percent of Transfers from Two-Year Public to Four-Year Public Institutions by Race and Ethnicity, Fall 2011 Cohort*
*This figure is based on data shown in Appendix C, Table 10.
Note: Includes post degree transfers from 2 year public institutions ( n= 47,555 ).
Figure 14. Percent of Transfers from Four-Year Public to Two-Year Public Institutions by Race and Ethnicity, Fall 2011 Cohort*
*This figure is based on data shown in Appendix C, Table 10.
Figure 15. Percentage of Summer and Non-Summer Swirlers in All Four-Year to Two-Year Transfers by Race and Ethnicity, Fall 2011 Cohort*
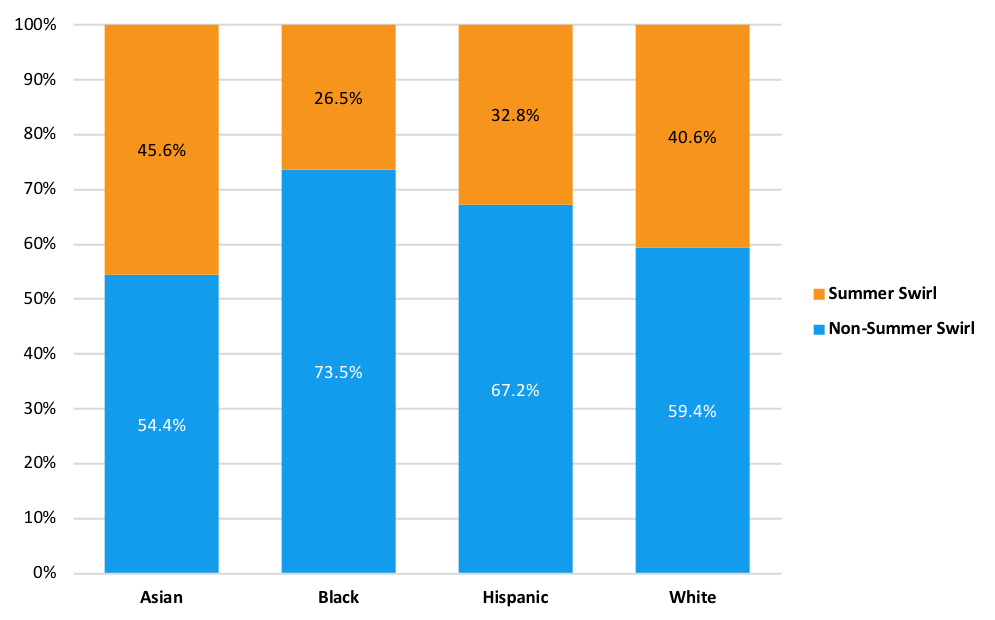
*This figure is based on data shown in Appendix C, Table 13.
SECTION 4: TRANSFER AND MOBILITY ACROSS STATES
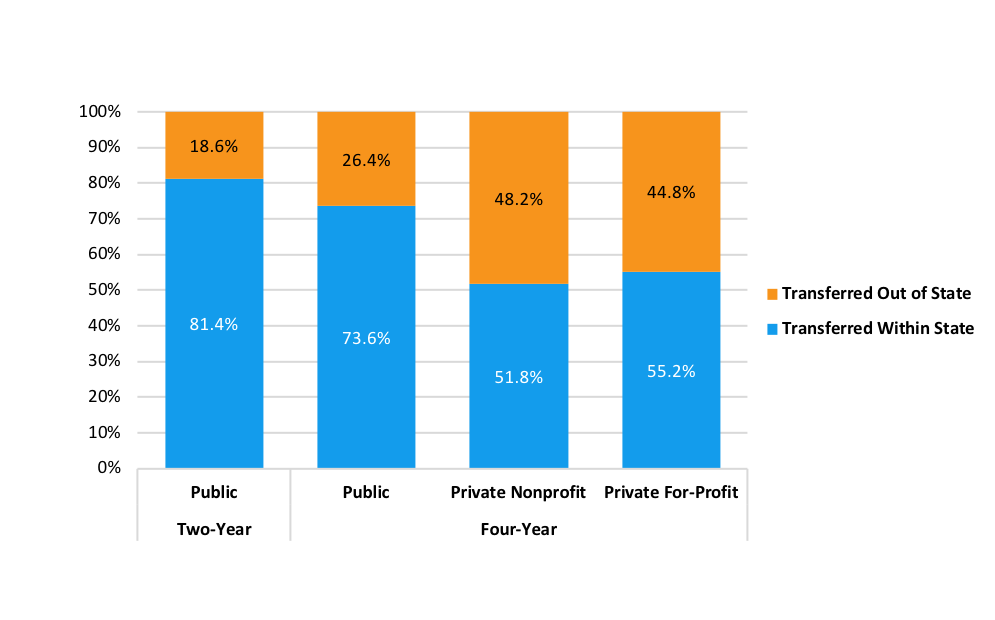
Figure 16 shows the transfer patterns within and across state lines. The focus is on whether the destination institution is in the same state as the starting institution, regardless of the student’s state of residence. Students who started their postsecondary education at multistate institutions (i.e., institutions with branches in more than one state) were excluded from this analysis. Specifically, several for-profit institutions fall into the multistate category and, thus, are not included in Figure 16.
Crossing a state line when transferring is less common in the public sector. About a fifth of transfer students (18.6 percent) who started in public two-year institutions, and over a quarter of those from public four-year institutions (26.4 percent), continued their studies at an institution in a different state.
Figure 16. Transfer and Mobility Within State and Out of State 2011–2017 by Sector and Control of Starting Institution, All Transfer Students, Fall 2011 Cohort*
*This figure is based on data shown in Appendix C, Table 16.
Discussion
Highlights from the Report
The overall six year transfer and mobility rate for the 2011 first-time cohort of students was 38.0 percent. In other words, almost two in five of the students who began their postsecondary career in fall 2011 had enrolled in more than one institution within six years and before earning a bachelor’s degree.
The transfer rate for students who started at a four-year institution, regardless of sector, was slightly higher (38.5 percent) than for students who started at a two-year institution (37.1 percent). For those who started at a two-year public institution, 5.6 percent of students transferred after earning a degree at their starting institution.
The primary transfer destination for two-year starters was a four-year institution (50.5 percent of transfers) whereas the primary destination for four-year starters was a two-year institution (59.2 percent of transfers).
Out of all four- to two-year transfers, over one in three were summer swirlers (36.2 percent).
A large majority of the four to two-year transfers occurred early, during the first and second years (68.5 percent). Over half of the two to four-year transfers, however, occurred later, during the third and fourth years (53.3 percent).
Among those who transferred from a two-year institution, Asian and White students were more likely to transfer into four-year institutions (49.8 percent and 50.4 percent, respectively) than Black and Hispanic students (33.2 percent and 39.5 percent, respectively).
Among those who transferred from a four-year to a two-year institution, Asian and White students were more likely to have done so during the summer only (45.6 percent and 40.6 percent, respectively) than Black and Hispanic students (26.5 percent and 32.8 percent, respectively).
Trends in Transfer and Mobility
It is important to note that some longitudinal patterns were due to changes to the cohort definition. However, all of the trends discussed in this section reflect a change in the same direction, regardless of how the cohort was defined. See the Methodological Notes in Appendix C for a more thorough discussion of cohort definitional changes.
The previous report in the Transfer and Mobility series focused on the fall 2008 cohort. Over the intervening three years, the transfer rate has increased slightly, from 37.2 percent for the 2008 cohort to 38.0 percent for the 2011 cohort.
The overall increase in transfers mainly stemmed from students who started at four-year institutions, where the transfer rate increased from 34.7 percent to 38.5 percent. Further analysis reveals that within these transfers, summer swirling to two-year public institutions increased over 10 percentage points from 25.3 percent to 36.1 percent. This indicates that students who start at a four-year institution are more likely than before to take classes at a two-year institution during the summer and return to their starting institution in the fall, either to bolster academic preparedness or to supplement credits.
This trend is perhaps not surprising considering the student population in 2008 and 2011. The 2008 fall cohort tended to be older, part-time students taking classes not necessarily to complete a degree, but to enrich their skill set for employability (Shapiro, et al., 2015). The 2011 cohort were more traditional aged, full-time students looking to complete a degree (Shapiro et al., 2017a). As a result, students may be more inclined to complete their four-year degree by supplementing their credits at a community college, which may accelerate degree completion while simultaneously cutting down costs.
Student Transfer and Mobility to and from Two-Year Institutions
Two-year institutions served almost 1.5 million students of the fall 2011 cohort, including those who started in two year institutions and those who transferred. This figure represents more than half of the entire fall 2011 cohort and all transfers, indicating that two-year institutions not only served most of the starting cohort, but also most of the transfer population as well.
Out of all first-time students who began their postsecondary education at a two-year institution, 37.1 percent had transferred to a different institution within the six-year study period, with 5.6 percent transferring with a two-year credential.
There was a notable difference in the timing of transfers to and from two-year institutions. Four-year transfers to a two-year institution occurred early, during the first and second year (68.5 percent of such transfers). However, over half of all vertical transfers occurred later, between years three (31.0 percent) and four (22.3 percent).
The early four- to two-year and delayed two- to four-year transfer patterns have several implications. First, the high proportion of early four- to two-year transfers may indicate that two-year institutions have the capacity to meet the postsecondary needs of both four-year students who discover that a four-year institution is not where they belong as well as four-year students looking to supplement their academic requirements. Second, two-year students who transfer to four-year institutions likely bring some significant coursework to the four-year institution. If this logic is combined, then many two-year students who transfer to four-year institutions should be able to complete their four-year degree sooner. However, our Tracking Transfers report shows that of the two- to four-year transfers, less than half (42.2 percent) complete a bachelor’s degree within six years of starting at the community college (Shapiro, et al., 2017b). While it may be argued that this time is not enough to complete a bachelor’s degree, it nonetheless shows the need for policymakers and educational researchers to identify the needs of two- to four-year transfer students and ways in which institutions can work together to address those needs.
Two-Year Public Institutions Continue to be the Most Prevalent Transfer Destination for Students Who Started in Four-Year Institutions
The results showed that over half (54.9 percent) of those who transferred from four-year public institutions moved to a two-year public institution. Among those who transferred from four-year private nonprofit institutions, 43.5 percent enrolled in a two-year public institution. The proportion for transfers from four-year private for-profit institutions was less at 32.3 percent. Overall, community colleges play a unique role in postsecondary student education. Not only do these institutions serve their own students’ needs for academic, vocational, and adult education, they also provide a foundation for students to continue their education at a four-year institution.
Transfer and Mobility for Students in Four-Year Institutions
The overall transfer rate for those who started at a four-year institution was 38.5 percent, which as previously discussed, represents a slight increase from the 2008 cohort. This trend mainly stemmed from the increase in summer swirlers, where the fall 2011 cohort of students are more likely than before to take summer classes at a different institution before returning back to their starting institution. While the summer swirling trend has increased from the fall 2008 cohort, two-year public institutions were to be the most popular transfer destination for four-year students in both cohorts.
Students who began in four-year public and in private nonprofit institutions had similar transfer rates (39.4 percent and 38.5 percent, respectively). Differences emerged when the transfers were disaggregated by the destination institutions. Specifically, four-year public starters were more likely to transfer to a two-year public institution (54.9 percent) than four-year private nonprofit starters (43.5 percent). Further, four-year private nonprofit starters were more than twice as likely to transfer to another four-year private nonprofit school than students who started at a four-year public school (20.8 percent versus 9.2 percent, respectively). However, the top transfer destination for both these groups of students was two-year public institutions.
Transfer and Mobility Rates by Race and Ethnicity
Overall results show that there is surprisingly little variation in total transfer rates by race and ethnicity. The differences only emerge when focusing on specific transfer pathways and mobility patterns. Regardless of race or ethnic background, for example, most of the four-year transfers were to two-year institutions. When disaggregated by summer swirlers and non-summer swirlers, however, the results showed that Asian (45.6 percent) and White (40.6 percent) students who transfer to a two-year institution were substantially more likely to be summer swirling than Black (26.5 percent) and Hispanic (32.8 percent) students.
For students who started at a two-year institution, results revealed that Asian (48.1 percent) and White (47.7 percent) students were much more likely to transfer to a four-year institution than Black (28.4 percent) and Hispanic (37.2 percent) students. Overall, these findings reveal that Asian and White students are more likely to supplement their four-year coursework at a two-year institution as well as continue their education at a four-year institution than Black and Hispanic students.
Out-of-State Transfer and Mobility
Many students who transfer continue their postsecondary education in a different state, especially for students who start at four-year private institutions. Nearly half of students who started at four-year private nonprofit institutions and for-profit institutions transferred out-of-state (48.2 percent and 44.8 percent, respectively). Although the proportion of out-of-state transfers was much smaller for those who started at public institutions, nearly one in five transfers (18.6 percent) from two-year public institutions and over one in four (26.4) from four-year public institutions continued their postsecondary education in a different state.
Out of all students who transferred, regardless of the starting institution, the out-of-state transfer rate for the fall 2011 cohort was 27.2 percent. Since state longitudinal data systems are generally limited to enrollments at institutions within state boundaries, these students would typically be incorrectly counted as stop-outs, often with negative implications for institutions with performance-based funding
Implications for Policymaking
The fall 2011 cohort consisted of 2.8 million first-time students. Within their first six years, over one million of them continued their studies at a different institution. The fall 2011 student population represents a changing student landscape, especially for two-year schools. Community colleges are serving the needs of many former and swirling four-year students while simultaneously preparing their own students for associate degrees, transfer into four-year institutions, and essential training for the workforce.
Community colleges serve a diverse group of students, from those seeking industry credentials to those ultimately seeking a bachelor’s degree. In this study, the enrollment patterns suggest that most vertical transfer students bring between two to three years’ worth of course experience to their four-year destination. If four-year students can attend two-year institutions to supplement their four-year degree requirements, then policies can certainly be put into place to help vertical transfer students successfully transfer more credits to their four-year institution. However, in order for that to occur, both two-and four-year institutions will need to work in partnership to create the appropriate policies and procedures to alleviate the barriers surrounding the two-to-four-year pathway. This is particularly important because two-year institutions have long served as a gateway for students who face financial and/or academic barriers to four-year institutions and many of these students tend to be from from social groups, traditionally not well-served by higher education.
The national transfer statistics provided here show that student mobility is diverse, complex and increasing. We hope that the information presented will help practitioners and policy makers to better understand the realities of student mobility today, and to better serve the needs of mobile students tomorrow.
References
Adelman, C. (2006, February). The tool box revisited: Paths to degree completion from high school through college. Washington, DC: U.S. Department of Education, Office of Vocational and Adult Education.
Borden, V. M. H. (2004). Accommodating student swirl. Change, 36(2), 10-17.
de los Santos, A., Jr., and Wright, I. (1990). Maricopa’s swirling students: Earning one-third of Arizona State’s bachelor’s degrees. Community, Technical, and Junior College Journal, 60(6), 32-24.
Dougherty, K. J., & Kienzl, G. S. (2006). It’s not enough to get through the open door: Inequalities by social background in transfer from community colleges to four-year colleges. Teachers College Record, 108(3), 452-487.
Doyle, W. R. (2009). Impact of increased academic intensity on transfer rates: An application of matching estimators to student-unit record data. Research in Higher Education, 50, 52-72.
Eagan, K. M. & Jaeger, A.J. (2009). Effects of exposure to part-time faculty on community college transfer. Research in Higher Education, 50, 168-188.
Education Commission of States [ECS] (2014). Transfer and articulation: All state profiles. Retrieved from
Fink, J., & Jenkins, D. (2017). Takes Two to Tango: Essential Practices of Highly Effective Transfer Partnerships. Community College Review, 45(4), 294-310.
Goldrick-Rab, S. & Pfeffer, F. T. (2009). Beyond access: Explaining socioeconomic differences in college transfer. Sociology of Education, 82, 101–125.
Hossler, D., Shapiro, D., Dundar, A., Ziskin, M., Chen, J., Zerquera, D., & Torres, V. (2012, February). Transfer and mobility: A national view of pre-degree student movement in postsecondary institutions (Signature Report No.2). Herndon, VA: National Student Clearinghouse Research Center.
McCormick, A. (2003). Swirling and double-dipping: New patterns of student attendance and their implications for higher education. New Directions for Higher Education, 121, 13-24.
Monaghan, D. B., & Attewell, P. (2015). The community college route to the bachelor’s degree. Educational Evaluation and Policy Analysis, 31(1), 70-91.
Shapiro, D., Dundar, A., Huie, F., Wakhungu, P.K., Yuan, X., Nathan, A. & Bhimdiwali, A. (2017a, December). Completing College: A National View of Student Completion Rates – Fall 2011 Cohort (Signature Report No. 14). Herndon, VA: National Student Clearinghouse Research Center.
Shapiro, D., Dundar, A., Huie, F., Wakhungu, P.K., Yuan, X., Nathan, A. & Hwang, Y. (2017b, September). Tracking Transfer: Measures of Effectiveness in Helping Community College Students to Complete Bachelor’s Degrees (Signature Report No. 13). Herndon, VA: National Student Clearinghouse Research Center.
Shapiro, D., Dundar, A., Wakhungu, P.K, Yuan, X., & Harrell, A. (2015, July). Transfer and Mobility: A National View of Student Movement in Postsecondary Institutions, Fall 2008 Cohort (Signature Report No. 9). Herndon, VA: National Student Clearinghouse Research Center.
U.S. Department of Education. National Center for Education Statistics. (2001). High School Academic Curriculum and the Persistence Path Through College, NCES 2001–163, by Laura Horn and Lawrence K. Kojaku. Project Officer: C. Dennis Carroll. Washington, DC: 2001.
Appendix A: Methodological Notes
OVERVIEW
This report describes the transfer activity of the fall 2011 cohort (N = 2,816,648) of first-time college students across the U.S. for six years through August 2017. The results presented show patterns in students’ enrollment in multiple postsecondary institutions, focusing on the sector and control of starting institutions (the colleges and universities in which students first enrolled) and of destination institutions (the institutions to which students first transferred). Public, private nonprofit, and private for-profit institutions are considered separately in the results, as are two- and four-year institutions in each of these categories. The designation “two-year institution” is used broadly to identify institutions offering both associate’s degrees and less than two-year degrees and certificates.
In addition to overall transfer pathways by institution type, the report includes results on transfer disaggregated by gender; race and ethnicity; age; enrollment intensity; an overview of transfer activity within and between states; and multiple views on the timing of student transfer by institution type and enrollment intensity.
NATIONAL COVERAGE OF THE DATA
The National Student Clearinghouse (NSC) is a unique and trusted source for higher education enrollment and degree verification. Since its creation in 1993, the participation of institutions nationwide with NSC has steadily increased. Currently, NSC data include more than 3,600 colleges and 96.8 percent of U.S. college enrollments. NSC has a 25-year track record of providing automated student enrollment and degree verifications. Due to its unique student-level record approach to data collection, the Clearinghouse data provide opportunities for robust analysis not afforded by more commonly used institution-level national databases.
Because NSC’s coverage of institutions (i.e., the percentage of all institutions in the NSC data) is not 100 percent for any individual year, weights were applied in this study by institution sector and control to better approximate enrollment figures for all institutions nationally. Using all IPEDS Title IV institutions as the base study population, sampling weights for enrollments at each institution type were calculated using the inverse of the rate of coverage for that sector (see Appendix B for further details).
The enrollment data used in this report provide an unduplicated headcount for the fall 2011 first-time-in-college student cohort. Clearinghouse data track enrollments nationally and are not limited by institutional and state boundaries. Moreover, because this database is comprised of student-level data, researchers can use it to link concurrent as well as consecutive enrollments of individual students at multiple institutions — a capability that distinguishes the Clearinghouse database from national databases built with institution-level data. For instance, in the National Center for Education Statistics (NCES) and the Integrated Postsecondary Education Data System (IPEDS) — one of the most widely used national data sets in postsecondary education research — concurrent enrollments remain unlinked and, therefore, are counted as representing separate individuals. There are nationally representative samples (e.g., National Education Longitudinal Study, NELS:88/2000; Beginning Postsecondary Students Longitudinal Study, Educational Longitudinal Study, ELS:02; etc.) that are based on student-level data. However, by definition samples have their limitations in terms of the currency of the data as well as its uses. For example, a nationally representative sample cannot be used to produce regional or state-level results. The Clearinghouse data do not have those limitations because of the frequency of the data collection and the near-census national coverage.
COHORT IDENTIFICATION, DATA CUT, AND DEFINITIONS
Focusing on the cohort of first-time students who began their postsecondary studies at U.S. colleges and universities in fall 2011, this report examines student transfer and mobility activity over six years through summer 2017. In defining the study cohort, it was necessary to identify a coherent set of first enrollment records that would as closely as possible represent a starting point for the fall 2011 cohort of first-time-in-college students. With this goal in mind, the researchers excluded enrollment records that were either (a) not clearly interpretable within the study’s framework and data limitations or (b) inconsistent with the experiences of first-time college enrollment and college transfer that were the focus of the analysis.
The study cohort was defined, therefore, as students who fulfilled all of the following conditions, according to the Clearinghouse data:
- enrolled in fall 2011 (defined as any term with a begin date between August 15-October 31, 2011, inclusive); if the institution had no term begin date during this period, then between June 1 and August 14, 2011, inclusive;
- did not receive any degree or certificate from a two- or four-year institution prior to fall 2011; and
- enrolled in at least one term in fall 2011 that was longer than 21 days.
Summer 2011 Semester Inclusions
In order not to exclude or misrepresent the pathways of students who were enrolled in college preparatory summer study, students who began their postsecondary studies in either summer or fall 2011 were included in the study. However, the summer 2011 enrollment records were not included in the analysis; fall 2011 enrollments were considered the first enrollment for all students selected for the cohort. To further verify that only first-time undergraduate students were included in the study, the Clearinghouse data were used to confirm that students included showed no previous college enrollment at any institution prior to June 1, 2011 and had not previously completed a degree at any institution at any time prior to fall 2011.
Changes to the Cohort Definition from Previous Reports
There were two major changes from prior Transfer and Mobility reports with regards to how the entering cohort of students was defined: all-years look-back for prior enrollments and exclusion of current dual-enrolled students.
1. All-years look-back for prior enrollments: Data limitations in previous reports limited our ability to search for previous enrollments in order to
establish first-time status, to within four years prior to the cohort year. Beginning with this year’s report, students with any prior non-dual enrollment, regardless of how far back in the Clearinghouse data that enrollment occurred, were removed from the cohort as non-first-time students.
2. Exclusion of current dual-enrolled students: Students who were 17 years old or younger during the fall 2011 semester were excluded from the dataset (i.e., current dual enrollment students). This was done to ensure that those who were simultaneously attending high school and postsecondary classes were not considered first-time college students.
Both of these changes had the effect of reducing the cohort size, particularly among students starting at two-year institutions. Accordingly, one effect of the new definition is that the two-year share of the cohort is five percentage points lower than it would have been under the old definitions. Despite these changes in the cohort definition, comparisons between the current results and results from past reports can be reliably conducted. These exclusions impact two-year sectors more so than at the four year sectors due to the removal of dual enrollments, which tend to occur more often at two year institutions than at four year institutions.
Table A-1 below shows selected transfer outcomes for the fall 2011 cohort under the new definitions as well as the old definitions, and the fall 2008 cohort under old definitions. These comparisons show that for four year starters, regardless of the cohort definition, the different transfer rates changed in the same direction. For example, regardless of the cohort definition, overall transfers as well as summer swirlers to two-year institutions have increased.
Table A-1
| 2011 Cohort with Current/New Definitions | 2011 Cohort with Old Definitions | 2010 Cohort (Old Definitions) | |
| Two Year Starters | |||
|
% of the overall cohort |
42.01% |
46.78% |
49.20% |
|
Overall transfer rate |
36.69% | 43.74% | 39.53% |
|
Two- to four-year public transfers |
41.37% | 48.59% | 42.17% |
| Four Year Starters | |||
|
% of the overall cohort |
58.01% | 53.22% | 50.81% |
|
Overall transfer rate |
38.51% | 35.77% | 34.73% |
|
Four- to two-year public transfers |
58.01% | 53.22% | 50.81% |
|
Non-summer transfers to two-year institutions |
75.32% | 76.30% | 83.57% |
|
Summer swirls to two-year institutions |
24.68% | 23.70% | 16.43% |
Former Dual Enrollment Students
The cohort used in this study includes former dual enrollment students: first-time college students in fall 2011 who had previously enrolled in college courses while still in high school. Students were identified as former dual enrollment students if their enrollment or degree record prior to fall 2011 was before the student turned 18 years old. Former dual enrollment students represent 15.91 percent of the overall fall 2011 cohort, 19.81 percent of the students who started in four-year public institutions, 12.79 percent of the students who started in two-year public institutions, and 16.19 percent of those who started in four-year private nonprofit institutions. Only 5.51 percent of the students who started in four-year private for-profit institutions had prior dual enrollments.
Concurrent Enrollment
As mentioned previously, NSC data provide an unduplicated headcount of U.S. college enrollments during each term, which allows following individuals across concurrent enrollment. To identify a primary enrollment record in fall 2011, concurrent enrollment is defined as enrollment at two or more institutions in which the term start and end dates overlapped by at least one day. A selection process was employed to determine the primary enrollment record of students who were concurrently enrolled during the fall 2011 term. First, the enrollment record lasting over 21 days was selected as the primary record. If both enrollment records were more than 21 days, then the enrollment record with the earliest term begin date was selected. If the term begin dates were also the same then the record with the latest term end date was selected. The student was dropped from the cohort if the enrollment record length, term begin date, and term end date were all the same.
Concurrent enrollment records occurring after fall 2011 were also examined and a primary enrollment record was selected from among the concurrencies for use in the transfer analysis. Concurrent enrollment was defined in this stage as two or more enrollment records in which the term start/end dates overlapped by 30 days or more. Primary enrollments after fall 2011 were selected using the following decision rules:
1. Continuing enrollment over changing enrollment: Continuing enrollment at the institution where the student had been enrolled during the previous term was selected over an enrollment at a different institution. This rule produces conservative results on the prevalence of transfer, since some students may use concurrent enrollments as a way of transitioning from one institution to the next.
2. Earlier term begin-date over later begin-dates: If a student was concurrently enrolled in two or more new institutions and no longer enrolled in his or her previous institution, the enrollment record with the earliest begin-date was selected as primary.
Enrollment Exclusions
In addition to the concurrent enrollment criteria for the inclusion of students in the cohort, the researchers also applied several decisions related to the inclusion of individual enrollment records, term to term. Enrollment records showing an end-date preceding the begin-date (a “negative” term length) and records exceeding 365 days in length were considered the result of reporting error and excluded from the analysis. In these cases, only the out-of-range enrollment record was excluded, while the student remained in the cohort. Students were also excluded if they had no fall 2011 enrollments lasting 21 days or longer.
Enrollments in multistate institutions — those with branches in more than one state — were included in the overall analyses but excluded from the state-to-state transfer analysis because these institutions typically report all student enrollments from a central location, regardless of the actual location of instruction. It should be noted that many large four-year for-profit institutions fall into the multistate category.
Enrollment Intensity
For this report, enrollment intensity is classified as either exclusively full time throughout the study period, exclusively part time throughout the study period, or mixed enrollment (including both full-time and part-time enrollments) across all terms in which the student was enrolled (thereby, including stop‐outs) through the first instance of transfer or, for those who never transferred, through the last enrollment period. By establishing students’ enrollment intensity in this way, enrollments during summer terms (defined as terms with both the start date and the end date falling between May 1 and August 31 in any given year) and short terms (defined as terms lasting less than 21 days) were excluded
from consideration.
For terms in which a student showed concurrent enrollment records (i.e., records that overlapped by 30 days or more), the two highest-intensity enrollments were combined. For example, a student concurrently enrolled half time at two institutions was categorized as enrolled full time for that term. For the purpose of determining intensity, we created one single enrollment record from a set of concurrent enrollment records. The enrollment status for the single enrollment record was defined as full-time if (1) the two highest-status enrollment records included at least one full-time enrollment, or one three quarter-time enrollment and one at least less than half-time enrollment; or (2) the two highest-status enrollment records both reflected half-time enrollment. The enrollment status for the single enrollment record is defined as half-time, if the two highest-status enrollment records included some combination of half-time and less than half-time enrollments, but no full-time enrollment, and no more than one half-time enrollment. It is important to reemphasize that this process was done only for students with concurrent enrollments.
For all other students did not show any concurrent enrollments, for each term under consideration (i.e., all terms except summer terms and short terms up through the first completion, or, if no completion, throughout the entire study period), the “exclusively full-time” designation was assigned to students whose status was full-time for all terms enrolled. The “exclusively part-time” designation was assigned to students whose status for each term under consideration was three quarter-time, half-time or less than half-time.
The category of mixed enrollment was applied to students who showed a combination of full-time and part-time status among the terms under consideration. Finally, students whose status indicated withdrawal but no full-time or part-time enrollments were randomly assigned to an enrollment intensity category.
Age Group
The study focused on three age groups, namely, 20 years old or younger, between 21 and 24 years old, and older than 24 years old. The first group “20 years old or younger” is defined to approximate enrollment immediately after high school, while the second group (“over age 20 through 24”) is meant to represent students who delay entry into postsecondary education for a few years after finishing high school. The final category included adult learners, defined as those who were older than 24 when they began college. For all categories, we define age as of the end of the 2011 calendar year (December 31, 2011). Students with birthdates of December 31, 1991, or later were placed in the first category. Those with birthdates between December 31, 1987, and December 30, 1991, inclusive, were categorized in the second group (“over age 20 through 24)”). Students with birthdates before December 31, 1987, were placed in the final category (“over 24 years old”).
Imputation of Values for Gender
The Clearinghouse’s coverage of student gender has increased dramatically for enrollments occurring in recent years. However, imputation of gender for the majority of enrollment records is still necessary in order to use the data for research studies using older cohorts. To meet this need, the Research Center developed an imputation process based on first names. Previously submitted name‐gender pairs throughout the Clearinghouse database are used to determine the probability of any first name being associated with either gender. To increase the accuracy of the imputation process, the Research Center also draws on name‐gender data from the Social Security Administration (SSA) and the U.S. Census Bureau.
Because the Clearinghouse collects transactional data, its data contain many more unique first names than the other sources. International students may also contribute to the large variety of first names submitted to the Clearinghouse. The imputation used only those pairs in which the name occurred in at least two instances and was associated with a single gender in at least 95 percent of the instances. The SSA and Census data sets were used to ensure that name‐gender pairs were consistent across every data set in which they occurred and to enhance the imputation process by contributing name‐gender pairs that did not occur in the Clearinghouse data.
Institutions reported student gender to the Clearinghouse for approximately two-thirds of all students included in this report. The imputation process that yielded additional gender codes produced a total gender coverage rate of
94 percent.
Race and Ethnicity Data Coverage
In the last two years, the Research Center has been able to produce research reports that include breakdowns by race and ethnicity. Initially we were able to do so using data collected from a random, nationally representative sample of institutions. In this report, increased reporting of race and ethnicity data allowed us to include nearly all institutions. However, the percentage of students with missing race and ethnicity data was 18 percent.
Defining Transfer
In this report, transfer is defined as enrollment subsequent to the fall 2011 term in an institution different from the one in which the student was enrolled during fall 2011 (the starting institution). This is provided that the student had not already completed a degree or certificate, unless the student had started at a two-year institution. For those who started at two-year institutions, change of the starting institution can take place before or after receiving a two-year credential. These types of enrollment patterns are defined as transfers regardless of subsequent enrollments (e.g., completion, returning to the starting institution, etc.).
The transfer rate reported here considers the student’s first instance of movement to a different institution, before receiving a bachelor’s degree and within a period of six years. For those students who began at two-year public institutions, we also include transfers that happened after receiving a degree at the starting two-year institution. This exception was made because of the importance of vertical transfer as a key success outcome for so many students at community colleges. While for many community college students a certificate or an associate’s degree is the end goal with no intent to transfer, in many states completion of an associate’s degree as part of the pathway to a bachelor’s degree is encouraged through policies that guarantee junior standing to students who complete an associate’s degree (ECS, 2014). Moreover, the common usage of transfer terminology for students who start in two-year institutions includes transfer after receiving an associate’s degree.
Therefore, even if a student enrolled at a new institution for a short time then returned to the starting institution, the enrollment pattern is still categorized as a transfer. The results presented in this report capture the extent to which students change institutions at least once (i.e., they identify the first instances of student transfer).
Data Limitations
The data limitations in this report center mainly on data coverage, the methods used for cohort identification, and the definition of key constructs, as outlined above.
In fall 2011, representation of private, for-profit institutions in the Clearinghouse data was lower than that of other institution types, with the proportion of coverage ranging from quite low for two-year private for-profit colleges (14 percent of institutions, weighted by IPEDS enrollments) to moderately low for four-year private for-profit institutions (66 percent). Participation of two-year private nonprofit institutions was also relatively low, at just 35 percent. For fall 2011, NSC data nevertheless offered near-census national coverage (99 percent) of public institutions, and
an overall coverage rate of 93 percent of U.S. postsecondary enrollments.
In order to correct for differences in coverage rates, enrollment data were weighted according to the level and control of each student’s starting institution in fall 2011. This accounts for the likelihood of finding a student in the NSC data in the original cohort, but not for the likelihood of finding the student again if he or she transfers to another institution. The frequency of transfer is thus underestimated in this report, particularly transfer to institutional sectors with lower coverage rates. That is, a student who transfers to a for-profit institution is less likely to be counted as transferred than a student who transfers to a public institution. In data explorations of this question, the researchers determined that overall transfer rates were underestimated for all starting institution categories and underestimated to a slightly higher extent for
for-profit institutions.
It is important, furthermore, to acknowledge limitations resulting from the cohort identification methods used in this report. Because NSC data do not include designations for class year, the researchers identified first-time undergraduate students via two indirect measures:
- no previous college enrollments recorded in StudentTracker® ever and
- no previous degree awarded in NSC’s historical degree data.
Given these selection criteria, the sample for this report may include students with more than 30 Advanced Placement (AP) and International Baccalaureate (IB). Moreover, because of inconsistencies in the historical depth of NSC degree data records, it is possible that a small number of graduate students are also included in the study cohort.
Selection of “primary enrollment records” from students’ concurrent enrollments introduces possible error because of the risk of selecting a primary enrollment record that is “wrong” (i.e., not what the student considered his or her primary enrollment).
The transfer definition used in the analysis for this report gives rise to further limitations. Because of the definition, transfer results shown in the report include students who returned to their starting institution after enrolling in a different institution, regardless of how long the student was enrolled in the “new” institution. For example, students “swirling” or taking classes at a different institution during the summer were identified as transfers, even if they returned to their starting institution in the subsequent fall term. We do, however, show the proportion of summer swirlers (i.e., transfers among students who started at four-year institutions that happen only in summer followed by a return to the starting four-year institution).