

Persistence & Retention – 2019
First-Year Persistence and Retention for Fall 2017 Cohort
- Of the 3.5 million students who enrolled in college for the first time in fall 2017, 74 percent or 2.6 million students persisted as of fall 2018.
- The overall first-year persistence rate has improved slightly, with a 2.2 percentage point gain between 2009 and 2017.
- New to this year’s report are the persistence rates for top five popular major fields in baccalaureate and sub-baccalaureate programs.
List of Figures
First-Year Persistence and Retention
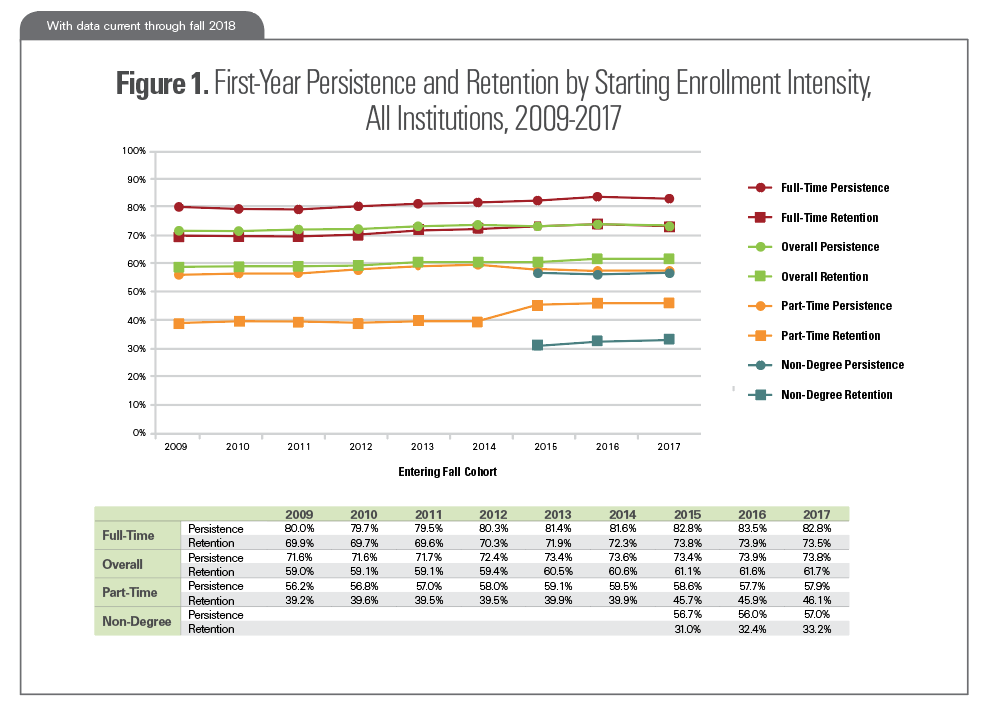
Figure 1. By Starting Enrollment Intensity, All Institutions, 2009-2017
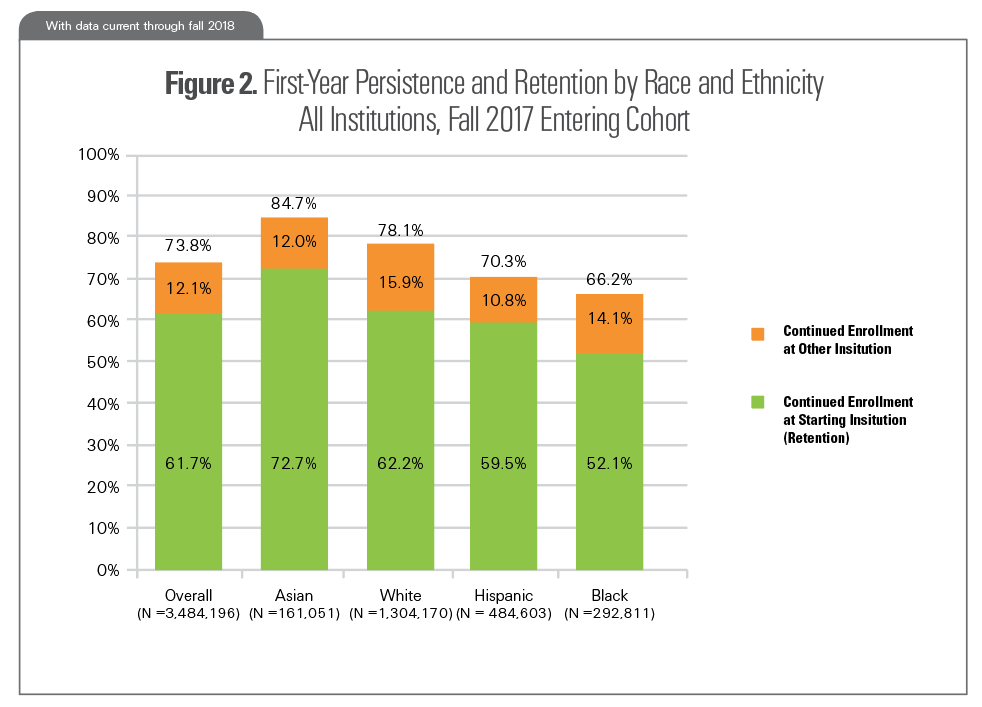
Figure 2. By Race and Ethnicity, All Institutions, Fall 2017 Entering Cohort
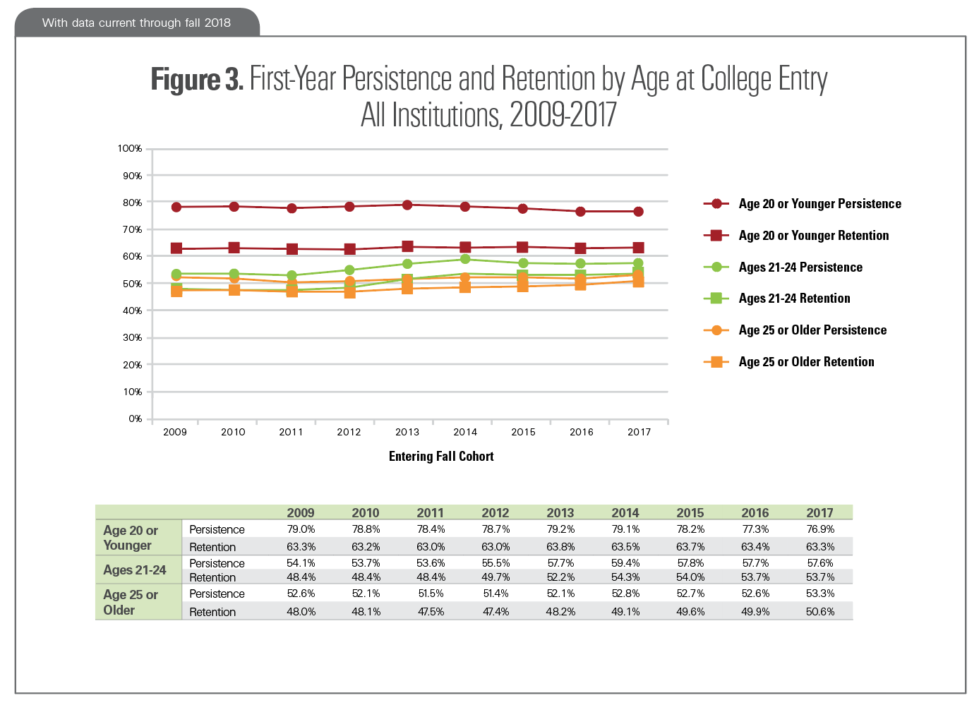
Figure 3. By Age at College Entry, All Institutions, 2009-2017
First-Year Persistence and Retention by Starting Institution Type
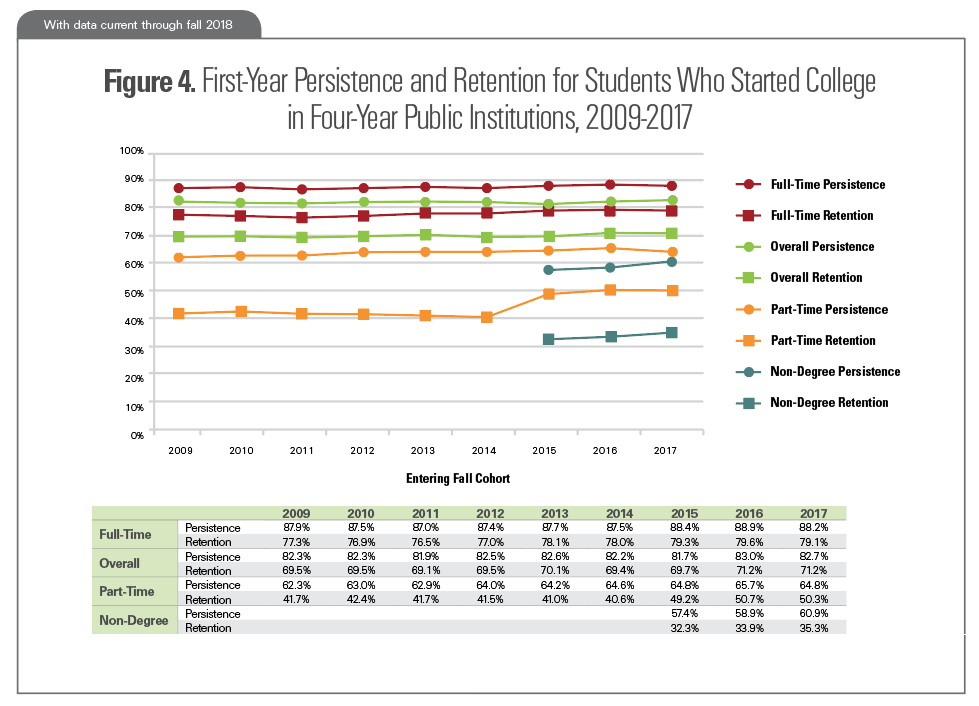
Figure 4. Four-Year Public Institutions, 2009-2017
Figure 5. Four-Year Public Institutions, Fall 2017 Entering Cohort by Race and Ethnicity
Figure 6. Two-Year Public Institutions, 2009-2017
Figure 7. Two-Year Public Institutions, Fall 2017 Entering Cohort by Race and Ethnicity
Figure 8. Four-Year Private Nonprofit Institutions, 2009-2017
Figure 9. Four-Year Private Nonprofit Institutions, Fall 2017 Entering Cohort by Race and Ethnicity
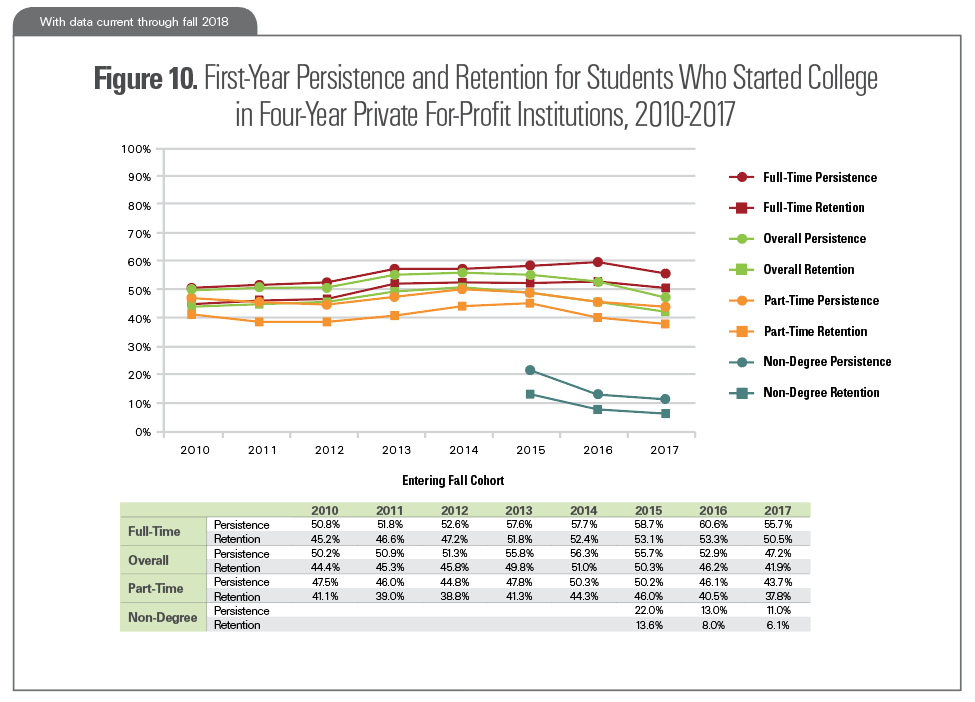
Figure 10. Four-Year Private For-Profit Institutions, 2010-2017
First-Year Persistence and Retention by Major Field
Figure 11. Top Five Popular Majors, Bachelor’s Degree Programs, Fall 2017 Entering Cohort
Figure 12. Top Five Popular Majors, Associate Degree Programs, Fall 2017 Entering Cohort
Figure 13. Top Five Popular Majors, Undergraduate Certificate Programs, Fall 2017 Entering Cohort
Overall Persistence and Retention Rates
Among all students who enrolled in college for the first time in fall 2017, 73.8 percent persisted at any U.S. institution in fall 2018, while 61.7 percent were retained at their starting institution. The “persistence rate” is measured by the percentage of students who return to college at any institution for their second year, while the “retention rate” is the percentage of students who return to the same institution. The overall persistence rate for the fall 2017 entering cohort remained virtually the same as that of the previous cohort, but this rate represents an increase of 2.2 percentage points compared to fall 2009. Over the past nine years ending in 2017, an average of 13 percent or one in eight students who started college in any fall term transferred to a different institution by the following fall.
Note: Prior to 2015, non-degree, non-certificate-seeking students were included in the full-time and part-time categories. This change is the cause of the jump in part-time retention rates from 2014 to 2015.
Refer to the last page of this report for additional definitions and notes on cohort selection. Download the data tables for this snapshot.
Persistence and Retention by Race and Ethnicity
Among students who for the first time entered college in fall 2017, Asians had the highest persistence rate (84.7 percent), with 72.7 percent returning to the starting institution and 12 percent returning to an institution other than the starting institution in fall 2018. Black students had the lowest persistence rate (66.2 percent): just over half of black students returned to the starting institution (52.1 percent) and an additional 14.1 percent continued at a different institution.
Note: Institutions provided race and ethnicity data to the Clearinghouse for 75 percent of the students reported in the fall 2017 entering cohort.
Refer to the last page of this report for additional definitions and notes on cohort selection. Download the data tables for this snapshot.
Persistence and Retention by Age at College Entry
Fall 2017 entering college students who were 21- to 24-years-old at college entry had a persistence rate of 57.6 percent. This represents an increase of 3.5 percentage points over the fall 2009 entering cohort. Students aged 20 or younger had a persistence rate of 76.9 percent, down 2.1 percentage points from the fall 2009 entering cohort. This group also showed the highest spread between persistence and retention rates, with about 15 percent, or one in seven students, enrolling in a different institution in their second fall term. Students aged 25 or older at college entry had a persistence rate of 53.3 percent, a figure that has remained essentially flat across all cohort years shown here.
Refer to the last page of this report for additional definitions and notes on cohort selection. Download the data tables for this snapshot.
Persistence and Retention: Starting at Four-Year Public Institutions
For students who started college in fall 2017 at four-year public institutions, the persistence rate was 82.7 percent, down 0.3 percentage points from the prior year, and up 0.4 percentage points in comparison to the fall 2009 cohort. The persistence rate was 88.2 percent for those who entered college on a full-time basis, compared to 64.8 percent for those who entered college on a part-time basis. Of all students who started college in this sector in fall 2017, 71.2 percent returned to the same institution in fall 2018.
Refer to the last page of this report for additional definitions and notes on cohort selection. Download the data tables for this snapshot.
Persistence and Retention by Race and Ethnicity: Starting at Four-Year Public Institutions
Among those students who for the first time started college at four-year public institutions in fall 2017, Asian students had the highest first-year retention rate, with 82.3 percent returning to the starting institution in fall 2018. Asians also had the highest persistence rate with 91.9 percent returning to any institution in fall 2018. White students had the highest share continuing college in fall 2018 at an institution other than the starting institution (15.1 percent). A similar share of black students continued college at a different institution (14.7 percent). Hispanic students and white students had similar first-year retention rates (68.3 and 70.8 percent, respectively).
Note: Data on student race and ethnicity are provided for 74 percent of the students in the fall 2017 entering cohort in four-year public institutions.
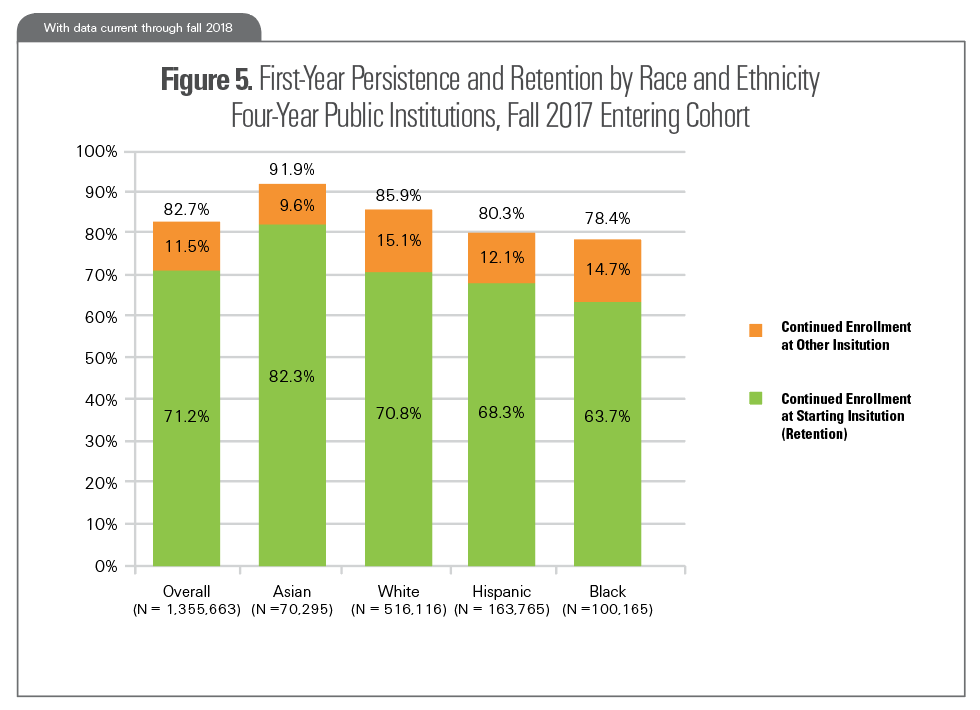
Refer to the last page of this report for additional definitions and notes on cohort selection. Download the data tables for this snapshot.
Persistence and Retention: Starting at Two-Year Public Institutions
For students who started college in fall 2017 at two-year public institutions, the persistence rate was 62.3 percent, up 0.1 percentage point from the prior year cohort, and up 1.3 percentage points in comparison to the fall 2009 cohort. The persistence rate was 69.7 percent for those who entered college on a full-time basis, compared to 56.3 percent for their part-time counterparts. Of all students who started college in two-year public institutions in fall 2017, 48.9 percent returned to the same institution in fall 2018. Many community college students are not continuous enrollees. They may return in the winter term of the second year after a stop-out, who are not captured in our measure of fall-to-fall persistence. Measuring persistence through a winter term may offer a more complete picture for sub-baccalaureate programs.
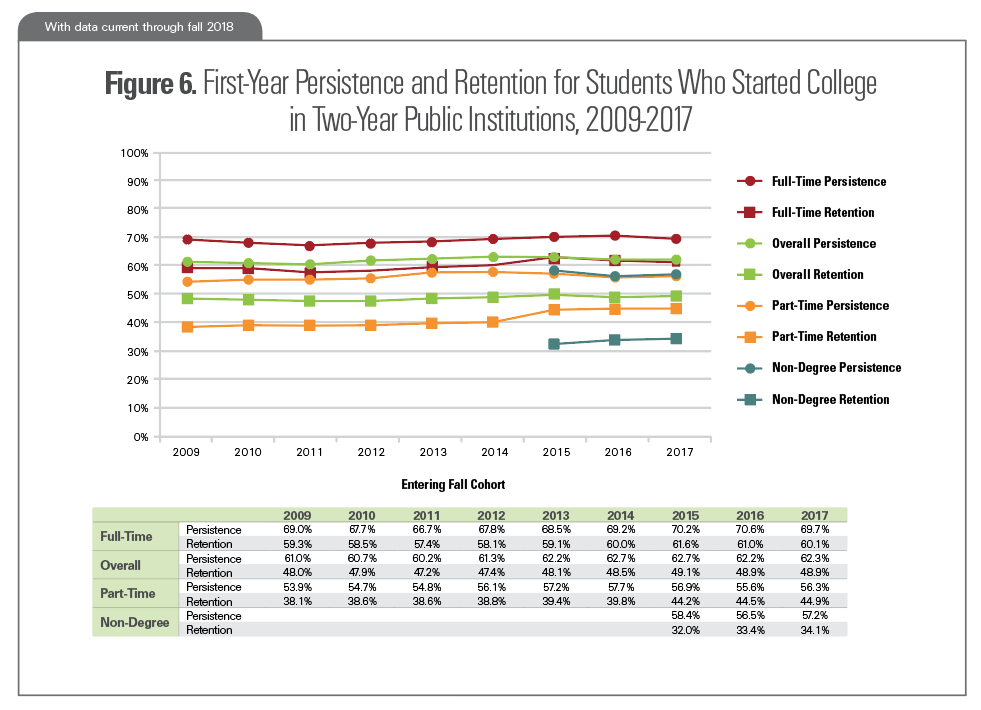
Refer to the last page of this report for additional definitions and notes on cohort selection. Download the data tables for this snapshot.
Persistence and Retention by Race and Ethnicity: Starting at Two-Year Public Institutions
Among students who entered college at two-year public institutions in fall 2017, white students had a higher first-year persistence rate (67.1 percent) than Hispanic students (62.1 percent). However, white students had a lower retention rate (49.6 percent) than Hispanic students (52.8 percent). This reflects the fact that white students are more likely than Hispanic students to transfer to other institutions by their second fall term. Black students had the lowest persistence rate (55.3 percent), with 42 percent returning to the starting institution and 13.3 percent continued enrollment at a different institution in fall 2018.
Note: Data on student race and ethnicity are provided for 78 percent of the students in the fall 2017 entering cohort in two-year public institutions.
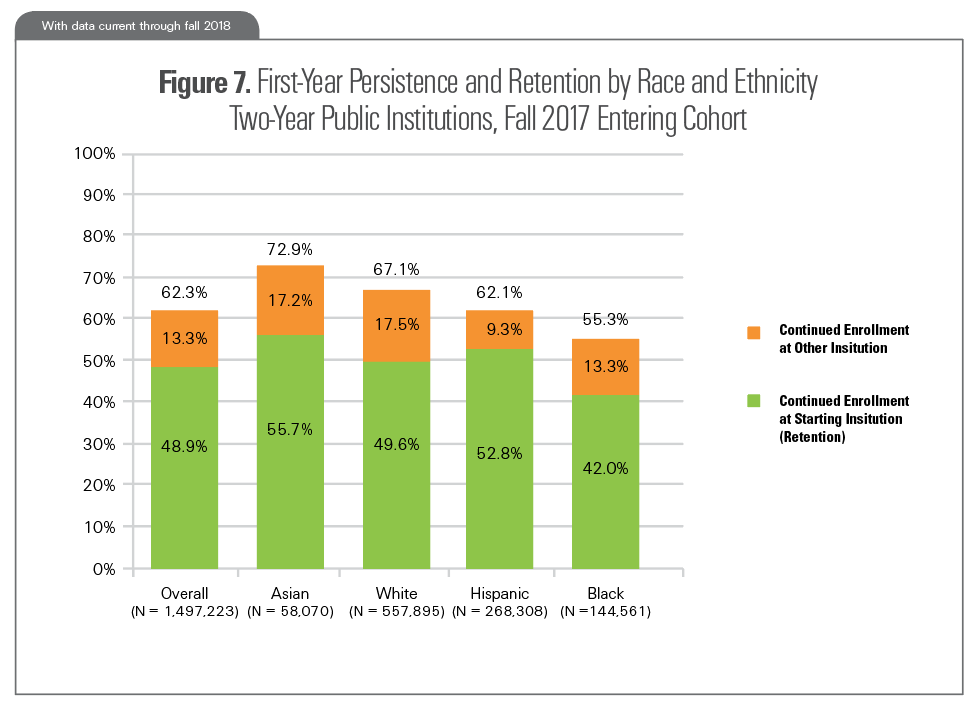
Refer to the last page of this report for additional definitions and notes on cohort selection. Download the data tables for this snapshot.
Persistence and Retention: Starting at Four-Year Private Nonprofit Institutions
For students who started college in fall 2017 at four-year private nonprofit institutions, the persistence rate was 85.1 percent, up 0.1 percentage point from the prior year cohort, and down 2.4 percentage points in comparison to the fall 2009 cohort. The persistence rate was 90 percent for those who entered college on a full-time basis, compared to 64.2 percent for their part-time counterparts. Of all students who started college in this sector in fall 2017, 74.1 percent returned to the same institution in fall 2018.
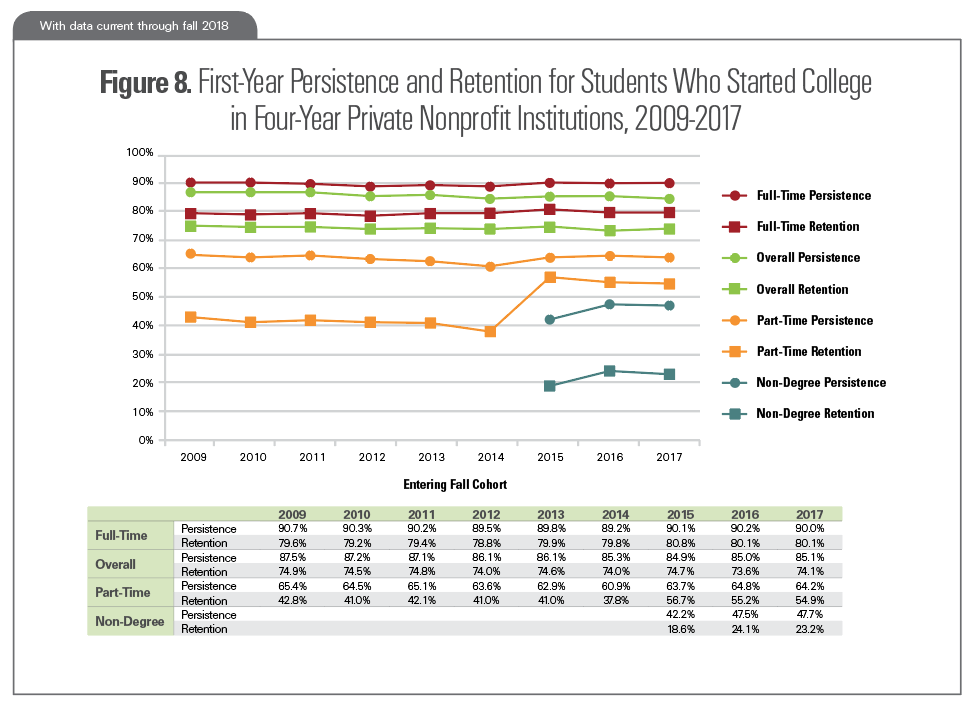
Refer to the last page of this report for additional definitions and notes on cohort selection. Download the data tables for this snapshot.
Persistence and Retention by Race and Ethnicity: Starting at Four-Year Private Nonprofit Institutions
Among students who for the first time entered college at four-year private nonprofit institutions in fall 2017, white and Asian students had similar first-year persistence rates (89.4 percent and 90.7 percent, respectively), but Asian students were more likely to continue college at their starting institution (82.5 percent compared to 75.1 percent for white students).
Note: Data on student race and ethnicity are provided for 71 percent of the students in the fall 2017 entering cohort in four-year private nonprofit institutions.

Refer to the last page of this report for additional definitions and notes on cohort selection. Download the data tables for this snapshot.
Persistence and Retention: Starting at Four-Year Private For-Profit Institutions
For students who started college in four-year private for-profit institutions, the persistence rate was 47.2 percent, down 5.7 percentage points from the prior year cohort, and down 3 percentage points in comparison to the fall 2010 cohort. The persistence rate was 55.7 percent for those who entered college on a full-time basis, compared to 43.7 percent for those who entered college on a part-time basis. Of all students who started college in this sector in fall 2017, 41.9 percent returned to the same institution in fall 2018.
Note: race and ethnicity data for the four-year private for-profit institutions cover only 59% of the fall 2017 entering cohort students in this sector, no disaggregated data by race and ethnicity are shown for this sector.
Refer to the last page of this report for additional definitions and notes on cohort selection. Download the data tables for this snapshot.
Persistence and Retention: Top Five Popular Majors, Bachelor’s Degree Level
An additional method for examining students’ first-year persistence in degree-granting institutions is based on the major fields and the programs a student first entered. This new analysis reveals the disparities in student persistence across majors and program levels, regardless of the type of institution a student started. Among the five most popular majors for the fall 2017 entering cohort students in baccalaureate programs, the persistence rate in engineering majors ranked first (92.8 percent). Biology and Biomedical majors followed closely at 91.6 percent. Compared to Engineering majors, Liberal Arts and Humanities or Health-related majors were more likely to have transferred to another institution by their second year.
Note: Institutions submit enrollment data by award levels and by major fields, which cover 97 percent of the fall 2017 entering cohort students reported by the IPEDS.
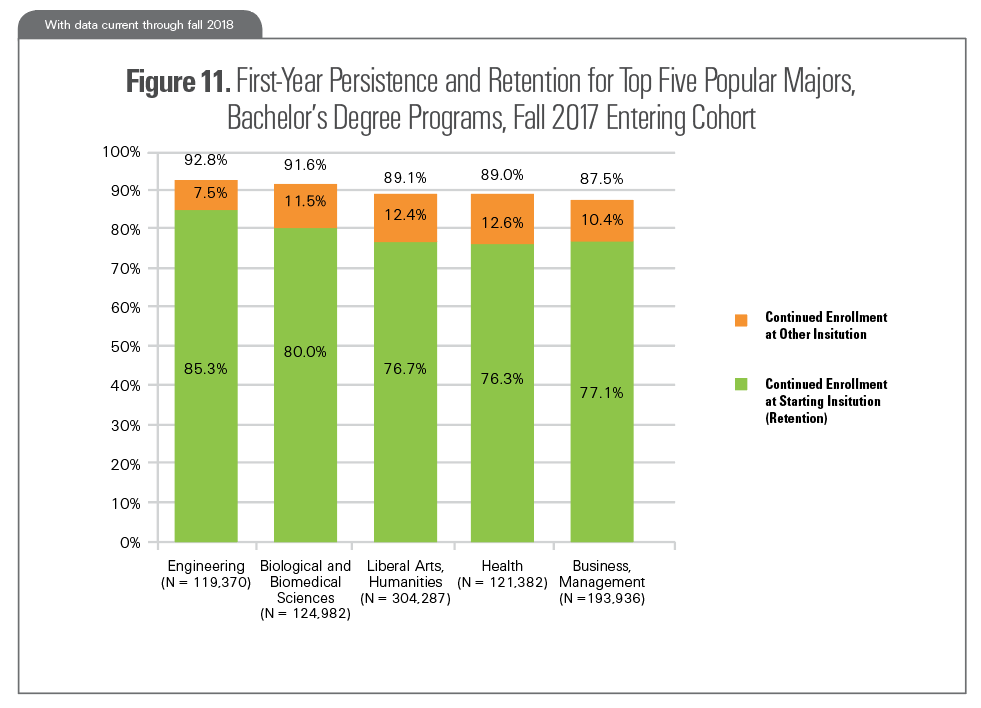
Refer to the last page of this report for additional definitions and notes on cohort selection. Download the data tables for this snapshot.Popular majors are defined by enrollment sizes. N is the total enrollment in the specified field of major as of fall 2017. Major fields shown are: Engineering (CIP code 14), Biological/Biomedical Sciences (26), Liberal Arts (24), Health (51), and Business (52).
Persistence and Retention: Top Five Popular Majors, Associate Degree Level
For first-time students who started in associate degree-level programs in fall 2017, their overall persistence rates were lower compared to their peers in bachelor’s degree-level programs. In the top five popular major fields, the persistence rates ranged between 57.3 percent and 66 percent. Liberal Arts, Humanities, and General Studies had a higher transfer-out rate (11.4 percent), consistent with the fact that these majors are often designed to prepare students for transfer to four-year institutions.
Note: Institutions submit enrollment data by program levels and by major fields, which cover 97 percent of the fall 2017 entering cohort students reported by the IPEDS.
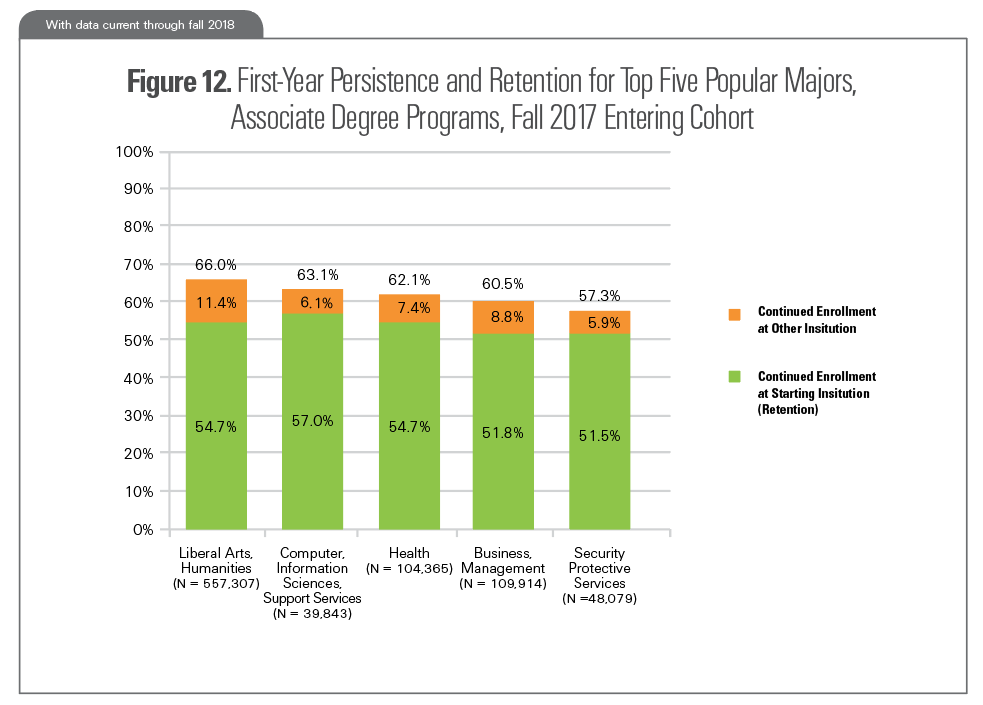
Refer to the last page of this report for additional definitions and notes on cohort selection. Download the data tables for this snapshot.Popular majors are defined by enrollment sizes. N is the total enrollment in the specified field of major as of fall 2017. Major fields shown are: Liberal Arts (CIP code 24), Computer Information (11), Health (51), Business (52), and Security Protective Services (43).
Persistence and Retention: Top Five Popular Majors, Certificate Level
Of first-time students who sought an undergraduate-level certificate, 58.8 percent persisted in the second year, either by attaining a certificate or continuing enrollment. The persistence rates for the top five popular majors in undergraduate certificate programs were below 60 percent, except for Liberal Arts, Humanities, and General Studies majors. These rates were slightly lower relative to those of associate programs. Among those who persisted in the second year, one in four students in Liberal Arts, Humanities, or General Studies continued enrollment in a different institution, a rate higher than in other majors shown in the figure.
Note: Institutions submit enrollment data by program levels and by major fields, which cover 97 percent of the fall 2017 entering cohort students reported by the IPEDS.
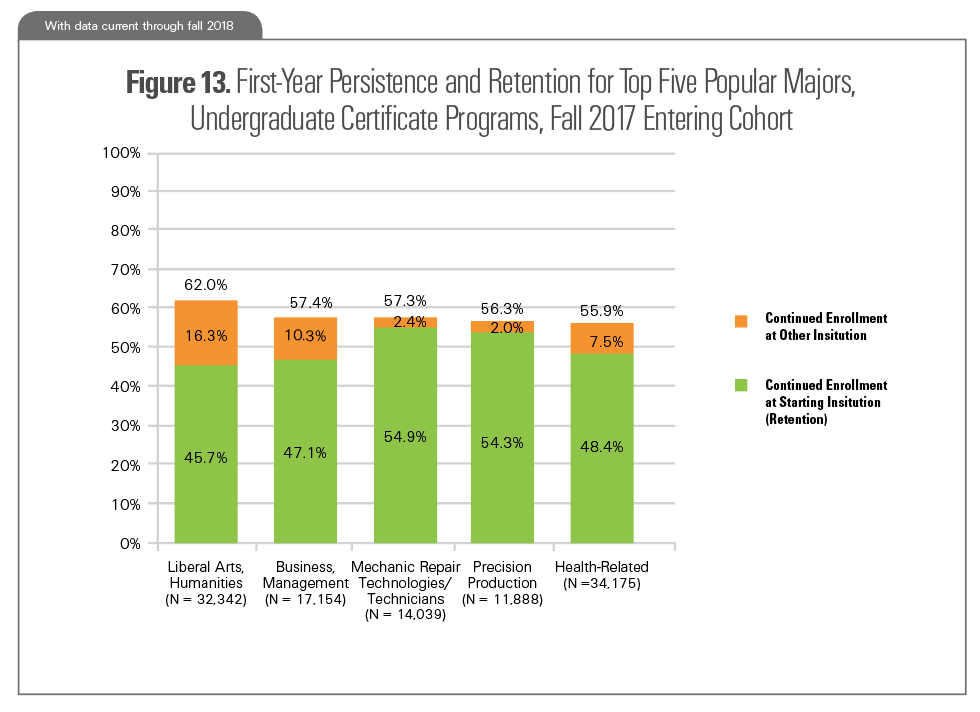
Refer to the last page of this report for additional definitions and notes on cohort selection. Download the data tables for this snapshot.Popular majors are defined by enrollment sizes. N is the total enrollment in the specified field of major as of fall 2017. Majors shown are: Liberal Arts (CIP code 24), Business (52), Mechanic Repair (47), Precision (48), and Health (51).
First-Year Persistence and Retention: Definitions and Notes on Cohort Selection
Higher Education Enrollment
Many postsecondary institutions that are degree-granting and participating in Title IV voluntarily report their enrollments to National Student Clearinghouse. These reporting institutions collectively represent 97 percent of the IPEDS postsecondary student enrollments as of 2018.
Degree/Certificate-Seeking Status
Beginning with the fall 2015 entering cohort, retention and persistence rates are reported for non-degree, non-certificate-seeking students in a separate category. Previously, these students were included in the full-time and part-time categories. Previous results for all cohort years after 2014 have been revised to reflect this change.
International Students
Older editions of this report did not account for international students in the entering cohorts. Beginning with the 2017 edition, international students are included in the entering cohort and previous results for all entering cohort years have been restated to reflect this.
Fixed Panel of Institutions
Older versions of this report were limited to a fixed panel of institutions present in every entering cohort year of the report, but that limitation no longer applies. Beginning with the 2017 version, the institutions included in each entering cohort year may be slightly different due to institutional closures, mergers, or changes in Clearinghouse participation over time. Results from previous versions of the report have been restated to reflect this.
Retention
Defined in this report as continued enrollment (or degree completion) within the same higher education institution in the fall terms of a student’s first and second year.
Persistence
Defined in this report as continued enrollment (or degree completion) at any higher education institution — including one different from the institution of initial enrollment — in the fall terms of a student’s first and second year.
Enrollment Intensity
A student is classified as having started college in a full-time status or part-time status based on their earliest reported enrollment intensity within the entering fall term. The part-time category comprises three-quarter-time, half-time and less-than-half-time students. Non-degree, non-certificate-seeking students were included in the full-time and part-time categories but beginning with the 2015 entering cohort, they are reported in a separate category.
First-Time Status
This report uses historical Clearinghouse enrollment and degree data to confirm that students included in the study (1) showed no previous college enrollment and (2) had not previously completed a college degree or certificate.
Former Dual Enrolled Students
The cohorts used in this study include former dual enrollment students: first‐time college students who had taken college courses prior to graduating from high school. Students were identified as former dual enrollment students if their enrollment or degree record prior to the entering cohort year was before the student turned 18 years old.
Fall Enrollment
A student is counted as having been enrolled in the fall if they were enrolled for any length of time in a term that began between August 1 and October 31, inclusive.
Program Level Enrollment by Major Fields
Beginning with the 2019 edition, persistence and retention rates are reported by major fields (mapped to 2-digit CIP), and at program levels including bachelor’s degree, associate degree, and certificate levels, in which students first enrolled. This level of details have become available as institutions started reporting enrollments both at the campus and the award levels of intended credentials mapped to the NCES’ 2-digit CIP (the Classification of Instructional Programs). The reported data covers 97 percent of the IPEDS fall 2017 degree/certificate-seeking, first-time student cohort.