

Completing College – National – 2014
This third annual report on national college completion rates offers the first look at the six-year outcomes for students who began postsecondary education in fall 2008, the cohort that entered college during the Great Recession. It looks at the various pathways students took toward degree completion, as well as the completion rates through May 2014 for the different student types who followed each pathway. The report also provides discussion comparing the fall 2008 cohort’s outcomes to those of the fall 2007 cohort (analyzed in our second annual completions report, Signature Report 6).
Signature Report 8 Data Extra: Attainment Rates by Age for Fall 2008 Cohort
This Data Extra provides attainment rates for the Fall 2008 cohort, which was the focus of our eighth Signature Report: “Completing College: A National View of Student Attainment Rates – Fall 2008 Cohort,” published in November 2014.
Posted on January 29, 2015.
Suggested Citation: Shapiro, D., Dundar, A., Yuan, X., Harrell, A. & Wakhungu, P.K. (2014, November). Completing College: A National View of Student Attainment Rates – Fall 2008 Cohort (Signature Report No. 8). Herndon, VA: National Student Clearinghouse Research Center.
Table of Contents
- About This Report
- Executive Summary
- Introduction
- Results
- Overall Six-Year Outcomes
- Students Who Started at Four-Year Public Institutions
- Students Who Started at Two-Year Public Institutions
- Students Who Started at Four-Year Private Nonprofit Institutions
- Students Who Started at Four-Year Private For-Profit Institutions
- Completion across State Lines
- Supplemental Feature: Eight-Year Outcomes for Fall 2006 Cohort
- Discussion for 2008 Cohort and the Changes from 2007 Cohort
- Overall Completion Rates
- Completion Rates by Age at First Entry and Enrollment Intensity
- Completion Rates for Students Who Started at Four-Year Public Institutions
- Completion Rates for Students Who Started at Two-Year Public Institutions
- Completion Rates for Students Who Started at Four-Year For-Profit Institutions
- Eight-Year Outcomes for Fall 2006 National Cohort
- Implications for Public Policymaking
- References
- Appendix A: Methodological Notes
- Appendix B: Coverage Tables
- Appendix C: Results Tables
About This Report
AUTHORS
National Student Clearinghouse Research Center
- Doug Shapiro
- Afet Dundar
Project on Academic Success, Indiana University
- Xin Yuan
- Autumn T. Harrell
- Phoebe Khasiala Wakhungu
ACKNOWLEDGEMENTS
The authors would like to thank Don Hossler, Professor of Educational Leadership and Policy Studies at Indiana University Bloomington; the members of the Project on Academic Success team, Karyn E. Rabourn, Katherine I. E. Wheatle, and Youngsik Hwang; and Vijaya Sampath from the National Student Clearinghouse Research Center for their efforts, thoughtful comments and suggestions. Of course, any remaining errors or omissions are solely the responsibility of the authors.
SPONSOR
This report was supported by a grant from the Lumina Foundation. Lumina Foundation, an Indianapolis-based private foundation, is committed to enrolling and graduating more students from college — especially 21st century students: low-income students, students of color, first-generation students and adult learners. Lumina’s goal is to increase the percentage of Americans who hold high-quality degrees and credentials to 60 percent by 2025. Lumina pursues this goal in three ways: by identifying and supporting effective practice, through public policy advocacy, and by using our communications and convening power to build public will for change. For more information, log on to www.luminafoundation.org.
Executive Summary
This Signature report presents six-year outcomes for students who began postsecondary education in fall 2008, the first completions results of a cohort that entered college during the Great Recession. The enrollment increases brought about by the recession are well-documented (Barr and Turner, 2013, Mullin & Phillippe, 2009), but how did these increases translate into college attainment rates? This report aims to answer this question by analyzing student outcomes through May 2014, for different types of students who followed different enrollment pathways. Given that degree completion has become the focus of a national agenda, these results have important implications for students, families, postsecondary institutions, and educational policymakers.
When the cohort for this study entered college, the prospect of a degree as a buffer against hard times was top of mind for many who found themselves newly unemployed. Yet, while the labor market lowered the opportunity cost of enrolling, rising college tuition continued to drive postsecondary degrees out of reach for many Americans. Higher education media reports during 2008 and 2009 highlighted concerns about unpredictable shifts in enrollment patterns, increases in community college enrollments, uncertainties in financial aid practices, and cuts in state support of public institutions. Nonetheless, federal and state pressures to meet ambitious national goals for increasing college attainment continued to grow. Against this backdrop, it is an open question whether a cohort that started college in the midst of such economic turmoil should be expected to accelerate progress toward those goals, or to slow it down. It is with this question in mind that, in addition to following the fall 2008 cohort’s completion and persistence outcomes, this report also compares these outcomes to those of the fall 2007 cohort.
This report focuses on postsecondary certificates and degrees for first-time-in-college degree-seeking students who enrolled in two- and four-year institutions in fall 2008. The study covers enrollment behaviors for six years, through spring 2014. The cohort also includes former dual enrollment students, who entered college in fall 2008 after taking college courses while still in high school.
The fall 2008 cohort shows the effects of the Great Recession in both its size and composition:
- The overall cohort was 12 percent larger than in fall 2007 (about 2.7 million vs. 2.4 million).
- There was a 20 percent increase in the number of older students.
- The share of the total cohort made up by those who enrolled at less than full-time increased by 1.5 percentage points.
- The share of students enrolled in community colleges and four-year private for-profit institutions increased by about one percentage point each.
These attributes – older students, part-time enrollments, starting at community colleges and for-profit institutions – are associated in this and previous reports with lower completion rates.
MAJOR FINDINGS AND IMPLICATIONS
Overall Completion Rates Declined
The overall national six-year completion rate for the fall 2008 cohort was 55.0 percent, a decrease from the completion rate of 56.1 percent for the fall 2007 cohort. A small decrease, less than one percentage point, was also observed in the rate of continued enrollment at the end of the study period. The percent of students who were no longer enrolled at the end of the study period – stopped out or left higher education with no degree or certificate – increased from 28.6 percent for the fall 2007 cohort to 30.3 percent for the fall 2008 cohort. However, some student populations experienced larger declines in their attainment rates while others stayed the same or actually increased (e.g. completion rates increased by 0.7 percentage points for students who started in four-year private nonprofit institutions).
Declines Observed Mostly in Older and Part-Time Student Groups
We considered students in three age groups: those who began postsecondary education immediately after high school (age 20 or younger), those who delayed entry for a few years (over 20 through 24), and adult students (over 24). Comparisons with the results for fall 2007 cohort show that the decline in completion rates was concentrated in the nontraditional-age students. For the delayed entry group, the completion rate was 2.6 percentage points lower (38.3 vs. 40.9 percent). Adult learners had a decrease of 1.4 percentage points in their completion rate (42.1 vs. 43.5 percent). A decrease in the completion rate was observed for all students in these two age groups regardless of their enrollment intensity (exclusively full time, exclusively part time, or mixed. This pattern was consistent for both men and women as well.
Traditional-age students had a smaller decline, one-half of a percentage point, which is attributable almost entirely to a small shift away from full-time enrollment among these students. The completion rate for traditional age students who were enrolled exclusively full time was unchanged from the fall 2007 cohort, and there was actually a small increase (0.3 percentage points) for those who had mixed enrollments.
Completion Rates Declined for Students Who Started at Two-Year Public Institutions
The total completion rate for two-year starters, regardless of whether the completion occurred at a two-year or four-year institution, declined by 0.7 percentage points, from 39.8 percent to 39.1 percent. Moreover, the total completion rate at four-year institutions for students who started at two-year institutions dropped by one percentage point from the rate reported for the fall 2007 cohort (16.2 percent vs. 17.2 percent). Over half of these four-year degree earners did so without first obtaining a two-year degree (60.4 percent, or 9.8 percent of the full cohort who started at two-year institutions). This demonstrates that one in 10 students who started in two-year public institutions transferred and graduated from a four-year institution without receiving any credential from their starting institution. Traditional graduation rate measures that focus only on completions at the starting institution do not account for this type of outcome, even though it is a well-worn pathway receiving increasing attention in today’s resource-constrained policy environment.
This may partly be the result of the increased enrollments of older students brought about by the Great Recession. However, the total four-year completion for traditional-age two-year starters also declined, by 0.8 percentage points. With almost half of all college enrollments for graduates from low-income high schools occurring in two-year institutions (NSCRC, 2014), even an unchanged four-year completion rate for two-year starters is not good news. For many disadvantaged students, enrolling in a community college is the only entry point to postsecondary education. In light of this finding, improving community college/four-year institution partnerships is even more important.
Completion Rates for Students Who Started at Four-Year For-Profit Institutions Declined Sharply
The six-year completion rate for those who started in four-year for-profit institutions in fall 2008 (38.4 percent) decreased dramatically from that of the previous year’s cohort (42.3 percent), dropping 3.9 percentage points. There was a bigger decline in the completion rate for men (5.2 percentage points) than for women (4.1 percentage points). This widened the gender gap from 2.5 percentage points to 3.6, in favor of women.
Combining the decline in the completion rate with a 1.7 percentage point decline in the rate of those who were still enrolled at the end of the study period, the percentage of the cohort who had stopped out or dropped out without a degree or certificate increased from 44.3 percent for the fall 2007 cohort to 49.9 percent for the fall 2008 cohort. While fully one-half of the students no longer appeared to be pursuing a credential by the end of the study period many of them may never have been seeking an academic credential in the first place. Older students returning to education from the workforce may have sought training or experience leading to non-academic certifications, or simply an opportunity to gain skills while waiting for the employment climate to improve.
It should also be noted that the size of the cohort for this sector increased substantially from fall 2007 to fall 2008, by 35 percent, despite unchanged coverage rates in the Clearinghouse data. This suggests that many opted to enroll in four-year for-profit institutions only as a response to the deepening recession. Thus, the dramatic decline in completion rates could also be attributable to improving economic conditions later in these students’ education, which may have led some to leave school in order to re-enter labor market.
Eight-Year Completions Top 60 Percent for Fall 2006 Cohort
This report’s supplemental feature examined eight-year outcomes for the fall 2006 cohort, tracking their enrollment patterns through spring 2014. The two additional years make a noticeable difference. Within eight years of starting, 44.4 percent of the 2006 cohort completed at their starting institution and an additional 15.7 percent completed at a different institution, for a combined completion rate of 60.1 percent nationally. This represents a 6 percentage point increase in total completions over the six‐year rate and a 2 percentage point increase over the seven-year rate. At the same time, the percentage of students who were still enrolled at the end of the eight-year period declined by 8 percentage points compared to the six-year period (16.1 percent).
Students who required the extra two years to complete their degree mostly did so at a different institution from where they started. More than one-quarter (26.2 percent) of all completers after eight years had earned their first credential somewhere other than at their starting institution, compared to 22.4 percent of the same cohort when completions were measured at the six-year point. This suggests that the longer we track the outcomes for a given cohort, the more diverse the students’ pathways to those outcomes become.
Similarly, the increase in the completion rate from the six-year to eight-year cutoff was larger for part-time and mixed enrollment students than for full time or traditional-age students. The eight-year completion rate had a 22 percent increase over the six-year rate for mixed enrollment students and a 15 percent increase for exclusively part-time students. The completion rate for exclusively full-time students increased only 5 percent from the sixth to the eighth year. The eight-year completion rate for adult learners in the fall 2006 cohort was 45.9 percent, which was 9 percent higher than the six-year completion rate for this group.
IMPLICATIONS FOR PUBLIC POLICYMAKING
The effects of the Great Recession on attainment rates is a significant part of this year’s report. The fall 2008 cohort reflected an increase in enrollments, particularly in community colleges and for-profit institutions, and a decline in the overall national completion rate. However, the report also demonstrates the importance of disaggregating the range of postsecondary educational pathways that different types of students pursue. Taking advantage of the Clearinghouse’s unique student-level data enables us to understand the change in outcomes for the 2008 cohort in the context of the variations in attainment rates for students of different entering characteristics and enrollment behaviors.
This analysis is not meant to suggest that policy is powerless to effect change for particular types of students or institutions. Indeed, the report points to specific opportunities for improving outcomes. For example, there was no decline in completion rates for traditional-age students enrolling full time. Yet, because fewer students were able to maintain full-time enrollment, the resulting outcome was a lower overall completion rate for traditional-age students. To the extent that college affordability, both in terms of family finances and institutional tuition rates, is a factor in student enrollment intensity, these outcomes are susceptible to policy interventions that directly impact affordability.
This report’s findings reiterate the need for developing measures that capture the complexity of students’ postsecondary pathways. Developing new measures of student success outcomes will result in public and institutional policies that acknowledge and respond to student pathways that may involve mobility across institutional and state lines, part‐time and mixed enrollment, a gender gap that varies by age, and entry into postsecondary institutions at a variety of different ages and life circumstances.
Introduction
This Signature report presents six-year outcomes for students who began postsecondary education in fall 2008, the first college completions results of a cohort that entered college during the Great Recession. The enrollment increases brought about by the Great Recession are well-documented (Barr and Turner, 2013, Mullin & Phillippe, 2009) but how did these enrollment increases translate into college attainment rates? This report aims to answer this question by demonstrating the various pathways students took toward degree completion, as well as the completion rates through May 2014, for different types of students who followed each pathway. Given that degree completion has become the focus of a national agenda, these results have important implications for students, families, postsecondary institutions, and educational policymakers.
When the cohort for this study entered college, the prospect of a college degree as a buffer against hard times was top of mind for many who found themselves unemployed. As it is the case during a recession, the opportunity cost of being in college versus participating in the labor market was not high. On the other hand, rising college costs seemed to make obtaining a postsecondary degree even further out of reach for many Americans. Higher education media reports during 2008 and 2009 highlighted concerns about unpredictable shifts in enrollment patterns (Desmond, 2008; Jaschik, 2008), increases in community college enrollments (Moltz, 2008; Mullin & Phillippe, 2009), uncertainties in financial aid practices (Supiano, 2009), and cuts in state support of public institutions (Carlson, 2009; Douglass, 2008; Moltz, 2009). Nonetheless, federal and state pressures to meet ambitious national goals for increasing college attainment by 2020 continued to grow. Against this backdrop, it is an open question whether a cohort that started college in the midst of such economic turmoil should be expected to accelerate progress toward those goals, or actually to slow it down. It is with this question in mind that, in addition to following the fall 2008 cohort’s college enrollment behaviors and reporting their completion and persistence outcomes, this report also provides discussion that compares the outcomes of the fall 2008 cohort to those of the fall 2007 cohort, which was analyzed in Signature Report 6.
THE COLLEGE COMPLETION AGENDA AND PERFORMANCE FUNDING
Recently policy discussions and practical reforms driving the national completion agenda have shifted from focusing on economic competitiveness to emphasizing transparency, accountability, and affordability in higher education (Belfield, Crosta, & Jenkins, 2013; Jaschik, 2013). President Obama’s proposals for higher education accountability and ratings exemplify this shift in thought (Blumenstyk, 2013; Jaschik, 2013; Lewin, 2013), as do state-level discussions focused on performance-based funding for public institutions (National Conference of State Legislatures [NCSL], 2014; Petrick, 2012).
In addition, there has been a push to reward successful practices that expand the number of postsecondary completions. The Lumina Foundation, for example, began financially supporting existing initiatives around the country that have made progress toward improving completions in local communities (Sander, 2013). Although the overall goal is to increase the number of students graduating from colleges and universities, it should be noted, however, that the outcomes measured differ from state to state (Jones, 2013). The National Student Clearinghouse Research Center is addressing the need for reliable outcomes data for various student pathways by publishing annual reports on college completion rates for different student populations at different types of institutions, providing national and state-level benchmarks. This is the third report in the series.
In a move toward greater accountability for student outcomes, President Obama recently proposed the development of a new federal ratings system for higher education institutions (Field, 2013; Shear, 2014). The proposal envisioned that the federal student aid received by institutions would be linked to their performance in the ratings system, in a way that would promote institutional accountability for student outcomes, considering incoming student characteristics (Blumenstyk & Thomason, 2014; Keierleber, 2014). Factors under consideration for the rating system include institutional access for low income students, student tuition costs and future earnings, student transfer and completion rates, and alumni satisfaction (Blumenstyk & Thomason, 2014). While those directly affected by the proposed rating system have offered alternate suggestions (particularly alternatives that account for varying institutional missions and their diverse student bodies), the introduction of a federal rating system in some form seems likely (Field, 2013; Lederman, Stratford & Jaschik, 2014).
One direct outcome of the proposed federal rating system would be the implementation of a new funding model for institutions that receive federal aid. Performance funding (also referred to as outcomes-based funding) links resource allocation to institutional results based on various measures. It has been used by various states for nearly four decades (Jones, 2013). Using a state-level analysis, Tandberg and Hillman (2013) found that completions at the associate and baccalaureate level were, on average, unaffected by the performance funding policies in place during their study. In cases where they had an effect, it was little. In a few instances where they had an effect, completion rates decreased after five years for associate degrees and increased for bachelor’s degrees after seven years. These results strongly suggest that selecting appropriate indicators for measuring institutional performance is crucial to the successful implementation of an outcomes-based funding approach (Jones, 2013). The outcomes provided in this Signature Report offer a broad perspective on college completion pathways, which can inform institutional, state, and national policies on the completion agenda.
PRIOR REPORTS ON COLLEGE COMPLETION
Many national reports and studies depend on the customary, established measures used by long-standing data sources, such as IPEDS (e.g., first-to-second year retention, first-time full-time cohort graduation rates, and degree awards). Consequently, those reports will continue to have important limitations in providing the necessary information for assessing institutional performance.
Empirical studies that use conventional measures of student success, such as completion rates at institutions of origin, are substantially limited in their ability to capture student outcomes. These studies fail to recognize institutional efforts to encourage enrollment mobility (particularly at community colleges) that can help students realize their individual educational goals. Likewise, most studies focus on a single institution or region using institutional- or state-level student unit record data and, therefore, fail to account for increasingly common enrollment behaviors, such as multi-institution enrollment, cross-state transfer, and transfer between institutional sectors (Bach et al., 2000; Hillman, Lum, & Hossler, 2008).
In addition to the diverse pathways students take while working toward their educational goals, students who enroll in college full time immediately after high school no longer represent the majority among postsecondary college students (Choy, 2002; Horn & Carroll, 1997; Reeves, Miller, & Rouse, 2011). Because these “nontraditional” students have many external demands and competing interests, conventional measures of success – such as, graduation rates for institution-based, first-time full-time degree-seeking cohorts – are insufficient for understanding the particular risks and support structures that shape their academic careers (ACSFA, 2012; Committee on Measures of Student Success, 2011; Moore & Shulock, 2009; University Professional and Continuing Education Association Center for Research and Consulting & InsideTrack, 2012; U.S. Department of Education, 2011). Consequently, a key aspect of recent research on college completion focuses on the development and adoption of new and more appropriate measures of success.
WHAT TO FIND IN THIS REPORT
This report focuses on the completion of postsecondary certificates and degrees by first-time-in-college degree-seeking students who initially enrolled in two- and four-year colleges and universities (public, private nonprofit, or private for-profit) nationwide in fall 2008. The study follows the fall 2008 cohort’s college enrollment behaviors for six years, through spring 2014. The study cohort includes former dual enrollment students: first-time college students in fall 2008 who had taken college courses while still in high school.
- Results: Six-year outcomes provided in this report include completions at students’ starting institutions, completions at institutions other than the starting institution, and continued enrollment of non-completers through the end of the study period. While the report emphasizes students’ first completions, it also provides the subsequent completions at four-year institutions of students whose first credential was awarded by a two-year institution. Six-year postsecondary outcomes are presented by students’ age at first entry into college, by enrollment intensity, and by the type of institution where students first enrolled. Results for students in three categories of enrollment intensity are also presented: (1) exclusive full-time enrollment, (2) exclusive part-time enrollment, and (3) enrollments showing both full- and part-time terms during the six years examined (mixed enrollment students).
- Supplemental Feature: Explores eight-year postsecondary outcomes for the fall 2006 cohort
- Discussion Section: Highlights the major findings of the report and discusses how they compare to the outcomes of the fall 2007 cohort
A NOTE ON THE DATA
Data Source
The data for this report were drawn from the StudentTracker® and DegreeVerify℠ services, administered by the National Student Clearinghouse® (The Clearinghouse), which tracks 96 percent of college enrollments nationwide across all postsecondary institutions, including all institution types: two‐year and four‐year institutions, public and private institutions, and nonprofit and for‐profit institutions. In order to ensure the most accurate possible representation of student outcomes for the study cohort, the results reported here are weighted according to the formula described in Appendix A using the state‐by‐state coverage rate for each institution type (sector and control). A complete explanation of national coverage rates and the weights used to ensure that results reflect enrollment and completion by sector and control can be found in Appendices A and B.
The student outcomes captured in this report are based on student‐level data representing an unduplicated headcount of students across all institutions, a feature of the Clearinghouse data sets that distinguishes them from many other data sources, including the Integrated Postsecondary Education Data System (IPEDS), that may not accurately capture the complexity of postsecondary pathways because they are not structured to identify multiple enrollments by individual students. The capability of StudentTracker to link enrollment records across institutions nationally allows researchers to follow students longitudinally as they move from institution to institution, producing a fuller picture of college persistence and completion.
Although Clearinghouse data contain demographic information on students, historical coverage rates for the demographic data elements are uneven. Therefore, the results summarized in this report give a national overview of college completion by age at first entry and by enrollment intensity, showing the percentage of students who enrolled or completed at various types of institutions, but they do not examine completion by race/ethnicity, for example.
Cohort Definition
The cohort examined in this study is made up of first‐time degree‐seeking students, of any age, who began their postsecondary studies in the fall of 2008. Showing intent to seek a degree or certificate was defined as follows:
- For students who started at four‐year institutions, enrolled at least one term with an intensity of half‐time or higher, and
- For students who started at two-year institutions, either:
- Enrolled full-time for at least one term before August 10, 2009, or
- Enrolled at least half-time for any two terms before December 31, 2009.
First‐time status was established by confirming that a student (1) did not show any postsecondary enrollment record in the four years prior to the student’s fall 2008 enrollment, and (2) did not receive a degree or certificate from any postsecondary institution prior to fall 2008, according to Clearinghouse data. An exception was made for former dual enrollment students: first‐time college students in fall 2008 who had taken college courses while still in high school were included in the study cohort.
Figure 1. Fall 2008 Cohort by Starting Institution
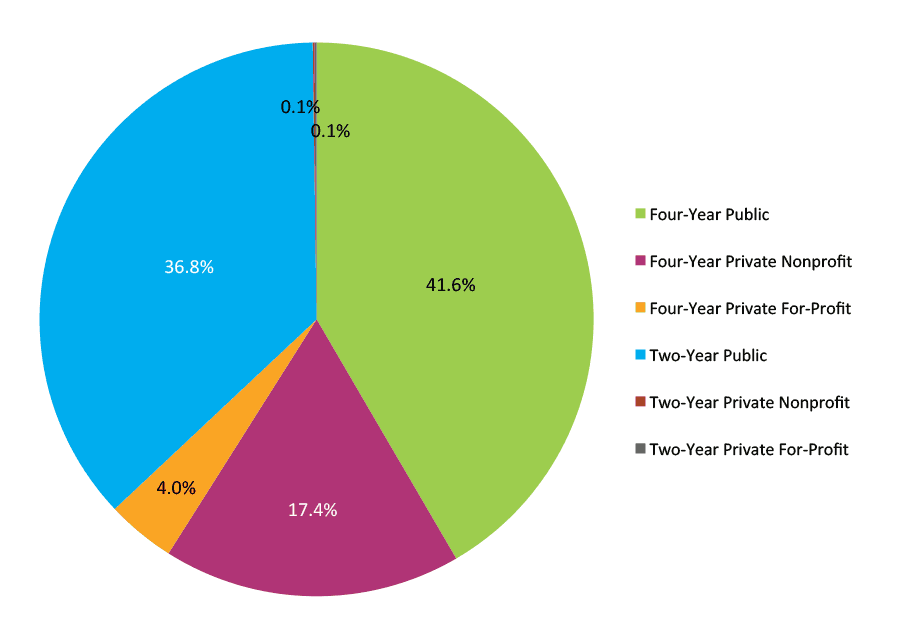
*This figure is based on data shown in Appendix C, Table 6.
Figure 1 shows the fall 2008 cohort (n=2,673,800) that includes former dual enrollment students broken out by type of starting institution. The largest percentage of the cohort (41.6 percent, n=1,112,105) was enrolled in four‐year public institutions, followed by two‐year public institutions with 36.8 percent (n=983,521), and four‐year private nonprofit institutions that enrolled 17.4 percent (n=464,796) of the cohort. Four‐year private for‐profit institutions enrolled a small percentage comparatively, 4.0 percent (n=107,368). The smallest proportion of the enrollment cohort was made up of two‐year private nonprofit institutions and two‐year private for‐profit institutions, both enrolling only 0.1 percent.
Figure 2. Fall 2008 Cohort by Age at First Entry
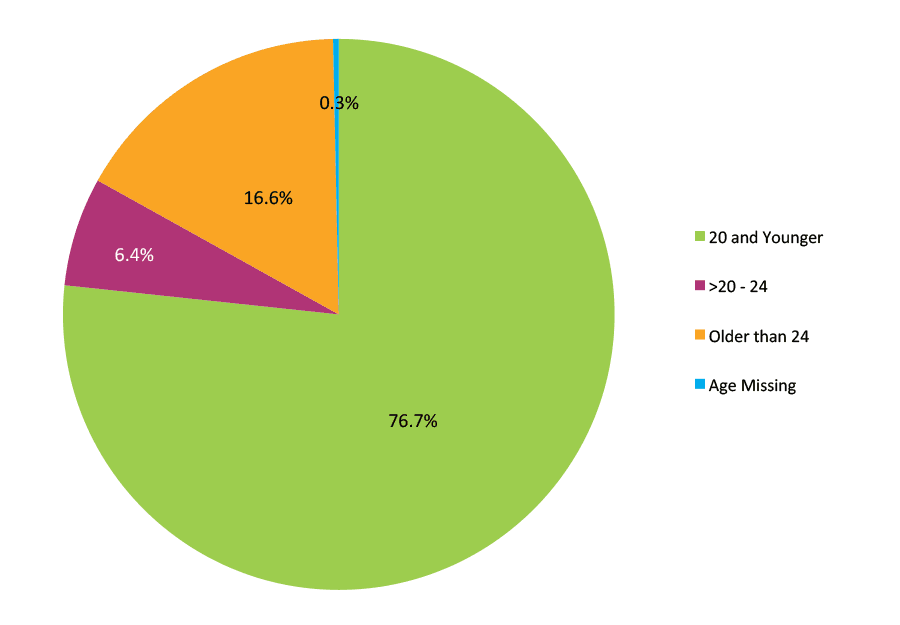
*This figure is based on data shown in Appendix C, Table 1.
Figure 2 reveals that 16.6 percent of the study cohort were over age 24 at the time of first entry into college. Most of the students (76.7 percent) were age 20 or younger at first entry. Only 6.4 percent were between the ages of 21 and 24 at first entry. The birthdate was missing for less than one percent of the cohort.
Figure 3. Fall 2008 Cohort by Enrollment Intensity
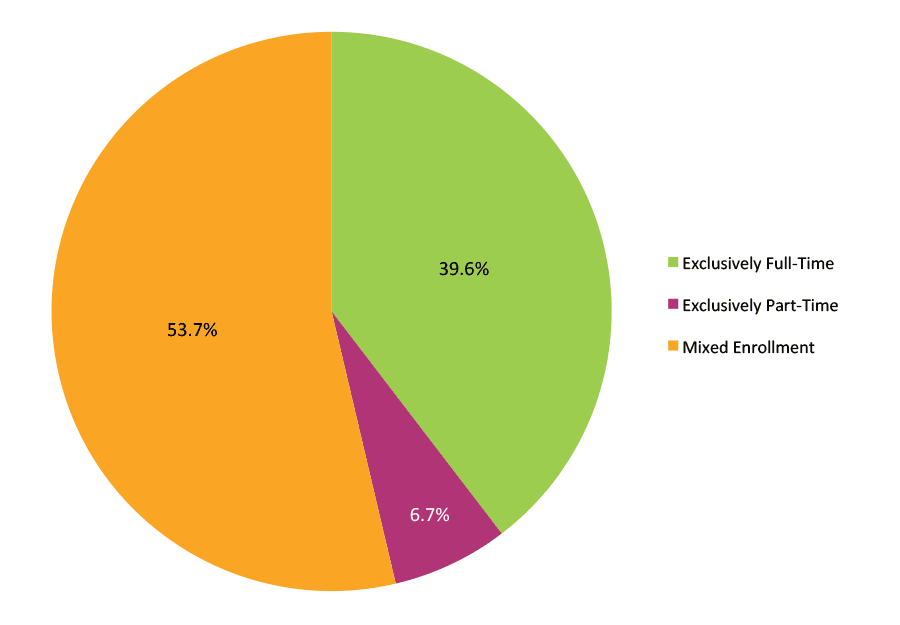
*This figure is based on data shown in Appendix C, Table 2.
Figure 3 focuses on students’ enrollment intensity, and shows that 39.6 percent of the study cohort enrolled exclusively full time throughout the study period while 6.7 percent enrolled exclusively part time. “Exclusively” means during all regular terms, excluding summers, in which the student was enrolled, and thus does not preclude stop‐outs. It is important to note that a majority of the cohort (53.7 percent) were mixed enrollment students; that is, they enrolled full time for some terms and part time for other terms during the study period (see Appendix A for further detail).
It is important to note that this is a significantly different definition of enrollment status than the one commonly used in graduation rate studies based on IPEDS data. IPEDS cohorts are determined by student enrollment status in the first fall term only. By contrast, this report considers student enrollment status over time and across institutions, allowing for a more nuanced classification.
Figure 4. Fall 2008 Cohort by Gender
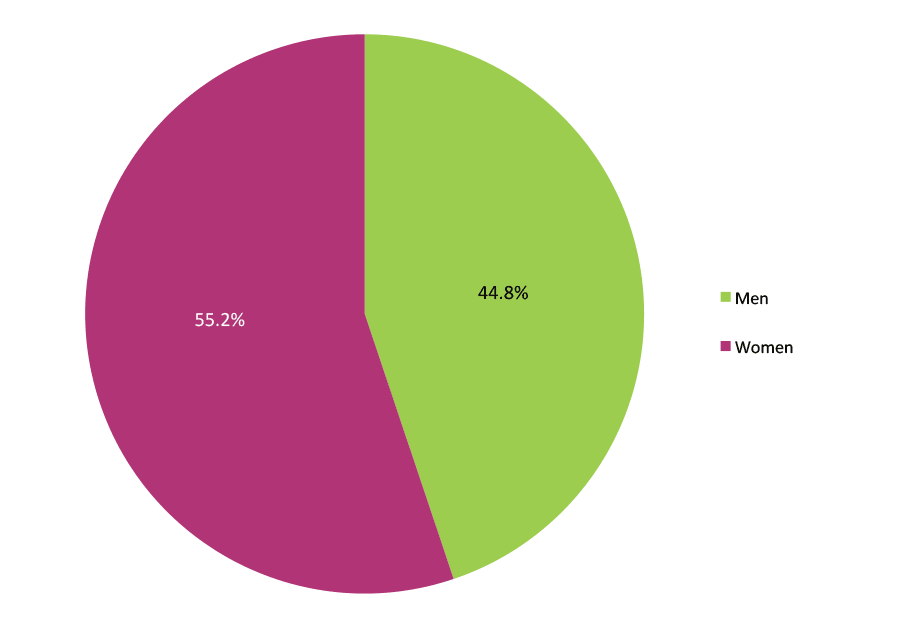
*This figure is based on data shown in Appendix C, Table 4.
The representation of men and women within the cohort is shown in Figure 4. Consistent with national figures on participation in postsecondary education, women make up more than half of the cohort, at just over 55 percent.
Table 1. Fall 2008 Cohort by Age at First Entry and Enrollment Intensity
| Age at First Entry | Enrollment Intensity | Weighted Count | Percentage of Age Group |
| 20 and Younger | Overall | 2,051,282 | 100.0 |
| Exclusively Full-Time | 879,536 | 42.9 | |
| Exclusively Part-Time | 58,664 | 2.9 | |
| Mixed Enrollment | 1,112,744 | 54.2 | |
| >20 – 24 | Overall | 169,845 | 100.0 |
| Exclusively Full-Time | 54,577 | 32.1 | |
| Exclusively Part-Time | 18,507 | 10.9 | |
| Mixed Enrollment | 96,608 | 56.9 | |
| Older than 24 | Overall | 438,588 | 100.0 |
| Exclusively Full-Time | 118,006 | 26.9 | |
| Exclusively Part-Time | 99,362 | 22.7 | |
| Mixed Enrollment | 220,442 | 50.3 | |
| Age Missing | Overall | 8,900 | 100.0 |
| Exclusively Full-Time | 3,709 | 41.7 | |
| Exclusively Part-Time | 1,737 | 19.5 | |
| Mixed Enrollment | 3,437 | 38.6 |
Finally, Table 1 shows the distribution of students in the study cohort by age at first entry and enrollment intensity. For all three age groups, students with mixed enrollment intensity represented the largest proportions. For students who were 20 years old or younger at first entry, 54.2 percent had mixed enrollment, followed by students who enrolled exclusively full time (42.9 percent), and then students who enrolled exclusively part time (2.9 percent). Among students who were over 24 at first entry, a similarly large percentage (50.3 percent) showed mixed enrollment. However, in contrast to the younger groups, a much higher proportion of older students (22.7 percent of students who were over 24 at first entry) enrolled exclusively part time throughout the study period; only a slightly larger proportion (26.9 percent) enrolled exclusively full time.
Results
OVERALL SIX-YEAR OUTCOMES
The results presented in this report focus on six-year outcomes of degree-seeking students who enrolled in postsecondary education for the first time in fall 2008. This report specifically emphasizes each student’s first instance of completion presenting a national picture of college completion and taking a closer look at college outcomes for students of different age groups and enrollment intensity.
Figures 5 through 13 show six-year outcomes for the 2008 fall cohort broken out by:
- Enrollment intensity
- Gender
- Age group at first entry
- Gender and age
- Age group and enrollment intensity
- Starting institution type
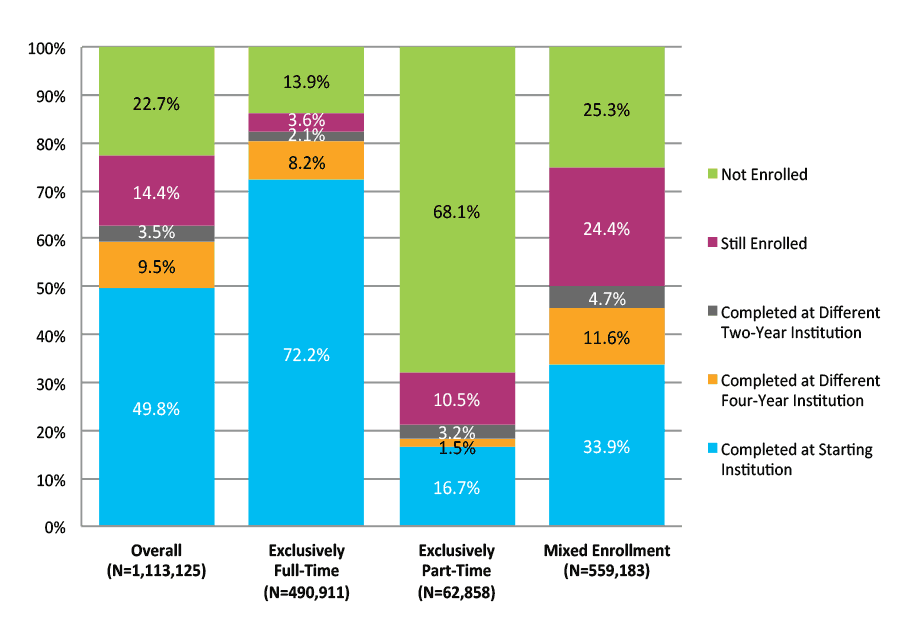
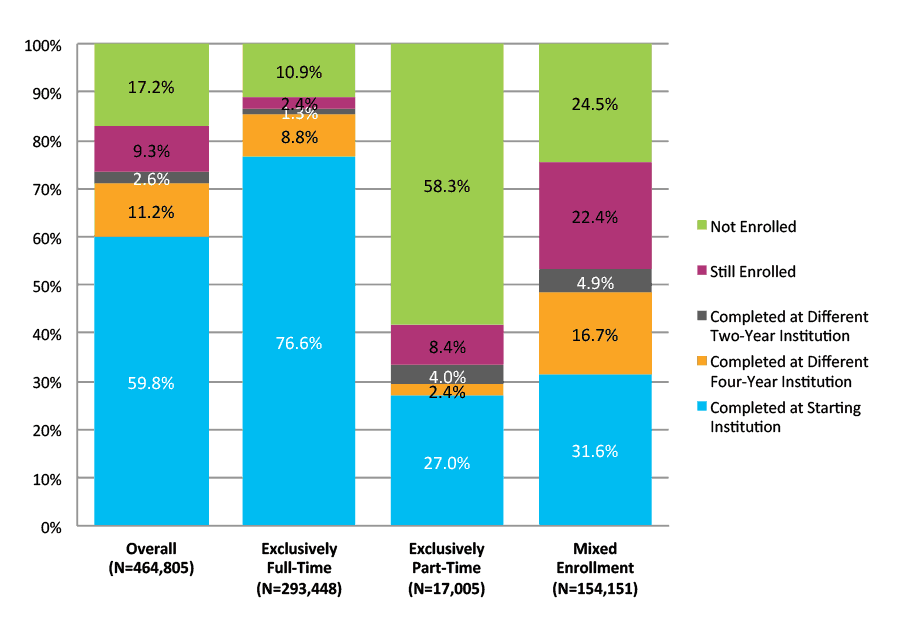
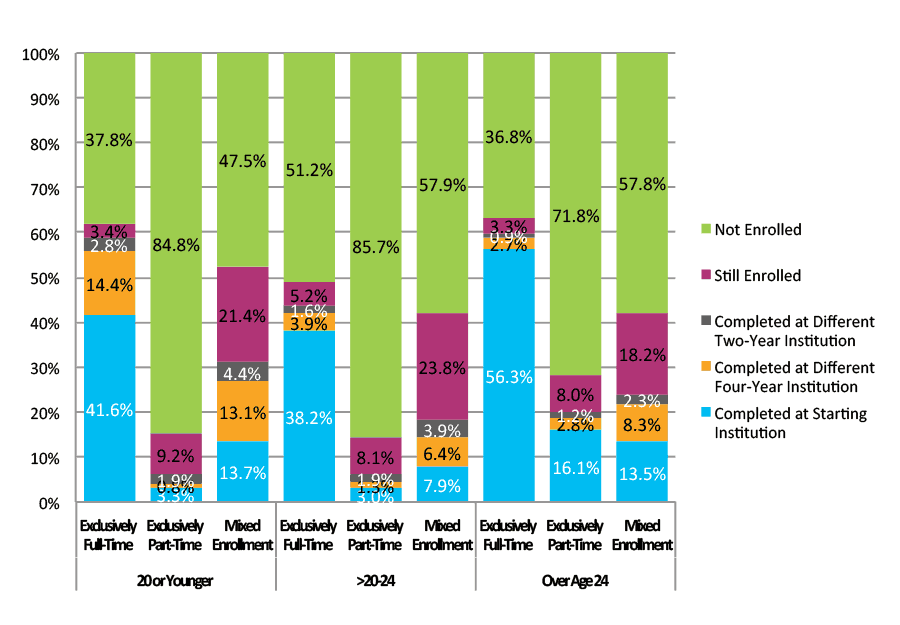
Overall, 69.7 percent of the cohort completed a degree (55.1 percent) or were still enrolled (14.7) at the end of the study period. Students who enrolled exclusively full time completed at greater rates (77.2 percent) than their exclusively part-time (21 percent) and mixed enrollment (43 percent) counterparts (Figure 5).
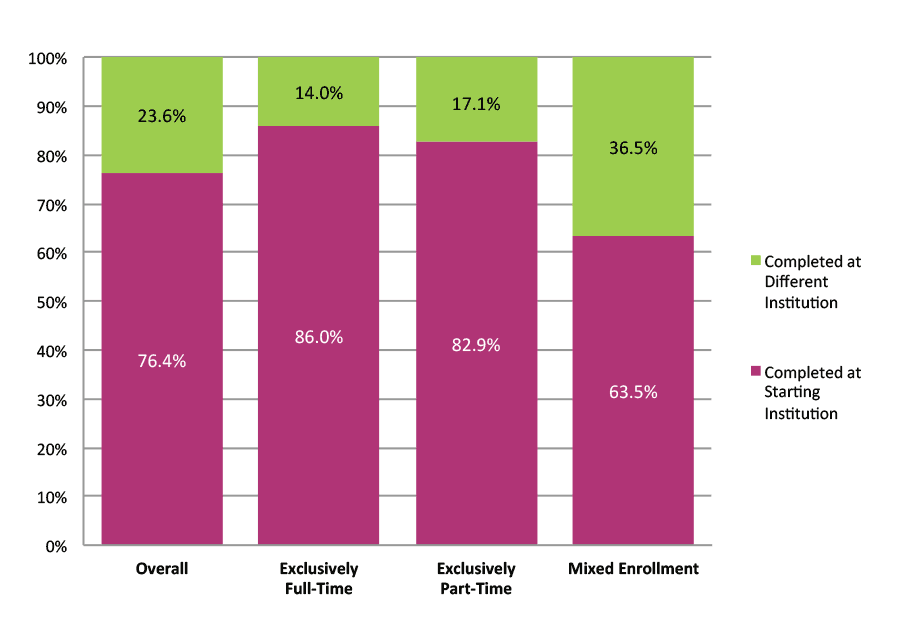
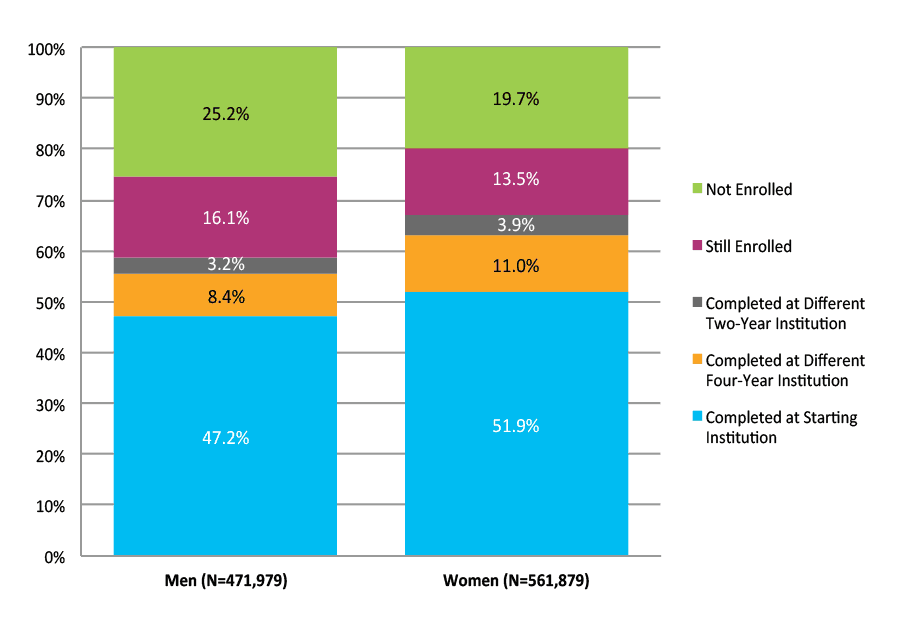
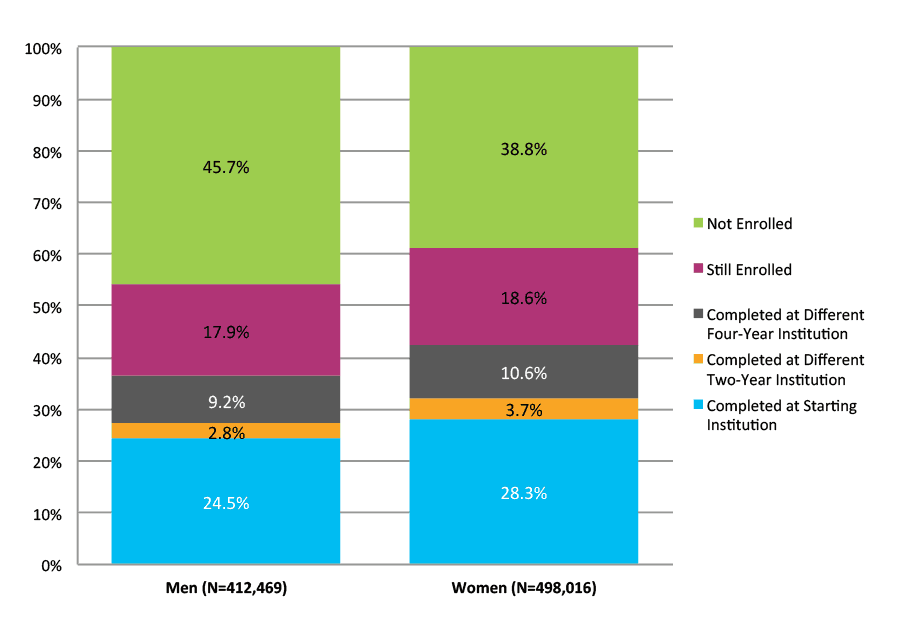
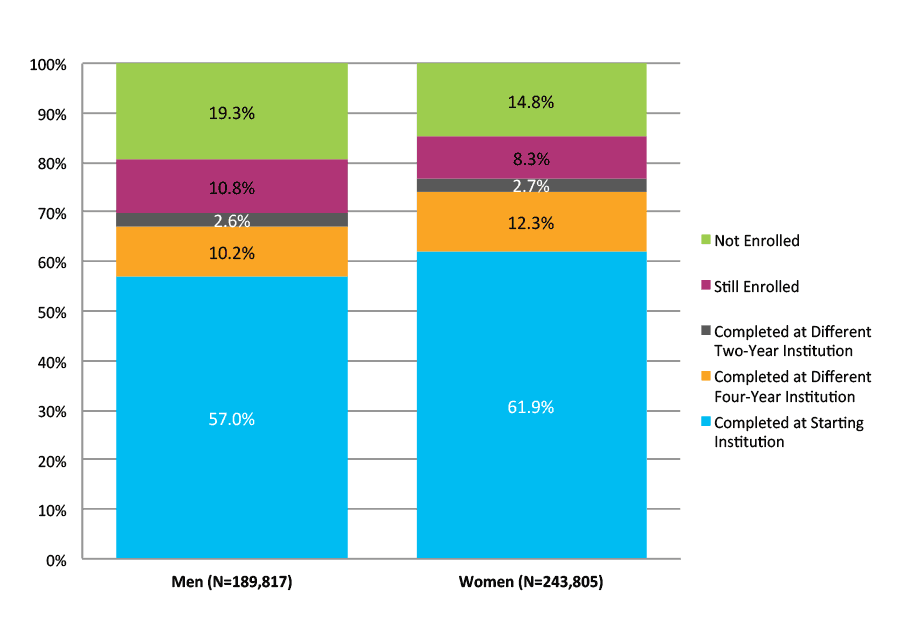
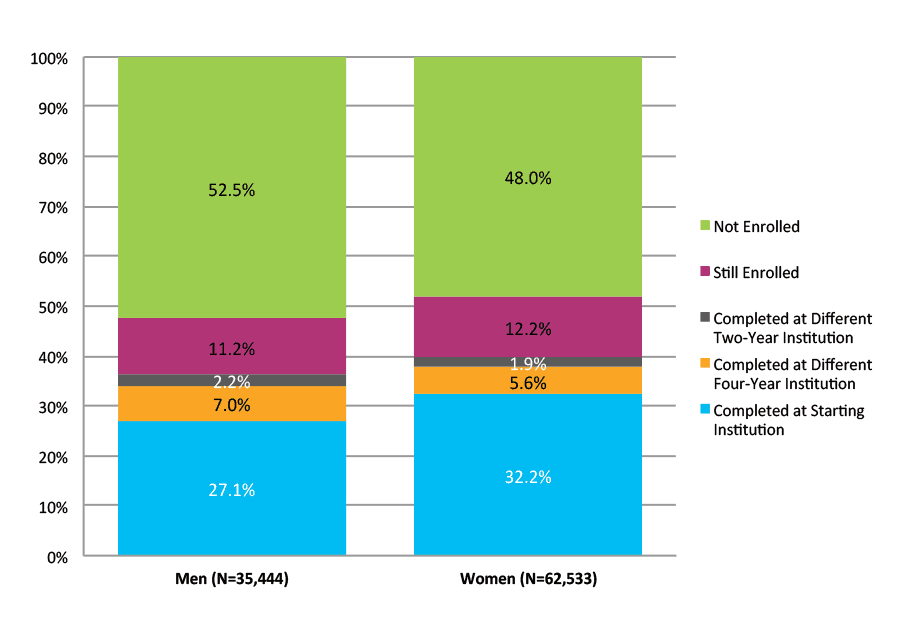
It can be argued that six years may not be an adequate timeframe for part-time students to complete postsecondary education, especially for those who started in four-year institutions. However, only 10 percent were still enrolled at the end of the study period and a much greater proportion (68.5 percent) was no longer enrolled at the end of the study period (Figure 5). This pattern is also visible when outcomes were disaggregated by age at first entry. More than one-third of completions by mixed enrollment students were earned at an institution different from where they started (Figure 6). Higher completion rates were observed among female students (58.6 percent) than male students (51.6 percent).
Six-Year Outcomes by Enrollment Intensity
Figure 5. Six-Year Outcomes by Enrollment Intensity (N= 2,668,614)
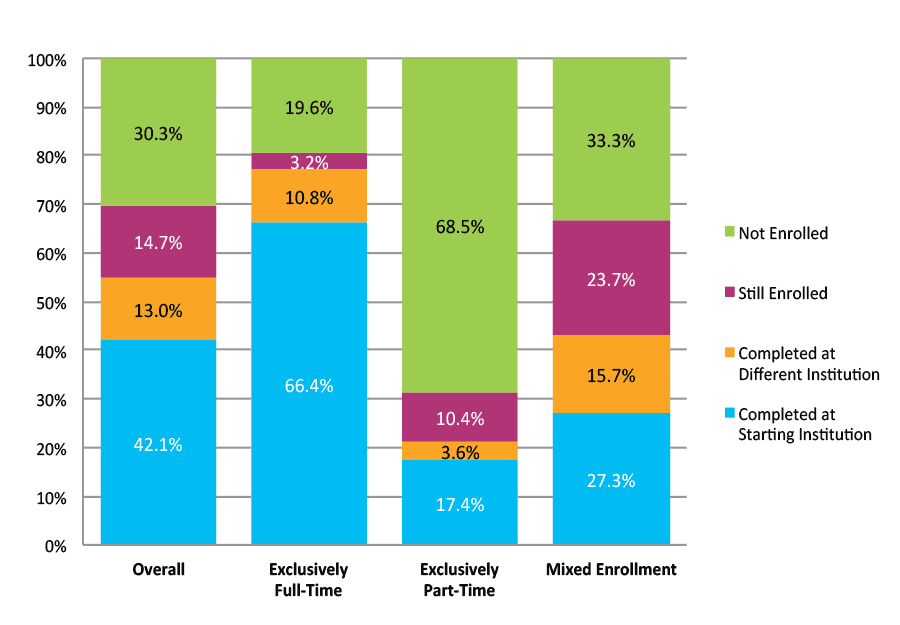
*This figure is based on data shown in Appendix C, Table 7.
Figure 6. Completion at Starting vs. Different Institution by Enrollment Intensity (N=1,468,323)
*This figure is based on data shown in Appendix C, Table 7.
Six-Year Outcomes by Gender
Figure 7. Six-Year Outcomes by Gender (N=2,481,234)
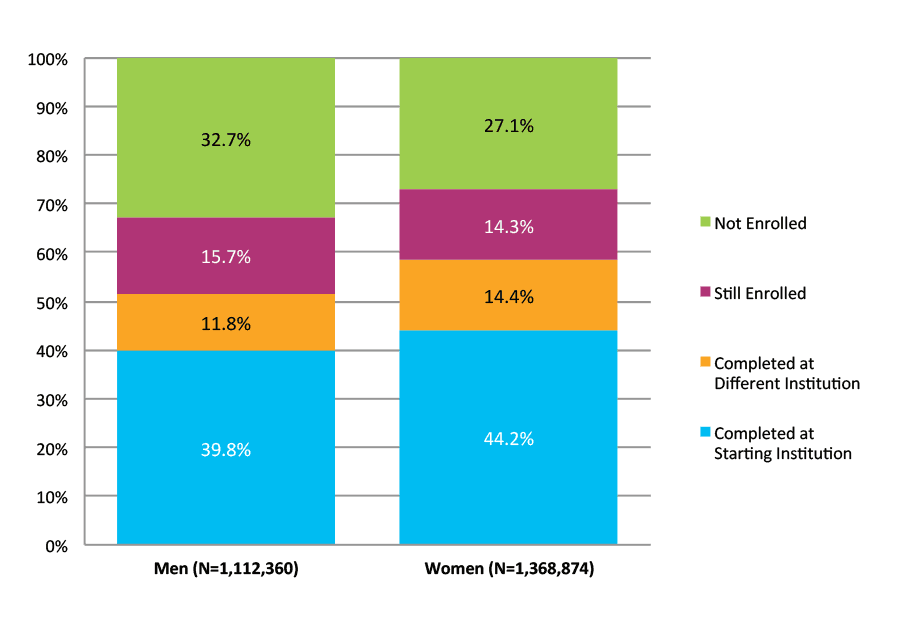
NOTE: Students with missing gender data were excluded from the figure above. This figure is based on data shown in Appendix C, Table 8.
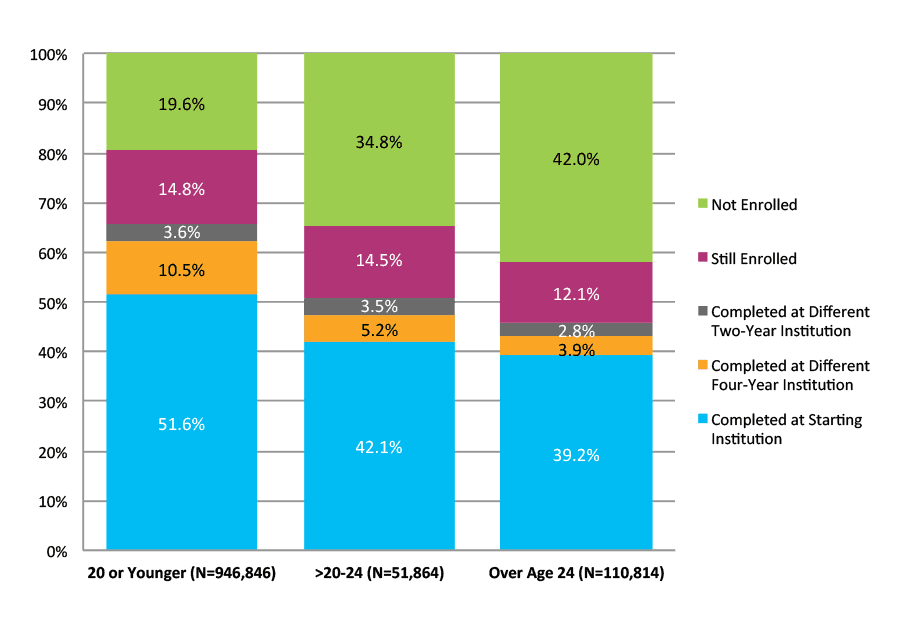
Six-Year Outcomes by Age at First Entry
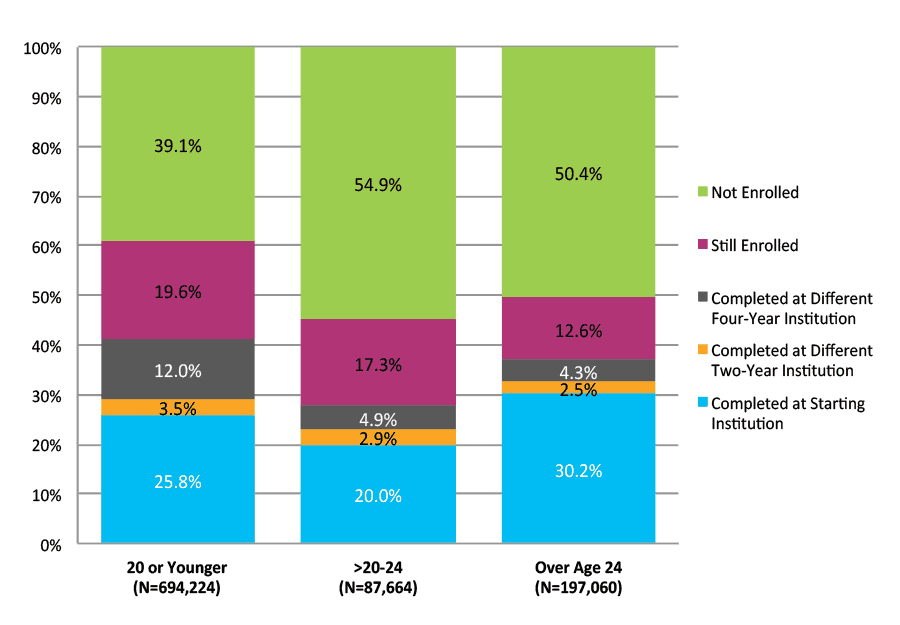
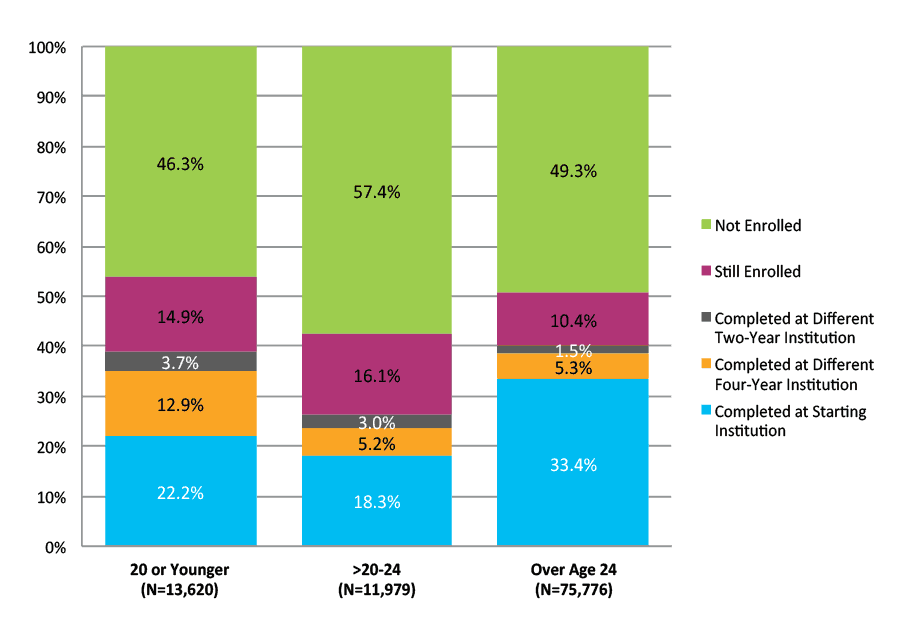
Figure 8. Six-Year Outcomes by Age at First Entry (N=2,659,715)
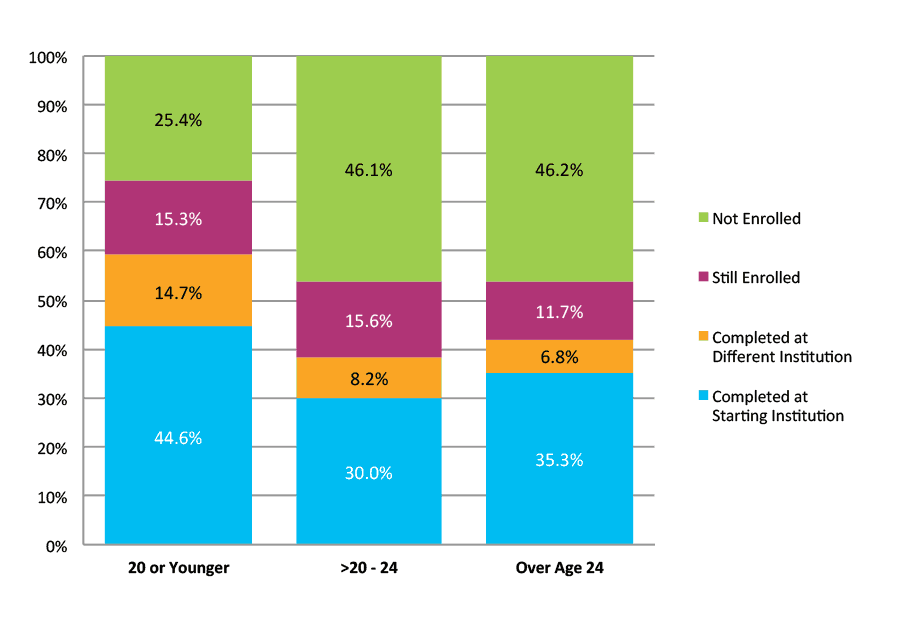
NOTE: Students with missing birth date data were excluded from the figure above. This figure is based on data shown in Appendix C, Table 9.
Figure 9. Completion at Starting vs. Different Institution by Age at First Entry (N=1,466,316)
NOTE: Students with missing birth date data were excluded from the figure above. This figure is based on data shown in Appendix C, Table 9.
Six-Year Outcomes Age at First Entry and Gender
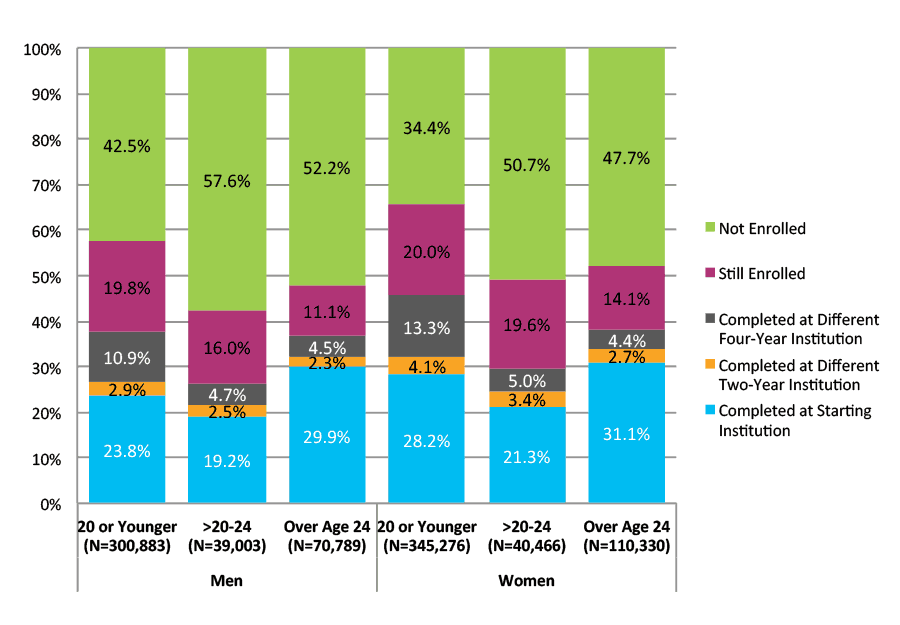
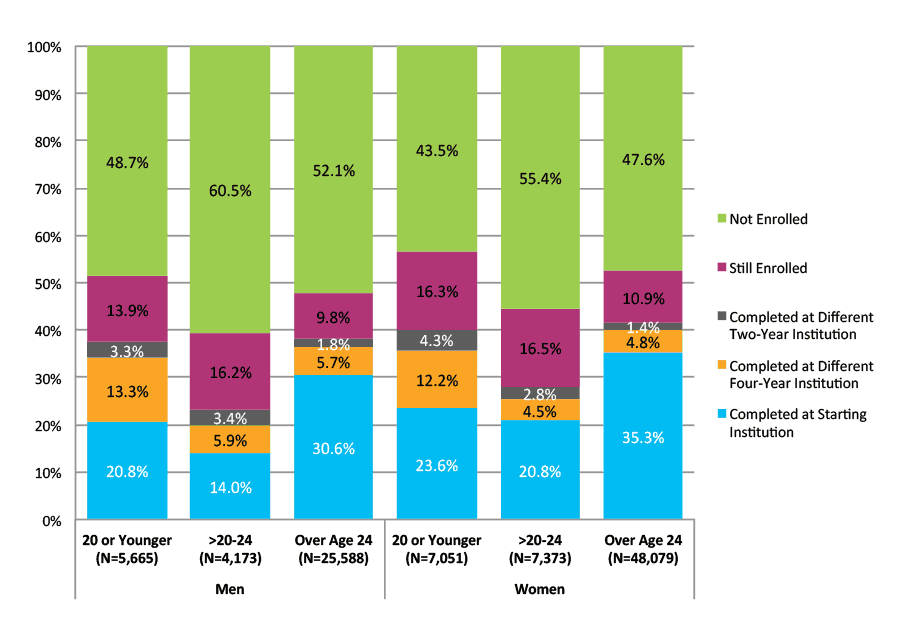
Figure 10. Six-Year Outcomes by Age at First Entry and Gender (N=2,473,797)
NOTE: Students with missing birth date and/or gender data were excluded from the figure above. This figure is based on data shown in Appendix C, Table 10.
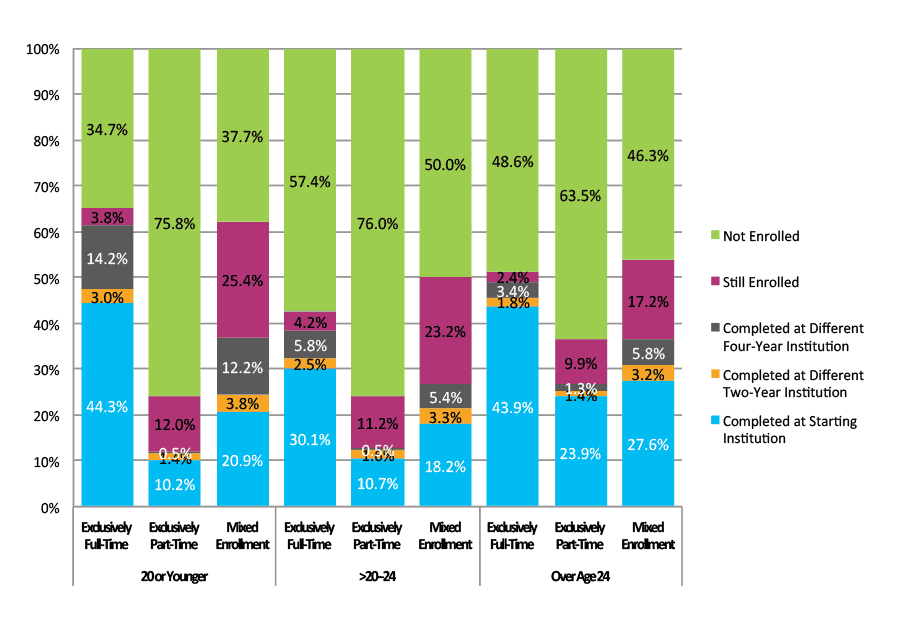
Six-Year Outcomes by Age at First Entry and Enrollment Intensity
Figure 11. Six-Year Outcomes by Age and Enrollment Intensity (N=2,658,444)
NOTE: Students with missing birth date data were excluded from the figure above. This figure is based on data shown in Appendix C, Table 11.
Six-Year Outcomes by Starting Institution Type
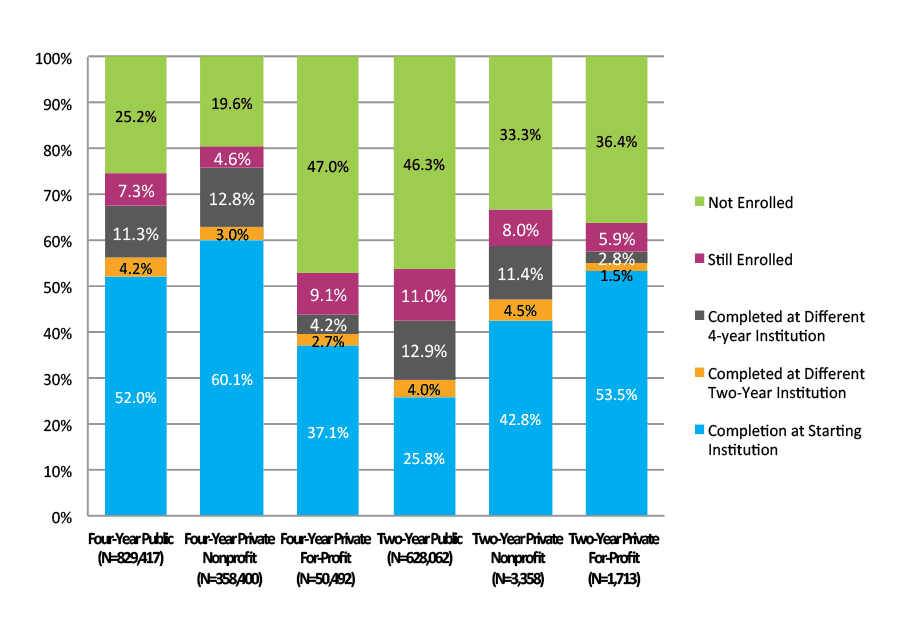
Figure 12. Six-Year Outcomes by Starting Institution Type (N=2,668,496)
*This figure is based on data shown in Appendix C, Table 14.
Figure 13. Completion at Starting vs. Different Institution by Starting Institution Type (N=1,468,459)
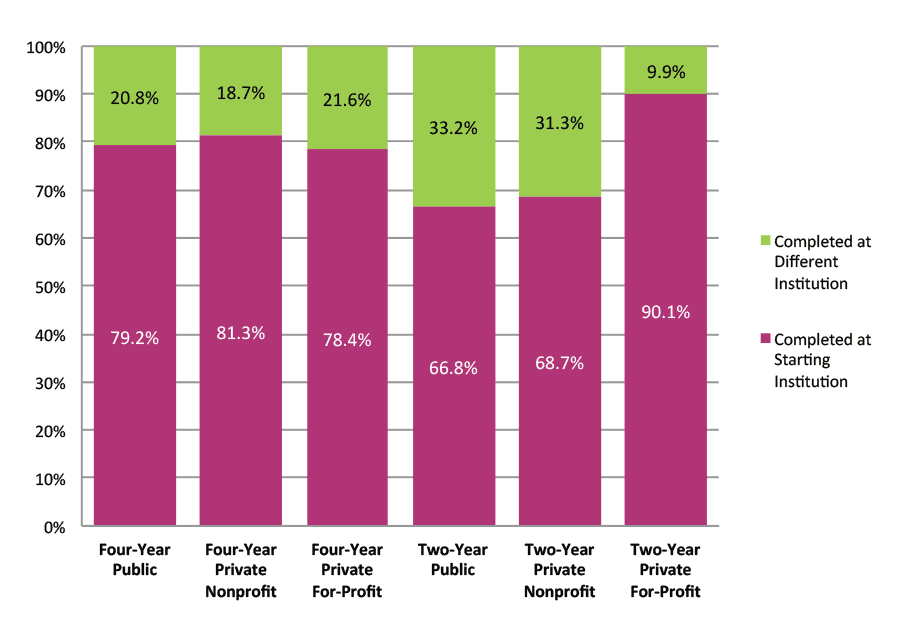
*This figure is based on data shown in Appendix C, Table 14.
STUDENTS WHO STARTED AT FOUR-YEAR PUBLIC INSTITUTIONS
Figures 14 through 18 highlight the six‐year outcomes of students who started at four‐year public institutions.
Overall, 62.8 percent of the cohort completed a degree within six years (Figure 14), a decrease of a half percentage point from that of fall 2007 cohort. It should be noted, however, that the decrease is the result of an expanded institutional sample: the institutions that were included in the 2008 sample, but not in the fall 2007 cohort study, either because they were new Clearinghouse participants or their classification as a two-year institution in fall 2007 was changed to a four-year institution in 2008.
Students who entered college at younger ages completed within six years at higher rates. Traditional-age students showed a completion rate of 65.7 percent, followed by slightly over half of the students who were over age 20 through age 24 (50.8 percent), and then by less than half of those who were over age 24 (45.9 percent) (Figure 16). Mixed enrollment students had the highest proportion of students (24.4 percent) who were still enrolled at the end of the study period (Figure 14).
Figure 14. Six-Year Outcomes for Students Who Started at Four-Year Public Institutions by Enrollment Intensity (N=1,113,125)
*This figure is based on data shown in Appendix C, Table 15.
Figure 15. Six-Year Outcomes for Students Who Started at Four-Year Public Institutions by Gender (N=1,033,858)
NOTE: Students with missing gender data were excluded from the figure above. This figure is based on data shown in Appendix C, Table 16.
Figure 16. Six-Year Outcomes for Students Who Started at Four-Year Public Institutions by Age at First Entry (N=1,109,523)
NOTE: Students with missing birth date data were excluded from the figure above. This figure is based on data shown in Appendix C, Table 17.
Figure 17. Six-Year Outcomes for Students Who Started at Four-Year Public Institutions by Gender and Age at First Entry (N=1,030,897)
NOTE: Students with missing birth date and/or gender data were excluded from the figure above. This figure is based on data shown in Appendix C, Table 18.
Figure 18. Six-Year Outcomes for Students Who Started at Four-Year Public Institutions by Age at First Entry and Enrollment Intensity (N=1,109,352)
NOTE: Students with missing birth date data were excluded from the figure above. This figure is based on data shown in Appendix C, Table 19.
STUDENTS WHO STARTED AT TWO-YEAR PUBLIC INSTITUTIONS
Figures 19 through 26 illustrate the six‐year outcomes for students who started at two‐year public institutions.
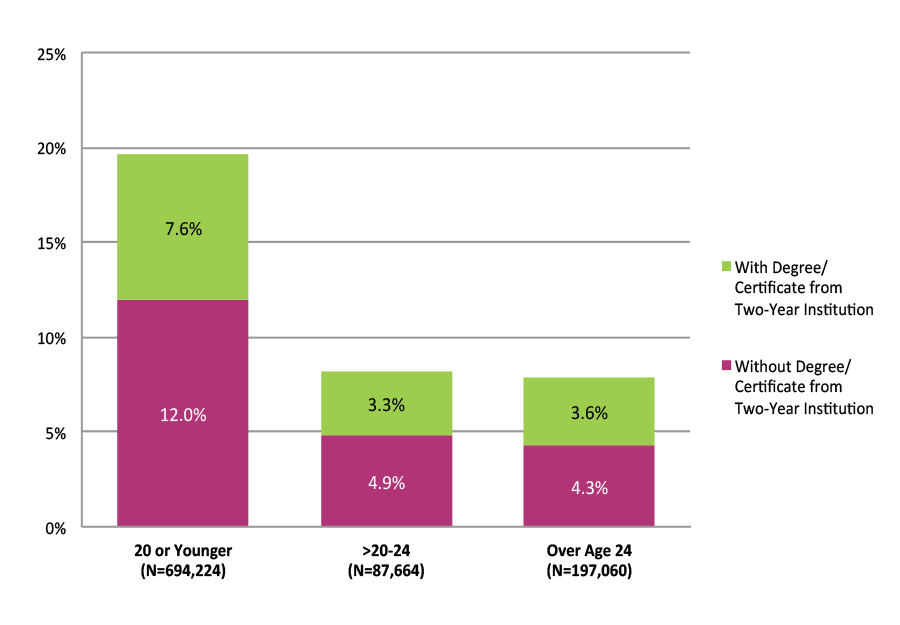
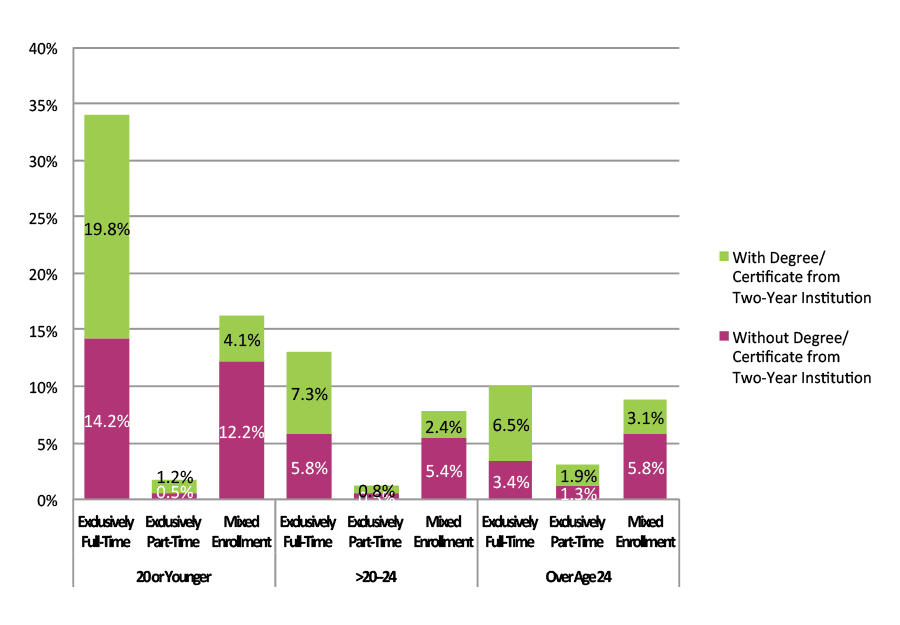
Overall, 39.1 percent of the cohort had completed a degree or certificate by the end of the study period. The completion rate was much higher for students enrolled exclusively full time (57.0 percent) than for those enrolled exclusively part time (18.2 percent) or who had mixed enrollment (35.9 percent), as shown in Figure 19. Overall, 16.2 percent of two-year starters had completed a degree at a four-year institution by the end of the study period. Over half of these did so without first obtaining a two-year degree (60.4 percent of the four-year degree earners or 9.8 percent of the full cohort who started at two-year institutions). Regardless of the age group, higher proportions of exclusively full-time students who completed at four-year institutions did so with a credential from a two-year institution, emphasizing the role two-year institutions play in achieving national completion goals (Figure 26).
Figure 19. Six-Year Outcomes and First Completion for Students Who Started at Two-Year Public Institutions by Enrollment Intensity (N=983,433)
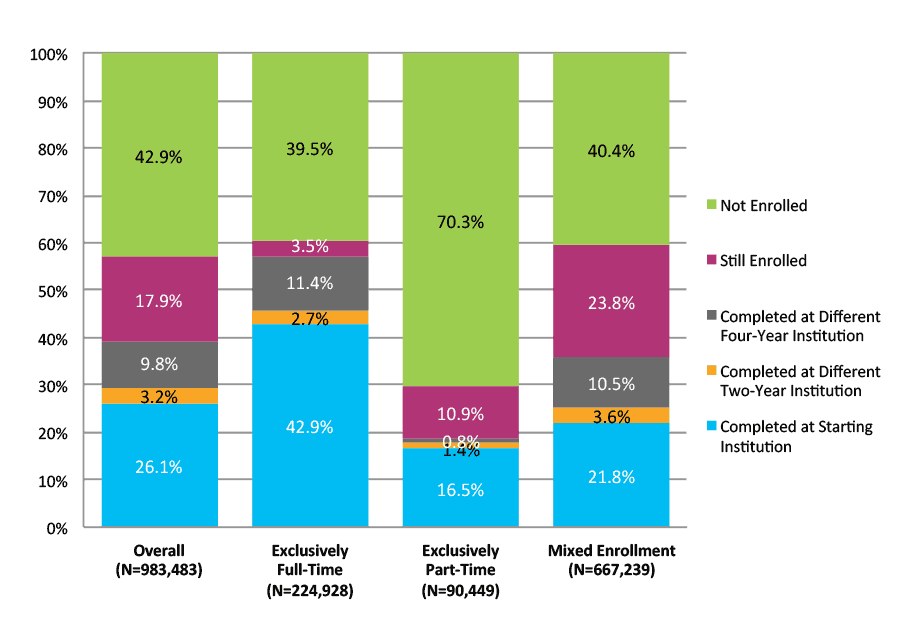
*This figure is based on data shown in Appendix C, Table 22.
Figure 20. Completion at Four-Year Institutions for Students Who Started at Two-Year Public Institutions by Enrollment Intensity (N=983,433)
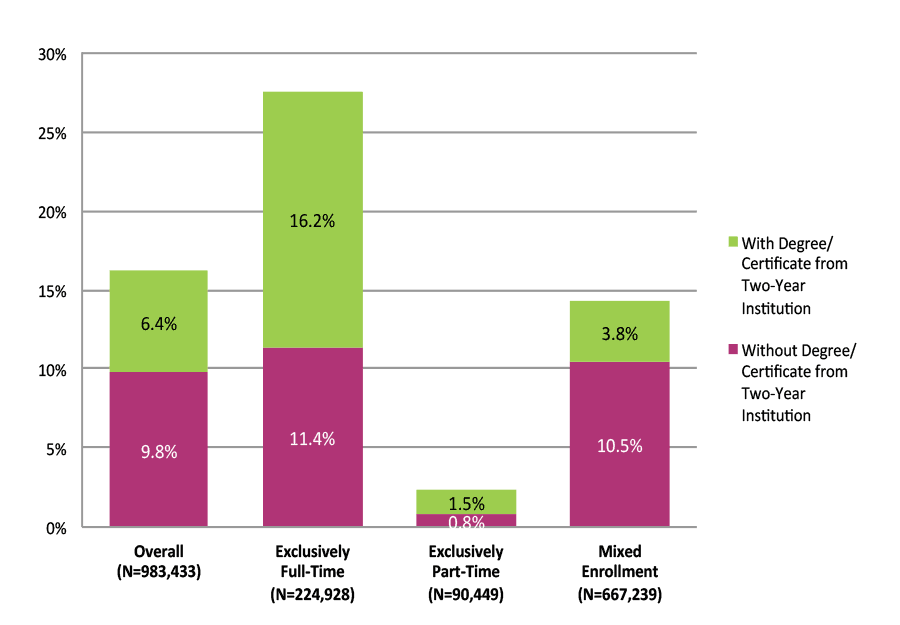
*This figure is based on data shown in Appendix C, Table 22.
Figure 21. Six-Year Outcomes and First Completion for Students Who Started at Two-Year Public Institutions by Gender (N=910,485)
NOTE: Students with missing gender data were excluded from the figure above. This figure is based on data shown in Appendix C, Table 23.
Figure 22. Six-Year Outcomes and First Completion for Students Who Started at Two-Year Public Institutions by Age at First Entry (N=978,948)
NOTE: Students with missing birth date data were excluded from the figure above. This figure is based on data shown in Appendix C, Table 24.
Figure 23. Completion at Four-Year Institutions among Students Who Started at Two-Year Public Institutions by Age at First Entry (N=978,948)
NOTE: Students with missing birth date data were excluded from the figure above. This figure is based on data shown on Appendix C, Table 24.
Figure 24. Six‐Year Outcomes and First Completion for Students Who Started at Two‐Year Public Institutions by Gender and Age at First Entry (N=906,747)
NOTE: Students with missing birth date and/or gender data were excluded from the figure above. This figure is based on data shown in Appendix C, Table 25.
Figure 25. Six-Year Outcomes and First Completion for Students Who Started at Two-Year Public Institutions by Age at First Entry and Enrollment Intensity (N=978,139)
NOTE: Students with missing birth date data were excluded from the figure above. This figure is based on data shown in Appendix C, Table 26.
Figure 26. Completion at Four-Year Institutions Among Students Who Started at Two-Year Public Institutions By Age at First Entry and Enrollment Intensity (N=978,139)
NOTE: Students with missing birth date data were excluded from the figure above. This figure is based on data shown in Appendix C, Table 26.
STUDENTS WHO STARTED AT FOUR-YEAR PRIVATE NONPROFIT INSTITUTIONS
Figures 27 through 31 show the six‐year outcomes for students who started at four‐year private nonprofit institutions.
Overall, 73.6 percent of the cohort had completed a degree or certificate by the end of the study period (Figure 27). Women had a higher completion rate than men (76.9 and 69.8 percent, respectively). The pattern changed for adult learners when disaggregated by gender and age at first entry, with men in this age group having a slightly higher completion rate than women (55.5 and 54.0 percent, respectively). When disaggregated by age, the proportion of students no longer enrolled at the end of the study period increased with each age group (Figure 29). However, disaggregation by age and enrollment intensity showed that the pattern was reversed for exclusively part-time students for whom the proportion of students no longer enrolled at the end of the study period was the lowest for adult learners and highest for traditional-age students (Figure 31).
Figure 27. Six-Year Outcomes for Students Who Started at Four-Year Private Nonprofit Institutions by Enrollment Intensity (N=464,805)
*This figure is based on data shown in Appendix C, Table 36.
Figure 28. Six-Year Outcomes for Students Who Started at Four-Year Private Nonprofit Institutions by Gender (N=433,621)
NOTE: Students with missing gender data were excluded from the figure above. This figure is based on data shown in Appendix C, Table 37.
Figure 29. Six-Year Outcomes for Students Who Started at Four-Year Private Nonprofit Institutions by Age at First Entry (N=464,158)
NOTE: Students with missing birth date data were excluded from the figure above. This figure is based on data shown in Appendix C, Table 38.
Figure 30. Six-Year Outcomes for Students Who Started at Four-Year Private Nonprofit Institutions by Gender and Age at First Entry (N=433,028)
NOTE: Students with missing birth date and/or gender data were excluded from the figure above. This figure is based on data shown in Appendix C, Table 39.
Figure 31. Six-Year Outcomes for Students Who Started at Four-Year Private Nonprofit Institutions by Age at First Entry and Enrollment Intensity (N=463,962)
NOTE: Students with missing birth date data were excluded from the figure above. This figure is based on data shown in Appendix C, Table 40.
STUDENTS WHO STARTED AT FOUR-YEAR PRIVATE FOR-PROFIT INSTITUTIONS
Figures 32 through 36 show the six‐year outcomes for students who started at four‐year private for-profit institutions.
Overall, 38.4 percent of the cohort had completed postsecondary education by the end of the study period (Figure 32), a decrease of 3.9 percentage points from the previous year’s cohort. The initial cohort, on the other hand, showed a substantial increase (35 percent) over the previous year. Changes in both the initial cohort and the completion rate should be considered in the context of the recession occurring at the time (for more detail, see Discussion).
With only a 3.4 percentage point difference, the gender gap in favor of women is the narrowest among those who started in four-year private for-profit institutions among all institutional sectors. When disaggregated by age, adult learners had the highest completion rate (40.2 percent) followed by traditional-age students (38.8 percent) (Figure 34). The pattern remained unchanged for exclusively full-time and exclusively part-time students: within both enrollment intensity categories, adult learners had the highest completion rates.
Figure 32. Six-Year Outcomes for Students Who Started at Four-Year Private For-Profit Institutions by Enrollment Intensity (N=101,426)
*This figure is based on data shown in Appendix C, Table 43.
Figure 33. Six-Year Outcomes for Students Who Started at Four-Year Private For-Profit Institutions by Gender (N=97,977)
NOTE: Students with gender data missing were excluded from the figure above. This figure is based on data shown in Appendix C, Table 44.
Figure 34. Six-Year Outcomes for Students Who Started at Four-Year Private For-Profit Institutions by Age at First Entry (N=101,375)
NOTE: Students with missing birth date data were excluded from the figure above. This figure is based on data shown in Appendix C, Table 45.
Figure 35. Six-Year Outcomes for Students Who Started at Four-Year Private For-Profit Institutions by Gender and Age at First Entry (N=97,930)
NOTE: Students with missing birth date and/or gender data were excluded from the figure above. This figure is based on data shown in Appendix C, Table 46.
Figure 36. Six-Year Outcomes for Students Who Started at Four-Year Private For-Profit Institutions by Age at First Entry and Enrollment Intensity (N=101,283)
NOTE: Students with missing birth date data were excluded from the figure above. This figure is based on data shown in Appendix C, Table 47.
COMPLETION ACROSS STATE LINES
Figures 37 through 41 reveal six‐year outcomes for students who completed at institutions across state lines.
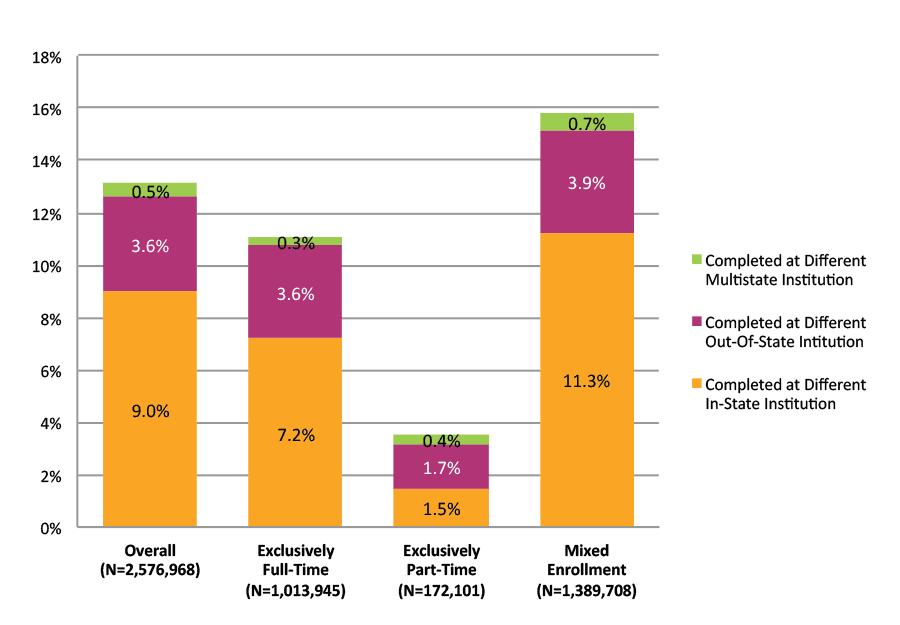
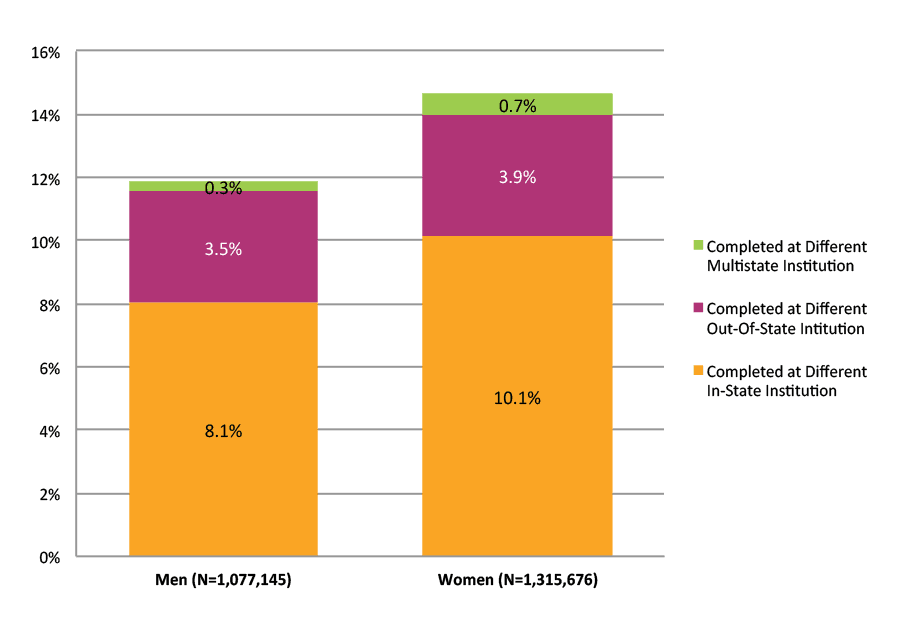
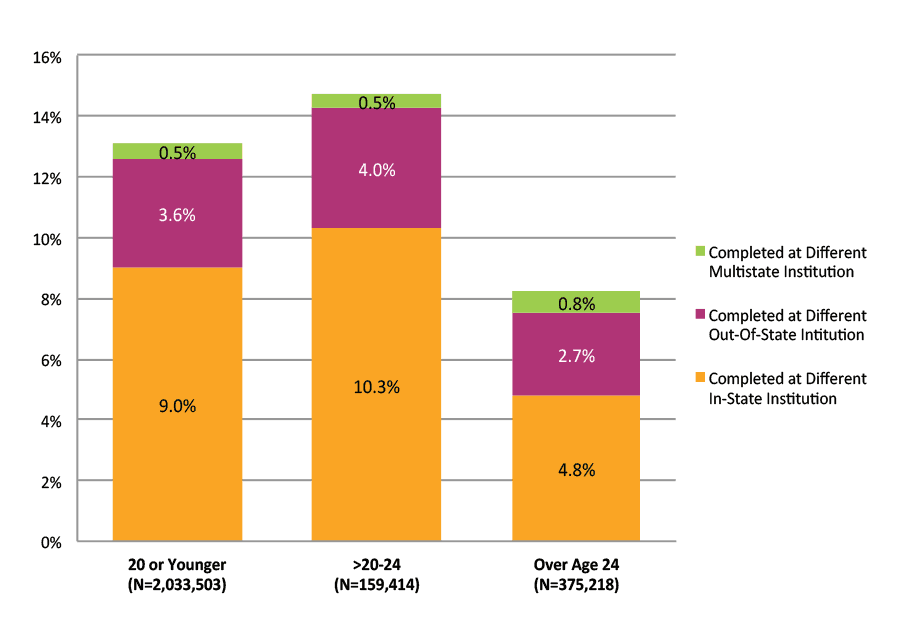
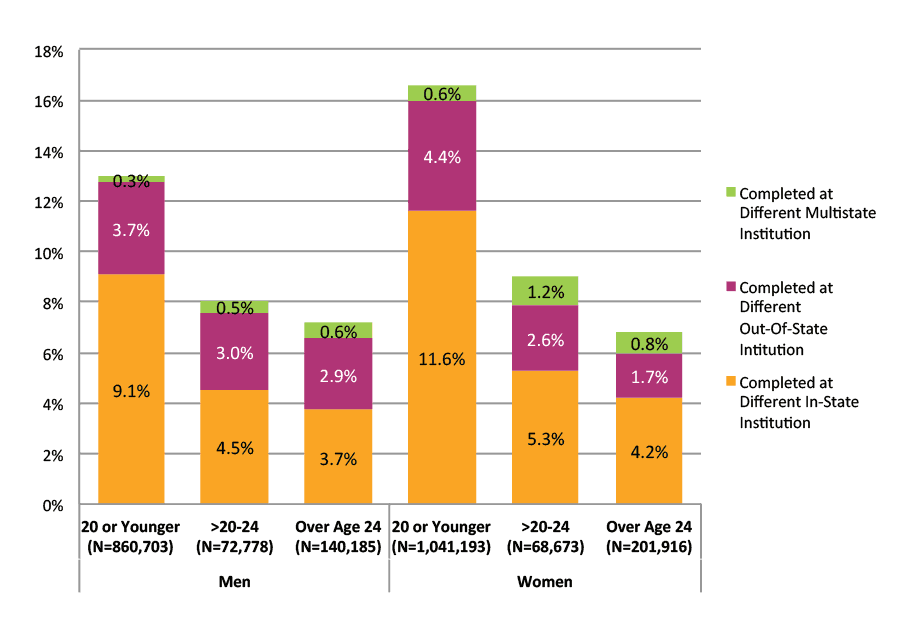
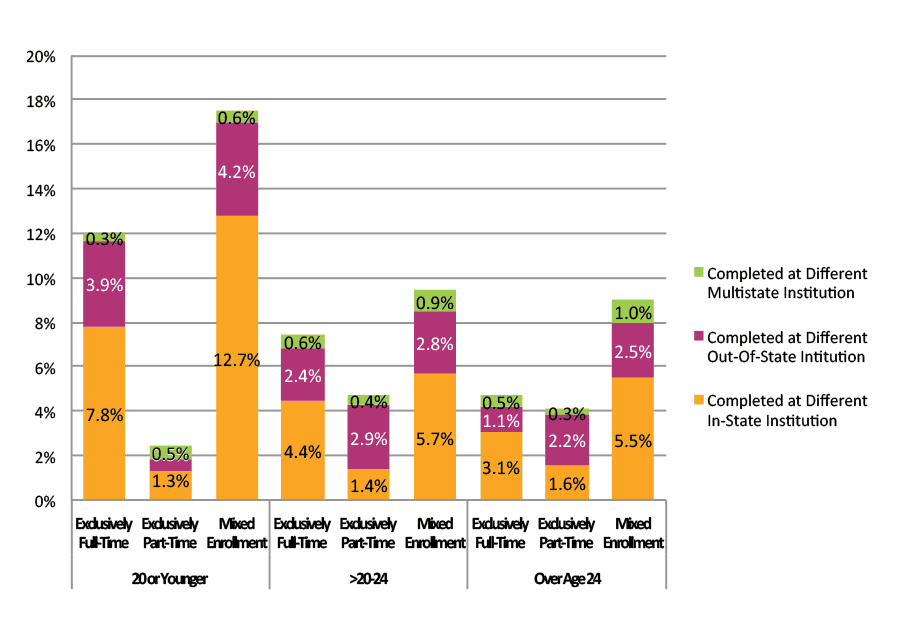
Overall, 9.0 percent of the cohort completed at a different in-state institution, 3.6 percent completed at a different out-of-state institution, and 0.5 percent completed at a different multistate institution (Figure 37). Traditional-age students who showed mixed enrollment had the highest completion rates at a different in- or out-of-state institution than any other age group and enrollment intensity pairing (Figure 41). Men and women completed at a different out-of-state institution at similar rates (3.5 percent and 3.9 percent, respectively) (Figure 38).
Students who enrolled exclusively part time showed a lower completion rate (1.7 percent) across state lines than students enrolled exclusively full time (3.6 percent) and mixed enrollment students (3.9 percent) (Figure 37). This outcome may reflect the demands, interests, and mobility of part-time students, who may need to remain at one institution for the duration of their post-secondary education.
Figure 37. Completion at Different Institutions across State Lines by Enrollment Intensity
NOTE: Students who started at a multistate institution were excluded from the figure above. This figure is based on data shown in Appendix C, Table 50.
Figure 38. Completion at Different Institutions across State Lines by Gender
NOTE: Students with missing gender data missing and those who started at a multistate institution were excluded from the figure above. This figure is based on data shown in Appendix C, Table 51.
Figure 39. Completion at Different Institutions across State Lines by Age at First Entry
Note: Students with missing birth date data and those who started at a multistate institution were excluded from the figure above. This figure is based on data shown in Appendix C, Table 52.
Figure 40. Completion at Different Institutions across State Lines by Gender and Age at First Entry
Note: Students with missing birth date and/or gender data and those who started at a multistate institution were excluded from the figure above. This figure is based on data shown in Appendix C, Table 53.
Figure 41. Completion at Different Institutions across State Lines by Age at First Entry and Enrollment Intensity
Note: Students with missing birth date data and those who started at a multistate institution were excluded from the figure above. This figure is based on data shown in Appendix C, Table 54.
SUPPLEMENTAL FEATURE: EIGHT-YEAR OUTCOMES FOR FALL 2006 COHORT
This supplemental feature examines the results of first‐time students who began college in fall 2006, the cohort at the focus of Signature Report 4, which was released in November 2012. In this part of the report, we showcase eight-year outcomes of this cohort as compared to their sixth and seventh year outcomes.
OUTCOMES BY ENROLLMENT INTENSITY
Figure S-1. Eight-Year Outcomes for Fall 2006 Cohort by Enrollment Intensity (N=1,871,443)
*This figure is based on data shown in Appendix C, Table S-1.
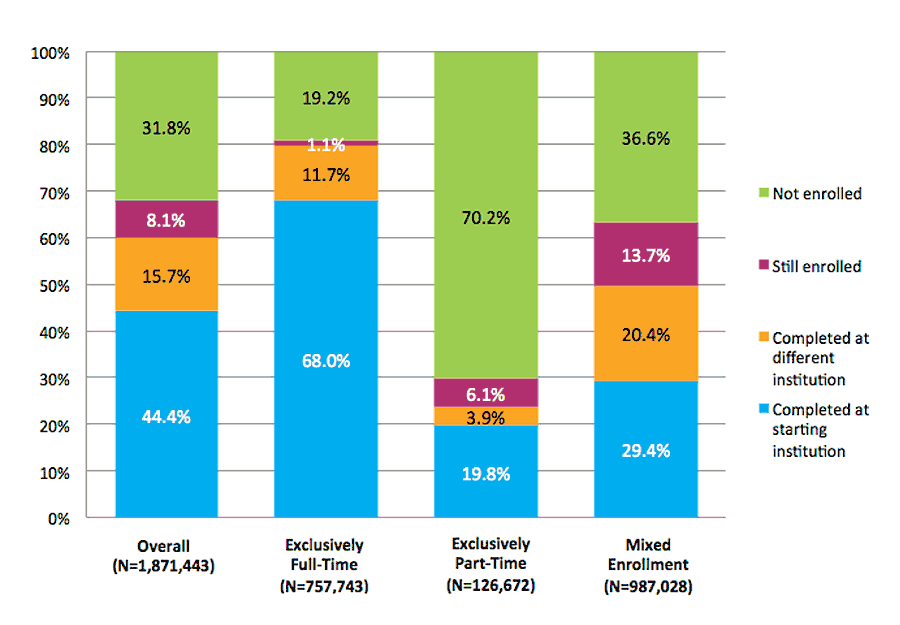
Figure S-1 presents eight-year outcomes for the fall 2006 cohort, including first degree or certificate completion, continuing enrollment during the last year of the study period, and stop‐out. Results are shown for the full cohort and broken out by enrollment intensity to show outcomes for students who were enrolled exclusively full time, exclusively part time, and who had mixed enrollment (i.e., enrolled both part time and full time during the study period). Overall, 44.4 percent of the cohort completed first at their starting institution and an additional 15.7 percent completed first at a different institution, for a combined completion rate of 60.1 percent nationally. This represents a six percentage point increase in total completions over the six‐year rate and a two percentage point increase over the seven-year rate.
The total completion rate for exclusively part-time students increased from 20.6 percent in the sixth year to 23.7 percent in the eighth year, including 19.8 percent who completed first at their starting institution and 3.9 percent who completed first at a different institution. While the completion rate increased by 3.1 percentage points, there was a 5.3 percentage point decline in persistence, which increased the six-year stop-out rate from 68 percent to 70.2 percent in the eighth year.
The largest increase in the completion rate from six to eight years was observed for mixed enrollment students (40.9 percent and 49.8 percent, respectively). The percentage of those who were still enrolled decreased from the sixth year rate of 26.8 percent to 13.7 percent in the eighth year, resulting in an increase in the proportion of students who stopped out of postsecondary education by 4.2 percentage points (from 32.4 percent to 36.6 percent).
COMPLETION AT STARTING VS. DIFFERENT INSTITUTION
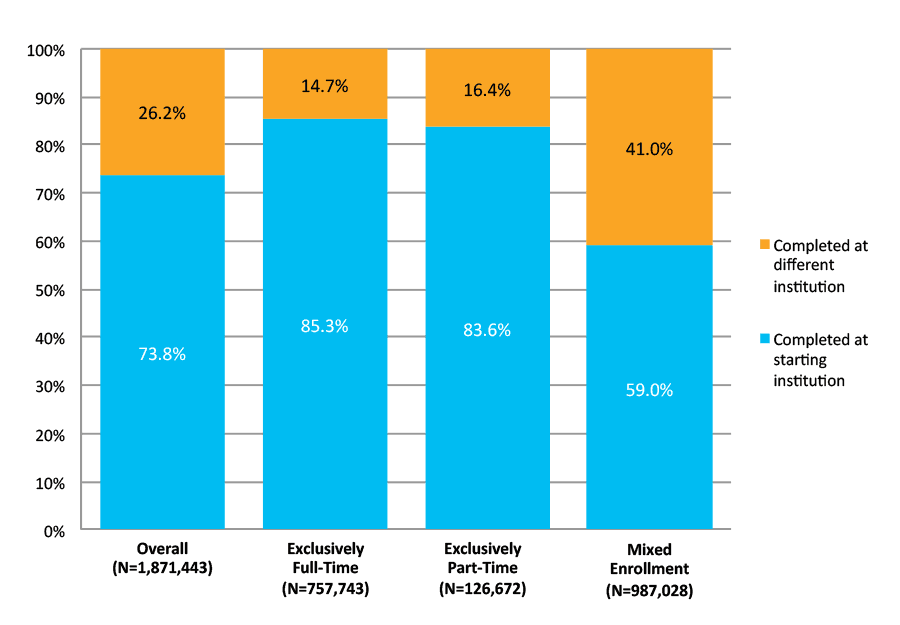
Figure S-2. Eight-Year Completion Outcomes at Starting vs. Different Institution by Enrollment Intensity for Fall 2006 Cohort
*This figure is based on data shown in Appendix C, Table S-1.
Figure S-2 shows the proportion of completers who completed first at their starting institution versus at a different institution for each enrollment intensity group. Overall, over a quarter of students with at least one completion record (26.2 percent) completed their first degree or certificate at an institution other than their starting institution. The proportion of completions happening elsewhere in the sixth year was 22.4 percent for this cohort.
OUTCOMES BY AGE AT FIRST ENTRY
Figure S-3. Eight-Year Outcomes for Fall 2006 Cohort by Age at First Entry (N=1,856,104)
Note: Students with date of birth data missing were excluded from the above figure. *This figure is based on data shown in Appendix C, Table S-2.
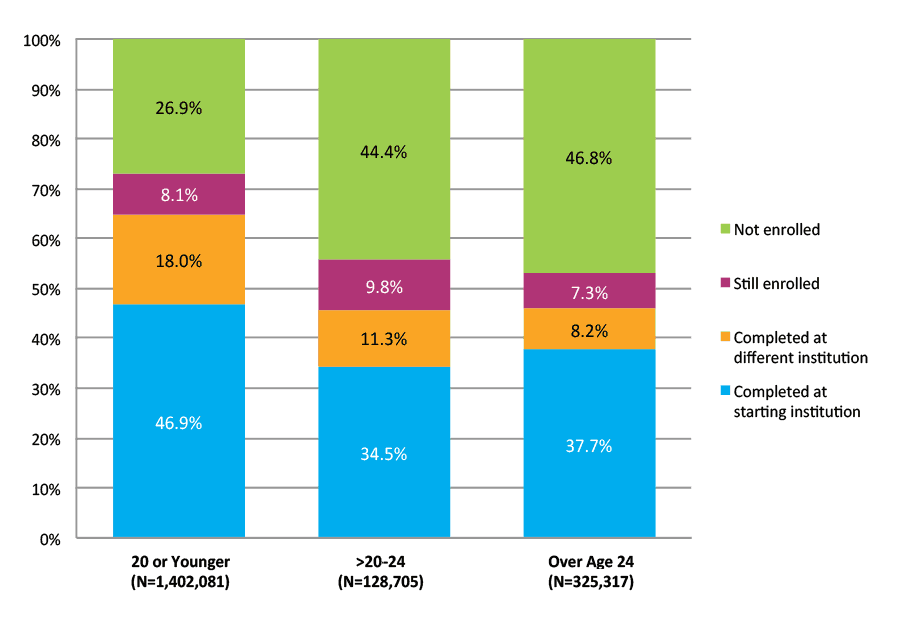
Figure S-3 shows eight-year completion and persistence outcomes for the fall 2006 cohort by age at first entry. Adult learners showed an eight-year total completion rate of 45.9 percent, a gain of about 4 percentage points over the six-year rate.
Among traditional-age students, 46.9 percent completed first at their starting institution and an additional 18 percent completed their first degree or certificate at a different institution, for a combined completion rate of 64.9 percent. The completion rate for this group showed a 2.2 percent point increase in total completion rates over the seven-year rate. The eight-year total completion rate for delayed entry students was 45.8 percent, which was 1.7 percentage points higher than the seven-year completion rate for this age group.1
1The six-year completion rate was reported for an age group of those 24 or younger, combining traditional-age and delayed entry students. As a result, separate comparisons of eight-year and six-year outcomes for these two age groups are not available.
OUTCOMES BY STARTING INSTITUTION TYPE
Figure S-4. Eight-Year Outcomes for Fall 2006 Cohort by Starting Institution Type (N=1,871,443)
*This figure is based on data shown in Appendix C, Table S-3.
Figure S-4 further disaggregates eight-year outcomes by the type of institution where students first enrolled. Students who started in four-year public institutions showed an eight-year total completion rate of 67.5 percent, a gain of about 7 percentage points over the six‐year rate. The eight-year total completion rate for students who started in two-year public institutions in 2006 was 6.4 percentage points higher than their six-year total completion rate.
Discussion for 2008 Cohort and the Changes from 2007 Cohort
To form an accurate understanding of our progress toward national college completion goals, it is important that institutions, policymakers, and researchers consider the complexity of postsecondary student pathways. As a contribution to this inquiry, this Signature Report focuses on students’ first college completions. It encompasses postsecondary credentials of all levels and types, accounting both for students who finish at their starting institution and those who transfer and finish at any other institution, nationwide. In this report, we convey the full range of students’ enrollment behaviors into a national view of college completion. This view documents the postsecondary pathways and outcomes of a comprehensive student cohort, including nontraditional‐age students and those with part‐time or mixed enrollment statuses.
The cohort studied in this report entered college at the peak of economic recession (National Bureau of Economic Research, 2008; 2010). During this period, the challenges facing higher education institutions included shifts in enrollment patterns (enrollment increases in community colleges and for-profit institutions and flat or declining enrollments in public and private nonprofit institutions), uncertainties regarding affordability and financial aid, and cuts in state support of public institutions (Barr and Turner, 2013). The official end of the Great Recession is considered to be June 2009 (National Bureau of Economic Research, 2010). However, its effect on colleges and universities continued through 2009, leading to further enrollment surges that strained resources at many institutions, particularly those of community colleges, even more when this cohort was just through their first year.
The fall 2008 cohort shows the effects of the Great Recession in both its size and composition. The overall cohort was 12 percent larger than in fall 2007 (about 2.7 million and 2.4 million, respectively), and there was a 20 percent increase in the number of older students. The share of the total cohort made up by those who enrolled at less than full-time status increased by 1.5 percentage points. The share of students enrolled in community colleges and four-year private for-profit institutions increased by about one percentage point each. These attributes – older students, part-time enrollments, starting at community colleges and for-profit institutions – are associated in this and previous reports with lower completion rates.
OVERALL COMPLETION RATES
The overall national six-year completion rate for the fall 2008 cohort was 55.0 percent, a decrease from the completion rate of 56.1 percent for the fall 2007 cohort. A small decrease, less than one percentage point, was also observed in the rate of still enrolled students. With some decreases in both the total completion rate and persistence rate, the rate of those who were no longer enrolled at the end of the study period – those who had stopped out or left higher education with no degree or certificate – increased from 28.6 percent for the fall 2007 cohort to 30.3 percent for the fall 2008 cohort. However, examining the rates by age and enrollment intensity reveals that some student populations experienced larger declines in their attainment rates while others stayed the same or actually increased.
COMPLETION RATES BY AGE AT FIRST ENTRY AND ENROLLMENT INTENSITY
In this study, we continued to present analyses based on three age groups: students who began postsecondary education immediately after high school (age 20 or younger), those who delayed entry for a few years (over age 20 through 24), and adult students (over age 24). Comparisons with the results for fall 2007 cohort show that the decline in completion rates was concentrated in the nontraditional-age students. Specifically, for the delayed entry group, the completion rate was 2.6 percentage points lower (38.3 and 40.9 percent, respectively). Adult learners had a decrease of 1.4 percentage points in their completion rate (42.1 and 43.5 percent, respectively). A decrease in the completion rate was observed for all students in these two age groups regardless of the enrollment intensity group they were in. The pattern stayed consistent when we examined the results for men and women separately: within both gender groups the biggest decrease in the completion rate was in the delayed entry group.
Traditional-age students had a smaller decline, one-half of a percentage point. This decline is attributable almost entirely to a small shift away from full-time enrollment among these students. The completion rate for those who were enrolled exclusively full time was unchanged from the fall 2007 cohort, and there was actually a small increase (0.3 percentage points) for those who had mixed enrollments. There was a small decline in the completion rate of those enrolled exclusively part time.
In a similar finding to last year’s results, disaggregating by both age and enrollment intensity in the fall 2008 cohort revealed that part-time enrollment is less of a disadvantage to older students than to younger students. Exclusively part-time students over age 24 showed a higher completion rate than did part-time students in either of the two younger age groups: the completion rate was twice as large for adult learners than for students in the delayed entry group and almost three times larger than that for traditional-age part-time students (28.4 percent, 14.7 percent, and 10.9 percent, respectively). This is a reversal of the trend for full-time and mixed enrollment students, in which younger groups consistently complete at higher rates than older students. These differences across groups highlight the need for institutions to target and differentiate their efforts for improving student outcomes, tailoring advising and programs, to the extent possible, to align with the needs of different types of students. Traditional-age students attending part-time, for example, may be less experienced with juggling the multiple demands frequently associated with part-time enrollment (e.g., work, family responsibilities, and classes) than their older peers. Consequently, traditional-age part-timers may struggle more to persist and complete within a six-year time frame.
COMPLETION RATES FOR STUDENTS WHO STARTED AT FOUR-YEAR PUBLIC INSTITUTIONS
The completion rate for the fall 2008 cohort decreased a half percentage point from that of fall 2007 cohort (62.9 percent and 63.4 percent). The decrease is the result of an expanded institutional sample. Institutions were included in the 2008 sample, but not in the fall 2007 cohort study, either because they were new Clearinghouse participants or their classification as a two-year institution in fall 2007 was changed to a four-year institution in 2008 in IPEDS. If we exclude the latter group of institutions, the completion rate actually becomes slightly higher for four-year public institutions (63.7 percent for the fall 2008 cohort). However, including all institutions that were part of the four-year sector at the time the fall 2008 cohort entered postsecondary education in these results provides a more comprehensive picture of national college completion outcomes for four-year public institutions.
COMPLETION RATES FOR STUDENTS WHO STARTED AT TWO-YEAR PUBLIC INSTITUTIONS
In addition to examining the overall completion rates of students who started at two-year public institutions, we also looked at these students’ completions at four-year institutions, giving particular attention to whether they received their four-year degree with or without first earning a credential at a two-year institution. Overall, 16.2 percent of two-year starters completed a degree at a four-year institution by the end of the study period, and over half of these did so without first obtaining a two-year degree (60.4 percent of the four-year degree earners, or 9.8 percent of the full cohort who started at two-year institutions). This demonstrates that one in 10 students who started in two-year public institutions transferred and graduated from a four-year institution without receiving any credential from their starting (or from any other) two-year institution. Traditional graduation rate measures that focus only on completions at the starting institution do not account for this type of outcome, even though it is a well-worn pathway receiving increasing attention in today’s resource-constrained policy environment.
The total four-year completion rate for two-year starters dropped by one percentage point from the rate reported for the fall 2007 cohort (16.2 percent and 17.2 percent, respectively). This may partly be the result of the enrollment increases for older students brought about by the Great Recession. However, the total four-year completion for traditional-age two-year starters also declined 0.8 percentage points. With almost half of all college enrollments for graduates from low-income high schools occurring in two-year institutions (NSCRC, 2014), even an unchanged four-year completion rate for two-year starters is not good news. For many disadvantaged students, enrolling in a community college is the only entry point to postsecondary education. In light of this finding, improving community college/four-year institution partnerships is even more important.
At the same time, it is important to recognize that many students who start college at two-year institutions are not seeking bachelor’s degrees at all. Thus, our report emphasizes the total completion rate for two-year starters, regardless of whether the completion occurs at a two-year or four-year institution. For the fall 2008 cohort, this rate declined by 0.7 percentage points, from 39.8 percent for the fall 2007 cohort to 39.1 percent. The decline was roughly split between a lower rate of completions at the starting institution and at transfer institutions.
COMPLETION RATES FOR STUDENTS WHO STARTED AT FOUR-YEAR FOR-PROFIT INSTITUTIONS
The six-year completion rate for those who started in four-year for-profit institutions in fall 2008 (38.4 percent) decreased dramatically from that of the previous year’s cohort (42.3 percent), dropping 3.9 percentage points. There was a bigger decline in the completion rate for men (5.2 percentage points) than for women (4.1 percentage points). This widened the gender gap from 2.5 percentage points to 3.6, in favor of women.
Combining the decline in the completion rate with a 1.7 percentage point decline in the rate of those who were still enrolled at the end of the study period, the percentage of the cohort who had stopped out or dropped out without a degree or certificate increased from 44.3 percent for the fall 2007 cohort to 49.9 percent for the fall 2008 cohort. While fully one-half of the students no longer appeared to be pursuing a credential by the end of the study period many of them may never have been seeking an academic credential in the first place. Older students returning to education from the workforce may have sought training or experience leading to non-academic certifications, or simply an opportunity to gain skills while waiting for the employment climate to improve.
It should also be noted that the size of the cohort for this sector increased substantially from fall 2007 to fall 2008, by 35 percent, despite unchanged coverage rates in the Clearinghouse data. This suggests that many opted to enroll in four-year for-profit institutions only as a response to the deepening recession. Thus, the dramatic decline in completion rates could also be attributable to improving economic conditions later in these students’ education, which may have led some to leave school in order to re-enter labor market.
EIGHT-YEAR OUTCOMES FOR FALL 2006 NATIONAL COHORT
This report’s supplemental feature examined eight-year outcomes for the fall 2006 cohort, tracking their enrollment patterns through spring 2014. The two additional years make a noticeable difference. Within eight years of starting, 44.4 percent of the 2006 cohort completed at their starting institution and an additional 15.7 percent completed at a different institution, for a combined completion rate of 60.1 percent nationally. This represents a 6 percentage point increase in total completions over the six‐year rate and a 2 percentage point increase over the seven-year rate. At the same time, the percentage of students who were still enrolled at the end of the eight-year period declined by 8 percentage points compared to the six-year period (16.1 percent).
Results show that students who required two more years to complete their first degree mostly have done so at a different institution from where they started. After eight years, more than one-quarter (26.2 percent) of all completers had earned their first credential somewhere other than at their starting institution, compared to 22.4 percent of the same cohort when completions were measured at the six-year point. This suggests that the longer we track the outcomes for a given cohort, the more diverse the students’ pathways to those outcomes become. Among students with mixed enrollment, however, the seven‐year and eight-year total completion rate showed a marked increase (46.5 and 49.8 percent, respectively) over the six-year completion rate for the same cohort (40.9 percent).
Examining the increases in the completion rate from six years to eight years by enrollment intensity revealed larger increases for part-time and mixed enrollment students than for traditional-age students. The eight-year completion rate had a 22 percent increase over the six-year rate for mixed enrollment students and a 15 percent increase for exclusively part-time students. The completion rate for exclusively full-time students increased only 5 percent from the sixth to the eighth year. The eight-year completion rate for adult learners in the fall 2006 cohort was 45.9 percent, which was 9 percent higher than the six-year completion rate for this group.
IMPLICATIONS FOR PUBLIC POLICYMAKING
The effects of the Great Recession on attainment rates is a significant part of this year’s report. The fall 2008 cohort reflected an increase in enrollments, particularly in community colleges and for-profit institutions, and a decline in the overall national completion rate. However, the report also demonstrates the importance of disaggregating the range of postsecondary educational pathways that different types of students pursue. Taking advantage of the Clearinghouse’s unique student-level data enables us to understand the change in outcomes for the 2008 cohort in the context of the variations in attainment rates for students of different entering characteristics and enrollment behaviors. Thus, we note that much of the decline in the completion rate of the full cohort disappears when the analysis focuses on equivalent comparisons of students with similar enrollment behaviors at similar institutions.
This analysis is not meant to suggest that policy is powerless to effect change for particular types of students or institutions. Indeed, the report points to specific opportunities for improving outcomes. For example, there was no decline in completion rates for traditional-age students enrolling full time. Yet, because fewer students were able to maintain full-time enrollment, the resulting outcome was a lower overall completion rate for traditional-age students. To the extent that college affordability, both in terms of family finances and institutional tuition rates, is a factor in student enrollment intensity, these outcomes are susceptible to policy interventions that directly impact affordability.
This report’s findings reiterate the need for developing measures that capture the complexity of students’ postsecondary pathways. Developing new measures of student success outcomes will result in public and institutional policies that acknowledge and respond to student pathways that may involve mobility across institutional and state lines, part‐time and mixed enrollment, a gender gap that varies by age, and entry into postsecondary institutions at a variety of different ages and life circumstances.
Federal and state governments should maintain funding formulas that provide incentives for institutions to retain and graduate students from these diverse populations. Institutions have the obligation to adjust their institutional practices to meet the needs of their student population, including part‐time and mixed enrollment students, adult learners, and students who delay enrolling in college for a few years after high school to help them successfully complete college.
References
Advisory Committee on Student Financial Assistance (ACSFA). (2012, February). Pathways to success: Integrating learning with life and work to increase national college completion (A report to the U.S. Congress and Secretary of Education). Washington, DC: Author.
Bach, S. K., Banks, M. T., Kinnick, M. K., Ricks, M. F., Stoering, J. M., & Walleri, R. D. (2000, June). Student attendance patterns and performance in an urban postsecondary environment. Research in Higher Education, 41(3), 315-330.
Barr, A. & Turner, S. (2013). Expanding enrollments and contracting state budgets: The effect of the Great Recession on higher education. The ANNALS of the American Academy of Political and Social Science 650(1), 168-193
Belfield, C., Crosta, P., & Jenkins, D. (2013). Can community colleges afford to improve completion? Measuring the costs and efficiency effects of college reforms (CCRC Working Paper No. 55). New York, NY: Community College Research Center, Columbia University.
Berrett, D. (2014, March 19). In curricular clashes, completion can vie with quality. The Chronicle of Higher Education. Retrieved from http://chronicle.com/article/In-Curricular-Clashes/145385/
Blumenstyk, G. (2013, July 24). In speech on economy, Obama vows to ‘shake up’ higher education. The Chronicle of Higher Education. Retrieved from http://chronicle.com/article/In‐Speech‐on‐Economy‐Obama/140525/
Blumenstyk, G. & Thomason, A. (2013, September 20). Duncan calls criticism of college-rating proposal ‘more than a little silly.’ The Chronicle of Higher Education. Retrieved from http://chronicle.com/article/Duncan-Calls-Criticism-of/141813/
Carlson, S. (2009, June 8). Standard & Poor’s report lays out challenge for coming years. The Chronicle of Higher Education. Choy, S. P. (2002). Access and persistence: Findings from 10 years of longitudinal research on students. Washington, DC: American Council on Education.
Committee on Measures of Student Success. (2011, December).
Committee on Measures of Student Success: A report to Secretary of Education Arne Duncan. Washington, DC: Author.
Desmond, M. R. (2008, October 23). The coming college bubble? America’s undercapitalized independent schools could be the next industry to pop. Forbes.com.
Douglass, J. A. (2008, December 9). College vs. employment. Inside Higher Ed.
Field, K. (2013, August 22). Obama plan to tie student aid to college ratings draws mixed reviews. The Chronicle of Higher Education. Retrieved from http://chronicle.com/article/Obama-Plan-to-Tie-Student-Aid/141229/
Hillman, N., Lum, T., & Hossler, D. (2008). Understanding Indiana’s reverse transfer students: A case study in institutional research. Community College Journal on Research & Practice, 39(2), 113-134.
Horn, L. J., & Carroll, C. D. (1997, October). Confronting the odds: Students at risk and the pipeline to higher education (Statistical Analysis Report, NCES 98‐094). Washington, DC: U.S. Department of Education, National Center for Education Statistics.
Jaschik, S. (2008, September 23). Mixed messages on early decision. Inside Higher Ed.
Jaschik, S. (2013, August 22). Obama’s ratings for higher ed. Inside Higher Ed. Retrieved from https://www.insidehighered.com/news/2013/08/22/president-obama-proposes-link-student-aid-new-ratings-colleges
Jones, D. P. (2013). Outcomes-Based Funding: The Wave of Implementation. Washington, DC: Complete College America and National Center for Higher Education Management Systems.
Keierleber, M. (2014, May 1). College-rating system will go forward, Duncan says. The Chronicle of Higher Education. Retrieved from http://chronicle.com/article/College-Rating-System-Will-Go/146295/
Lederman, D., Stratford, M., & Jaschik, S. (2014, February 7). Rating (and berating) the ratings. Inside Higher Ed. Retrieved from https://www.insidehighered.com/news/2014/02/07/colleges-and-analysts-respond-obama-ratings-proposal#ixzz2vDWISN9P
Lewin, T. (2013, August 22). Obama’s plan aims to lower cost of college. The New York Times. Retrieved from http://www.nytimes.com/2013/08/22/education/obamas-plan-aims-to-lower-cost-of-college.html?pagewanted=all&_r=0
Moltz, D. (2008, August 22). The community college enrollment boom. Inside Higher Ed.
Moltz, D. (2009, September 24). Unprecedented demand, dwindling funding. Inside Higher Ed.
Moore, C., & Shulock, N. (2009). Student progress toward degree completion: Lessons from the research literature. Sacramento, CA: Institute for Higher Education Leadership and Policy.
Mullin, C. M., & Phillippe, K. (2009, December). Community college enrollment surge: An analysis of estimated fall 2009 headcount enrollments at community colleges. Washington, DC: American Association of Community Colleges.
National Bureau of Economic Research. (2008). Determination of the December 2007 peak in economic activity. Cambridge, MA: Author.
National Bureau of Economic Research. (2010). Business Cycle Dating Committee press release. Cambridge, MA: Author. Retrieved from http://www.nber.org/cycles/sept2010.pdf
National Conference of State Legislatures [NSLC]. (2014). Performance funding for higher education. Retrieved from http://www.ncsl.org/research/education/performance-funding.aspx
National Student Clearinghouse Research Center [NSCRC]. 2014. High school benchmarks: National college progression rates. Herndon, VA: Author. Retrieved from https://nscresearchcenter.org/hsbenchmarks2014/
Petrick, R. (2012). Increasing higher education attainment in the United States: Challenges and opportunities. In M. Schneider & A. P. Kelly (Eds.), Getting to graduation: The completion Agenda in Higher education (pp. 269‐292). Baltimore, MD: Johns Hopkins University Press.
Reeves, T. J., Miller, L. A., & Rouse, R. A. (2011). Reality check: A vital update to the landmark 2002 NCES study of nontraditional college students. Phoenix, AZ: Apollo Research Institute.
Sander, L. (2014, December 4). Lumina devotes $4-million to local efforts to speed college completion. The Chronicle of Higher Education. Retrieved from http://chronicle.com/article/Lumina-Devotes-4-Million-to/143379/
Shear, M. D. (2014, May 25). Colleges rattled as Obama seeks rating system. The New York Times. http://www.nytimes.com/2014/05/26/us/colleges-rattled-as-obama-presses-rating-system.html?_r=0
Supiano, B. (2009, January 26). Student-aid experts offer advice to colleagues on weathering the recession. The Chronicle of Higher Education.
Tandberg, D. and Hillman, N. (2013). State performance funding for higher education: Silver bullet or red herring? (WISCAPE POLICY BRIEF). Madison, WI: University of Wisconsin-Madison, Wisconsin Center for the Advancement of Postsecondary Education (WISCAPE).
U.S. Department of Education. (2011, December). Committee on Measures of Student Success: A report to Secretary of Education Arne Duncan. Washington, DC: Author. Retrieved from http://www2.ed.gov/about/bdscomm/list/cmss-committee-report-final.pdf
University Professional and Continuing Education Association & InsideTrack. (2012). Measuring nontraditional student success: An imperative for colleges and universities. Washington, DC: Authors.
The White House (2009). Below are excerpts of the President’s remarks in Warren, Michigan today and a fact sheet on the American Graduation Initiative [press release]. Retrieved from http://www.whitehouse.gov/the_press_office/Excerpts-of-the-Presidents-remarks-in-Warren-Michigan-and-fact-sheet-on-the-American-Graduation-Initiative
Appendix A: Methodological Notes
This report describes six-year college student success outcomes, focusing primarily on degree and certificate completion of a cohort of first-time-in-college degree-seeking students who started their postsecondary education at U.S. colleges and universities in fall 2008. The study follows this cohort for six years, through May 31, 2014. The results presented in the report center on student outcomes over the six-year span, including completion (i.e., receipt of any postsecondary credential by the end of the study period), persistence (i.e., having enrollment records at any postsecondary institution during the last year of the study period), and stop-out without completion (i.e., having no enrollment records at any postsecondary institution during the last year of the study period). The report mainly focuses on students’ first completion, with further distinctions drawn between completions awarded at the institution where a student first enrolled (his or her starting institution) and those awarded at an institution other than the starting institution. For students who started at a two-year public institution, this report also presents an overview of their completions at a four-year institution, either as a first completion (i.e., those who completed a four-year degree without having first earned a credential at a two-year institution2) or as a subsequent degree after a first completion awarded in the two-year sector. In addition to results on degree and certificate completion rates by enrollment intensity, age group, gender and starting institution type, the report includes results on completion across state lines, and for students who started at multistate institutions.
2Throughout this report, “two-year institution” is used broadly to designate institutions offering both associate’s degrees and less-than-two-year degrees and certificates.
NATIONAL COVERAGE OF THE DATA
The National Student Clearinghouse® (the Clearinghouse) is a unique and trusted source for higher education enrollment and degree verification. Since its creation in 1993, the participation of institutions nationwide in Clearinghouse data-collection programs has steadily increased. Currently, Clearinghouse data include more than 3,600 colleges and 96 percent of U.S. college enrollments. The Clearinghouse has a 21-year track record of providing automated student enrollment and degree verifications. Due to the Clearinghouse’s unique student-level record approach to data collection the Clearinghouse data provide opportunities for robust analysis not afforded by the more commonly used institution-level national databases.
The enrollment data used in this report provide an unduplicated headcount for the fall 2008 first-time-in-college student cohort. Clearinghouse data track enrollments nationally and are not limited by institutional and state boundaries. Moreover, because this database is comprised of student-level data, researchers can use it to link concurrent as well as consecutive enrollments of individual students at multiple institutions – a capability that distinguishes the Clearinghouse database from national databases built with institution-level data. For instance, in the National Center for Education Statistics (NCES) and the Integrated Postsecondary Education Data System (IPEDS) – one of the most widely used national data sets in postsecondary education research – concurrent enrollments remain unlinked and, therefore, are counted as representing separate individuals.
COHORT IDENTIFICATION, DATA CUT, AND DEFINITIONS
Focusing on the cohort of first-time-in-college degree-seeking students who started their postsecondary studies at U.S. colleges and universities in the fall of 2008, this report examines completion over a span of six years, through May 31, 2014. In order not to exclude or misrepresent the outcomes of students whose postsecondary pathways included enrollment in college preparatory summer study, the report also includes students who started their studies in summer 2008 (i.e., May 1-August 31, 2008). Furthermore, to limit the cohort to first-time undergraduate students only, the study uses data from the Clearinghouse’s StudentTracker and DegreeVerify services to confirm that students included in the study (1) showed no previous college enrollment in the four years prior to June 1, 2008, and (2) had not completed a college degree prior to August 11, 2008. Former dual enrollment students, first-time college students who enrolled in college courses while still in high school, were included in the cohort for this study (for more on former dual enrollment students, see below).
In defining the study cohort, it was necessary to identify a coherent set of first-enrollment records that would, as closely as possible, represent a starting point for the fall 2008 cohort of first-time-in-college students. With this goal in mind, the researchers excluded enrollment records that were either (1) not clearly interpretable within the study’s framework and data limitations or (2) inconsistent with the experiences of first-time college enrollment that were the focus of the analysis. Students who showed concurrent enrollments (defined as enrollments overlapping by at least one day) in the fall 2008 term were, therefore, excluded from the study. Also excluded were students who had any enrollment terms shorter than one day, who first enrolled in postsecondary study outside the U.S. or its territories (e.g., Guam, Puerto Rico, the U.S. Virgin Islands), or who started at non-IPEDS institutions.
Because our outcome of interest was completion, we sought to focus analyses on degree-seeking students only. Consequently, we attempted to exclude non-degree-seeking, casual course takers from the cohort. For students who first enrolled in four-year institutions, non-degree-seeking students were defined as those who had only one enrollment record, with intensity of less than half-time. Students who started at two-year institutions were excluded as non-degree-seeking students if they failed to meet one of the following criteria: (1) had one or more full-time enrollments before August 10, 2009, and (2) had two enrollment terms with half-time status or more before December 31, 20093.
3 As a result, we identified 525,094 students who began at two-year institutions as non-degree-seeking students and excluded them.
In summary, the study cohort included students who fulfilled all of the following conditions:
- Enrolled in a Title IV institution in fall 2008. This was defined as any term with a start date between August 11 and October 31, 2008, inclusive; if the institution had no term begin date during this period, then between July 14 and August 10, 2008, inclusive;
- Did not have a previous enrollment record, as shown in StudentTracker, between June 1, 2004, and May 31, 2008, unless the previous enrollment record was before the student turned 18 years old (dual enrollment);
- Did not receive any degree or certificate from a postsecondary institution prior to the first day of enrollment in fall 2008, according to Clearinghouse data, unless the award date was before the student turned 18 years old (dual enrollment);
- Enrolled at just one institution in fall 2008 (i.e., showed no overlapping multiple enrollments between July 14 and August 10, 2008 or August 11 and October 31, 2008);
- Had at least one legitimate enrollment status throughout the study period; that is, enrolled for at least one term with full-time, part-time (i.e., half-time or less than half-time), or withdrawal status4;
- Showed intent to seek a degree or certificate. That is:
- For students who started at four-year institutions, enrolled at least one term with an intensity of half-time or higher.
- For students who started at two-year institutions, either:
- Enrolled full time for at least one term before August 10, 2009, or
- Enrolled at least half time for any two terms before December 31, 2009.
4The Clearinghouse receives enrollment status data from its participating institutions as full-time, half-time, less-than-half-time, withdrawal, or other statuses.
FORMER DUAL ENROLLMENT STUDENTS
The cohort used in this study includes former dual enrollment students: first-time college students who had previously taken dual enrollment courses. These are the students who enrolled in college courses prior to fall 2008 while still in high school. Enrollment records in the Clearinghouse data do not have an indicator for dual enrollment students. For this reason a proxy was used to identify this population. Students were identified as former dual enrollment students if their enrollment or degree record prior to fall 2008 was before the student turned 18 years old. Former dual enrollment students represent 15.6 percent of the fall 2008 cohort. As proportion of the sample for each sector, former dual enrollment students represent 18 percent of the students who started in four-year public institutions, 15 percent of the students who started in two-year public institutions, and 15 percent of those who started in four-year private nonprofit institutions. Only two percent of the students who started in four-year private for-profit institutions had prior dual enrollments.
ENROLLMENT INTENSITY
For this report, enrollment intensity is classified as exclusively full time throughout the study period, exclusively part time throughout the study period, or mixed enrollment (including both full-time and part-time enrollments), based on students’ enrollments across all terms through the first completion or, for non-completers, through the entire study period. In establishing students’ enrollment intensity in this way, enrollments during summer terms (defined as terms with both the start date and the end date falling between May 1 and August 31 in any given year) and short terms (defined as terms lasting less than 21 days) were excluded from consideration.
For terms in which a student showed concurrent enrollment records (i.e., records that overlapped by 30 days or more), the two highest-intensity enrollments were considered. For example, a student concurrently enrolled half time at two institutions was categorized as enrolled full time for that term. Overall, for each term under consideration (i.e., all terms except summer terms and short terms − less than 21 days − up through the first completion, or, if no completion, throughout the entire study period), the “exclusively full-time enrollment” designation was assigned to students whose enrollment showed one of three situations: (1) the enrollment record showed exclusively full-time enrollment for all terms; or (2) for terms with concurrent enrollments, the two highest-intensity enrollment records included at least one full-time enrollment; or (3) for terms with concurrent enrollments, the two highest-intensity enrollment records both reflected half-time enrollment.
The “part-time enrollment” designation was assigned to students whose enrollment for each term under consideration showed one of the two following situations: (1) the enrollment record showed exclusively half-time or less than half-time enrollment; or (2) for terms with concurrent enrollments, the two highest-intensity enrollment records included some combination of half-time and less than half-time enrollments, but no full-time enrollment, and no more than one half-time enrollment.
The category of mixed enrollment was applied to students who showed a combination of full-time and part-time enrollments across the terms under consideration. Finally, students who showed records indicating withdrawal, but no full-time or part-time enrollments, were randomly assigned to an enrollment intensity category.
AGE GROUP
The study focused on three age groups: 20 years old or younger, between 21 and 24 years old, and older than 24 years old. The first group “20 years old or younger” is defined to approximate enrollment immediately after high school, while the second group (“between 21 and 24 years old”) is meant to represent students who delay entry into postsecondary education for a few years after finishing high school. The final category included adult learners, defined as those who were older than 24 when they began college. For all categories, we define age as of the end of the 2008 calendar year (December 31, 2008). Students with birthdates of December 31, 1988, or later were placed in the first category. Those with birthdates between December 31, 1984, and December 30, 1988, inclusive, were categorized in the second group (“between 20 and 24 years old”). Students with birthdates before December 31, 1984, were placed in the final category (“over 24 years old”).
CONCURRENT COMPLETION
For this report, we examined completion by first-time students at either two-year or four-year institutions. We defined completion as having obtained a degree or certificate at any institution within the six-year study period (i.e., by May 31, 2014). Clearinghouse data provide a unique headcount of U.S. college enrollments during each term, which allows for the tracking of individuals including those with concurrent completion. In preparing data for this report, a small number of individuals showed more than one completion awarded at multiple institutions on the same day. In these instances, a primary completion record was selected using decision rules specific to the sector of the student’s starting institution.
The first set of decision rules was applied to students with concurrent completions who started at a two-year institution:
- Concurrent Completions at Two Different Two-Year Institutions
- Same over different: Completions at the starting institution were selected over completions at other institutions.
- Random selection: If the first decision rule did not result in a single completion record being selected, then a completion record was selected at random.
- Concurrent Completions at One Two-Year Institution and One Four-Year Institution
- Two-year then four-year: The two-year degree completion was considered the first completion and the four-year degree completion was considered a subsequent completion.
- Concurrent Completions at Two or More Four-Year Institutions
- Random selection: If a student started at a two-year institution but later completed at two or more four-year institutions concurrently, then a completion record was selected at random.
The second set of decision rules was applied to students who started at four-year institutions and later showed concurrent completion records:
- Same over different: Completions at the starting institution were selected over completions at other institutions.
- Four-year over two-year: If the first decision rule did not result in the selection of a single completion record, then completions at four-year institutions were selected over those at two-year institutions.
- Random selection: If neither of the first two decision rules resulted in the selection of a single completion record, then a completion record was selected at random.
IMPUTATION OF VALUES FOR GENDER
The Clearinghouse’s coverage of student gender has increased dramatically for enrollments occurring in recent years. However, gender imputation for the majority of enrollment records is still necessary in order to use the data for research studies using older cohorts. To meet this need, the Research Center developed an imputation process based on first names. Previously submitted name‐gender pairs throughout the Clearinghouse database are used to determine the probability of any first name being associated with either gender. To increase the accuracy of the imputation process, the Research Center also draws on name‐gender data from the Social Security Administration (SSA) and the U.S. Census Bureau.
Because the Clearinghouse collects transactional data, its data contain many more unique first names than the other sources. International students may also contribute to the large variety of first names submitted to the Clearinghouse. The imputation used only those pairs in which the name occurred in at least two instances and was associated with a single gender in at least 95 percent of the instances. The SSA and Census data sets were used to ensure that name‐gender pairs were consistent across every data set in which they occurred and to enhance the imputation process by contributing name‐gender pairs that did not occur in the Clearinghouse data.
Institutions reported student gender to the Clearinghouse for approximately 44 percent of all students included in this report. The imputation process yielded gender codes for an additional 49 percent of the cohort, producing a total gender coverage rate of 93 percent.
IMPUTATION OF MISSING DATA ON GRADUATION RECORDS
The National Student Clearinghouse collects graduation information from its participating institutions via two data reporting services: Enrollment Reporting and DegreeVerify. Enrollment Reporting has higher data coverage rates, but includes only basic completion information such as graduation indicator and the date of graduation. For the fall 2008 cohort, Enrollment Reporting covered 92 percent of all the students in Title IV degree-granting institutions listed in IPEDS (including 96 percent of the students in public institutions, 90 percent in private nonprofit institutions, and 55 percent in private for-profit institutions). DegreeVerify includes enhanced information on completions, including degree title, major, level, and CIP code, but covered only 84 percent of enrollments in 2008. Institutions may participate either in Enrollment Reporting alone or in both services. Completions data for this report included information drawn from either service. An analysis conducted by the Clearinghouse on the 2008 cohort found that graduation data for the institutions that participated in DegreeVerify were relatively more complete for some of the years covered in this study than those for institutions that participated only in Enrollment Reporting, biasing completion rates slightly downwards for institutional sectors with lower participation rates in DegreeVerify.
In order to correct for this bias, the Research Center conducted a randomized imputation procedure for missing graduation data among students at non-DegreeVerify institutions who were no longer enrolled, but for whom outcome data were missing (that is, for whom the institution had reported neither a graduation nor a withdrawal status in their Enrollment Reporting). This involved comparing the Enrollment Reporting and DegreeVerify records for institutions that participated in both services and estimating, for each institution type, the average percentage of students with missing outcomes in the enrollment data who had a reported graduation in the DegreeVerify data. We further specified these underreporting rates by taking into account student age and the academic year. We then used random assignment of graduation outcomes to students with missing data at the institutions that did not participate in DegreeVerify in order to match each institution’s underreporting rate for each student age group and for every year of the study to the average rate for similar students at institutions of the same type that did participate in DegreeVerify.
This imputation was performed only for students with missing outcomes data at institutions that did not participate in DegreeVerify. It is based on the typical underreporting of graduation outcomes from similar institutions that participate in both Enrollment Reporting and DegreeVerify. The table below shows, for each institution type, the percentage of the starting cohort for whom graduation data were imputed:
| Institution Type | Percentage of the Starting Cohort With an Imputed Completion |
| Two-Year Private For-Profit | 0.51% |
| Two-Year Private Nonprofit | 1.11% |
| Two-Year Public | 0.56% |
| Four-Year Private For-Profit | 0.28% |
| Four-Year Private Nonprofit | 0.75% |
| Four-Year Public | 0.27% |
| Total | 0.46% |
IMPUTATION OF MISSING DATA THROUGH WEIGHTING BY STATE AND INSTITUTION TYPE
The institutions participating in the Clearinghouse Enrollment Reporting service (i.e., providing the data coverage) is not 100 percent of all institutions for any individual year. Therefore, in order to account for possibilities of not capturing a student’s enrollment outcome due to non-coverage of Clearinghouse data, the analysis weights were calculated using 2013 coverage rate of the sector, control, and state of the institution where a student was enrolled for the last enrollment record. Last enrollment record was defined based on the first completion (for completers) or the last enrollment record either before stop-out (for students who had no enrollment records during the last year of the study) or before the end of the study period (for persisters). For students who completed a degree at the starting institution or were still enrolled at the starting institution by the end of the study period, a weight=1 was applied. For all other students, two weights were created and applied in this study:
For students who completed a degree or were still enrolled at a different institution by the end of the study period, a “transfer” weight was applied. The transfer weight used was an over-weight based on the coverage of the sector, control, and state of the institution in which the student was enrolled for the last enrollment record, as calculated by the formula provided below:

For students who stopped out by the end of the study period, a “missing” weight was applied. The missing weight used was an under-weight based on the coverage of the sector, control, and state of the institution in which the student was enrolled for the last enrollment record, as calculated by the formula provided below:

DATA LIMITATIONS
The data limitations in this report center mainly on the data coverage, the methods used for cohort identification, and the definition of key constructs, as outlined above.
The representation of private for-profit institutions in the StudentTracker data is lower than that of other institution types, with 66 percent coverage for four-year private for-profit institutions in fall 2008 compared to 90 percent and 96 percent, respectively, for four-year private nonprofit institutions and four-year public institutions. Despite the challenges presented by low participation in the early years covered in this report, current Clearinghouse data nevertheless offer near-census national coverage, representing more than 96 percent of U.S. postsecondary enrollments. In an effort to correct for coverage gaps, in this study, data were weighted, as explained above.
Data limitations resulting from the cohort identification methods used in preparing this report also should be noted. Because the Clearinghouse data on designations for class year are incomplete, the researchers identified first-time undergraduate students via two indirect measures:
- No previous college enrollments recorded in StudentTracker going back four years, and
- No previous degree awarded in the Clearinghouse’s historical DegreeVerify database.
Given these selection criteria, the sample for this report may include students who had more than 30 Advanced Placement (AP), International Baccalaureate (IB), or dual enrollment credits (students who are included in this study’s sample as first-time students, but in fall 2008 were enrolled in college courses while still in high school) and who would not be considered first-time students, despite having first-time status. Moreover, because of inconsistencies in the historical depth of DegreeVerify database records, it is possible that a small number of graduate students are also included in the study cohort.
Finally, although Clearinghouse data contain some demographic information on students, historical coverage rates for the demographic data elements are uneven. Consequently, the results summarized in this report do not break enrollments out by race/ethnicity and results on gender are based partially on imputed values, as described above.
Appendix B: Coverage Tables
Table B1. National Student Clearinghouse Coverage of Enrollments by Institution Type Across State
(Title IV, Degree–Granting Non–Multistate Institutions, 2013 Fall)
| State | Four–Year Public | Two–Year Public | Four–Year Private Nonprofit | Two–Year Private Nonprofit | Four–Year Private For–Profit | Two–Year Private For–Profit |
| Alabama | 100.00% | 97.40% | 90.40% | 0.00% | 25.40% | 79.60% |
| Alaska | 100.00% | 100.00% | 91.90% | – | 0.00% | 0.00% |
| Arizona | 100.00% | 99.90% | 60.90% | – | 98.10% | 51.60% |
| Arkansas | 100.00% | 98.20% | 84.40% | 0.00% | – | 0.00% |
| California | 100.00% | 100.00% | 93.70% | 0.00% | 82.80% | 46.00% |
| Colorado | 94.80% | 100.00% | 96.70% | 0.00% | 79.30% | 22.00% |
| Connecticut | 98.60% | 100.00% | 97.80% | – | 0.00% | 0.00% |
| Delaware | 100.00% | 100.00% | 91.20% | 100.00% | – | – |
| District of Columbia | 100.00% | – | 98.60% | – | 99.30% | – |
| Florida | 99.70% | 100.00% | 86.70% | 0.00% | 47.10% | 18.20% |
| Georgia | 100.00% | 100.00% | 95.40% | 57.90% | 3.40% | 43.70% |
| Hawaii | 100.00% | 100.00% | 94.70% | – | 0.00% | 100.00% |
| Idaho | 100.00% | 100.00% | 99.30% | – | 0.00% | 100.00% |
| Illinois | 100.00% | 100.00% | 97.10% | 0.00% | 82.30% | 19.60% |
| Indiana | 100.00% | 100.00% | 98.10% | 100.00% | 92.10% | 39.80% |
| Iowa | 100.00% | 100.00% | 98.70% | 0.00% | 98.90% | 0.00% |
| Kansas | 99.20% | 90.70% | 79.80% | 0.00% | 0.00% | 0.00% |
| Kentucky | 100.00% | 100.00% | 87.90% | – | 78.30% | 41.40% |
| Louisiana | 98.00% | 91.80% | 99.10% | 0.00% | – | 11.80% |
| Maine | 100.00% | 100.00% | 99.50% | 0.00% | – | 0.00% |
| Maryland | 97.30% | 100.00% | 92.70% | – | – | 0.00% |
| Massachusetts | 99.10% | 100.00% | 97.30% | 28.60% | 43.20% | 0.00% |
| Michigan | 100.00% | 99.70% | 95.30% | 0.00% | 0.00% | 0.00% |
| Minnesota | 100.00% | 99.70% | 96.40% | 0.00% | 96.40% | 42.90% |
| Mississippi | 100.00% | 100.00% | 99.00% | – | – | 0.00% |
| Missouri | 100.00% | 100.00% | 93.90% | 100.00% | 16.70% | 20.20% |
| Montana | 100.00% | 80.00% | 79.90% | 0.00% | – | – |
| Nebraska | 100.00% | 99.70% | 98.60% | 0.00% | 0.00% | 0.00% |
| Nevada | 100.00% | 100.00% | 45.10% | – | 0.00% | 26.30% |
| New Hampshire | 100.00% | 100.00% | 98.10% | 0.00% | 100.00% | – |
| New Jersey | 100.00% | 100.00% | 89.50% | – | 90.00% | 0.00% |
| New Mexico | 93.50% | 97.00% | 89.10% | – | 18.80% | 0.00% |
| New York | 98.60% | 100.00% | 95.20% | 9.80% | 93.80% | 16.80% |
| North Carolina | 100.00% | 99.80% | 95.10% | 100.00% | 22.20% | 0.00% |
| North Dakota | 99.50% | 96.40% | 80.20% | – | – | – |
| Ohio | 100.00% | 100.00% | 97.40% | 39.30% | 3.10% | 5.30% |
| Oklahoma | 99.60% | 100.00% | 93.20% | – | 38.00% | 0.00% |
| Oregon | 100.00% | 100.00% | 91.50% | – | 0.00% | 84.30% |
| Pennsylvania | 100.00% | 100.00% | 98.60% | 73.90% | 9.30% | 18.00% |
| Rhode Island | 100.00% | 100.00% | 100.00% | – | – | – |
| South Carolina | 100.00% | 98.00% | 94.60% | 85.40% | 56.70% | 0.00% |
| South Dakota | 95.80% | 97.20% | 87.40% | 100.00% | 0.00% | – |
| Tennessee | 100.00% | 100.00% | 93.30% | 0.00% | 57.10% | 9.10% |
| Texas | 99.60% | 98.00% | 96.90% | 0.00% | 3.30% | 15.70% |
| Utah | 100.00% | 100.00% | 100.00% | 100.00% | 79.50% | 21.70% |
| Vermont | 100.00% | 100.00% | 98.20% | – | 100.00% | – |
| Virginia | 100.00% | 100.00% | 97.30% | 0.00% | 56.80% | 30.80% |
| Washington | 100.00% | 100.00% | 93.80% | 0.00% | 28.60% | 53.10% |
| West Virginia | 98.80% | 82.40% | 89.80% | – | 98.60% | 6.50% |
| Wisconsin | 100.00% | 100.00% | 95.70% | – | 85.70% | 47.40% |
| Wyoming | 100.00% | 100.00% | – | – | – | 100.00% |
Table B2. National Student Clearinghouse Coverage of Enrollment by Institution Type
(Title IV Degree–Granting Multistate Institutions)
| Institution Type | Coverage Rate |
| Four–Year Public | – |
| Two–Year Public | – |
| Four–Year Private Nonprofit | 95.71% |
| Two–Year Private Nonprofit | – |
| Four–Year Private For–Profit | 84.90% |
| Two–Year Private For–Profit | 46.30% |
Appendix C: Results Tables
Table 1. Fall 2008 Cohort by Age at First Entry
| Age at First Entry | Unweighted Count | Percentage |
| Overall | 2,673,916 | 100.00 |
| 20 and Younger | 2,050,509 | 76.69 |
| >20 – 24 | 170,755 | 6.39 |
| Older than 24 | 443,716 | 16.59 |
| Age Missing | 8,936 | 0.33 |
Data in this table are displayed in the report in Figure 2.
Table 2. Fall 2008 Cohort by Enrollment Intensity
| Enrollment Intensity | Unweighted Count | Percentage |
| Overall | 2,673,916 | 100.00 |
| Exclusively Full-Time | 1,058,717 | 39.59 |
| Exclusively Part-Time | 179,416 | 6.71 |
| Mixed Enrollment | 1,434,476 | 53.65 |
Data in this table are displayed in the report in Figure 3.
Table 3. Fall 2008 Cohort by Age at First Entry and Enrollment Intensity
| Age at First Entry | Enrollment Intensity | Unweighted Count | Percentage of Age Group |
| 20 and Younger | Overall | 2,050,509 | 100.00 |
| Exclusively Full-Time | 879,691 | 42.90 | |
| Exclusively Part-Time | 58,935 | 2.87 | |
| Mixed Enrollment | 1,111,543 | 54.21 | |
| >20 – 24 | Overall | 170,755 | 100.00 |
| Exclusively Full-Time | 55,003 | 32.21 | |
| Exclusively Part-Time | 18,643 | 10.92 | |
| Mixed Enrollment | 96,953 | 56.78 | |
| Older than 24 | Overall | 443,716 | 100.00 |
| Exclusively Full-Time | 120,296 | 27.11 | |
| Exclusively Part-Time | 100,093 | 22.56 | |
| Mixed Enrollment | 222,532 | 50.15 | |
| Age Missing | Overall | 8,936 | 100.00 |
| Exclusively Full-Time | 3,272 | 41.70 | |
| Exclusively Part-Time | 1,745 | 19.53 | |
| Mixed Enrollment | 3,448 | 38.59 |
Table 4. Fall 2008 Cohort by Gender
| Gender | Unweighted Count | Percentage | |
| Overall | 2,486,088* | 100.00 | |
| Men | 1,114,862 | 44.84 | |
| Women | 1,371,226 | 55.16 | |
Data in this table are displayed in the report in Figure 4. *The overall excludes students with gender data missing (7.02 percent of the cohort).
Table 5. Fall 2008 Cohort by Gender and Age at First Entry
| Gender | Age at First Entry | Unweighted Count | Percentage of Gender |
| Men | Overall | 1,114,862 | 100.00 |
| 20 and Younger | 869,644 | 78.00 | |
| >20 – 24 | 77,018 | 6.91 | |
| Older than 24 | 164,671 | 14.77 | |
| Age Missing | 3,529 | 0.32 | |
| Women | Overall | 1,371,226 | 100.00 |
| 20 and Younger | 1,047,882 | 76.42 | |
| >20 – 24 | 75,345 | 5.49 | |
| Older than 24 | 244,060 | 17.80 | |
| Age Missing | 3,939 | 0.29 |
Table 6. Fall 2008 Cohort by Starting Institution Type
| Institution Type | Unweighted Count | Percentage |
| Four-Year Public | 1,112,105 | 41.59 |
| Four-Year Private Nonprofit | 464,796 | 17.38 |
| Four-Year Private For-Profit | 107,368 | 4.02 |
| Two-Year Public | 983,521 | 36.78 |
| Two-Year Private Nonprofit | 2,704 | 0.10 |
| Two-Year Private For-Profit | 3,306 | 0.12 |
Data in this table are displayed in the report in Figure 1.
Table 7. Six-Year Outcomes by Enrollment Intensity (N= 2,668,614)
| Total Completion Rate | Completion at Same Institution | Completion at Different Institution | Still Enrolled (At Any Institution) | Not Enrolled (At Any Institution) | ||
| Two-Year | Four-Year | |||||
| Overall | 55.03 | 42.06 | 3.19 | 9.78 | 14.71 | 30.26 |
| Exclusively Full-Time | 77.19 | 66.35 | 1.99 | 8.85 | 3.23 | 19.57 |
| Exclusively Part-Time | 21.04 | 17.44 | 2.29 | 1.30 | 10.42 | 68.54 |
| Mixed Enrollment | 42.96 | 27.26 | 4.18 | 11.53 | 23.71 | 33.33 |
Data in this table are displayed in the report in Figures 5 and 6.
Table 8. Six-Year Outcomes by Gender (N= 2,481,234)
| Total Completion Rate | Completion at Same Institution | Completion at Different Institution | Still Enrolled (At Any Institution) | Not Enrolled (At Any Institution) | ||
| Two-Year | Four-Year | |||||
| Overall | 55.03 | 42.06 | 3.19 | 9.78 | 14.71 | 30.26 |
| Men | 51.62 | 39.78 | 2.90 | 8.94 | 15.67 | 32.71 |
| Women | 58.57 | 44.18 | 3.56 | 10.83 | 14.34 | 27.10 |
Data in this table are displayed in the report in Figure 7.
Table 9. Six-Year Outcomes by Age at First Entry (N= 2,668,614)
| Total Completion Rate | Completion at Same Institution | Completion at Different Institution | Still Enrolled (At Any Institution) | Not Enrolled (At Any Institution) | ||
| Two-Year | Four-Year | |||||
| Overall | 55.03 | 42.06 | 3.19 | 9.78 | 14.71 | 30.26 |
| 20 and Younger | 59.31 | 44.58 | 3.38 | 11.35 | 15.34 | 25.35 |
| >20 – 24 | 38.29 | 30.05 | 3.07 | 5.17 | 15.58 | 46.13 |
| Older than 24 | 42.10 | 35.32 | 2.38 | 4.40 | 11.73 | 46.17 |
| Age Missing | 24.54 | 22.65 | 1.36 | 0.53 | 1.67 | 73.80 |
Data in this table are displayed in the report in Figures 8 and 9.
Table 10. Six-Year Outcomes by Gender and Age at First Entry (N= 2,481,234)
| Gender | Age Group | Total Completion Rate | Completion at Same Institution | Completion at Different Institution | Still Enrolled (At Any Institution) | Not Enrolled (At Any Institution) | |
| Two-Year | Four-Year | ||||||
| Men | 20 and Younger | 54.90 | 41.85 | 2.92 | 10.13 | 16.64 | 28.46 |
| >20 – 24 | 36.44 | 28.27 | 3.03 | 5.14 | 15.31 | 48.26 | |
| Older than 24 | 41.82 | 34.49 | 2.77 | 4.56 | 10.98 | 47.20 | |
| Age Missing | 23.87 | 22.44 | 1.06 | 0.36 | 2.11 | 74.02 | |
| Women | 20 and Younger | 63.92 | 47.32 | 3.87 | 12.72 | 14.53 | 21.55 |
| >20 – 24 | 38.24 | 29.40 | 3.44 | 5.40 | 17.30 | 44.46 | |
| Older than 24 | 42.12 | 35.44 | 2.24 | 4.45 | 12.79 | 45.09 | |
| Age Missing | 25.62 | 23.03 | 1.77 | 0.82 | 1.63 | 72.75 | |
Data in this table are displayed in the report in Figure 10.
Table 11. Six-Year Outcomes by Age at First Entry and Enrollment Intensity (N= 2,667,328)
| Age at First Entry | Enrollment Intensity | Total Completion Rate | Completion at Same Institution | Completion at Different Institution | Still Enrolled (At Any Institution) | Not Enrolled (At Any Institution) | |
| Two-Year | Four-Year | ||||||
| 20 and Younger | Exclusively Full-Time | 81.02 | 69.05 | 2.10 | 9.87 | 3.16 | 15.82 |
| Exclusively Part-Time | 10.87 | 8.45 | 1.69 | 0.73 | 11.87 | 77.26 | |
| Mixed Enrollment | 44.72 | 27.15 | 4.47 | 13.09 | 25.15 | 30.14 | |
| >20 – 24 | Exclusively Full-Time | 56.31 | 49.08 | 1.83 | 5.40 | 4.34 | 39.35 |
| Exclusively Part-Time | 14.69 | 10.03 | 3.54 | 1.11 | 11.39 | 73.92 | |
| Mixed Enrollment | 32.67 | 23.17 | 3.67 | 5.83 | 22.73 | 44.60 | |
| Older than 24 | Exclusively Full-Time | 59.63 | 55.24 | 1.26 | 3.12 | 3.39 | 36.98 |
| Exclusively Part-Time | 28.40 | 24.26 | 2.45 | 1.69 | 9.53 | 62.07 | |
| Mixed Enrollment | 39.00 | 29.75 | 2.95 | 6.30 | 17.20 | 43.80 | |
| Age Missing | Exclusively Full-Time | 35.16 | 33.19 | 1.54 | 0.43 | – | 64.65 |
| Exclusively Part-Time | 11.28 | 10.02 | 0.63 | 0.63 | 1.96 | 86.76 | |
| Mixed Enrollment | 19.81 | 17.78 | 1.48 | 0.55 | 3.03 | 77.13 | |
Data in this table are displayed in the report in Figure 11.
Table 12. Six-Year Outcomes of Men by Age at First Entry and Enrollment Intensity (N= 1,111,824)
| Age at First Entry | Enrollment Intensity | Total Completion Rate | Completion at Same Institution | Completion at Different Institution | Still Enrolled (At Any Institution) | Not Enrolled (At Any Institution) | |
| Two-Year | Four-Year | ||||||
| 20 and Younger | Exclusively Full-Time | 77.18 | 66.18 | 1.99 | 9.02 | 3.88 | 18.94 |
| Exclusively Part-Time | 9.39 | 7.55 | 1.36 | 0.48 | 11.28 | 79.34 | |
| Mixed Enrollment | 40.92 | 25.73 | 3.70 | 11.49 | 26.40 | 32.68 | |
| >20 – 24 | Exclusively Full-Time | 53.38 | 46.15 | 1.88 | 5.35 | 4.36 | 42.25 |
| Exclusively Part-Time | 13.68 | 8.74 | 4.16 | 0.77 | 10.50 | 75.83 | |
| Mixed Enrollment | 30.98 | 21.60 | 3.48 | 5.90 | 22.76 | 46.26 | |
| Older than 24 | Exclusively Full-Time | 58.37 | 53.70 | 1.45 | 3.23 | 3.29 | 38.34 |
| Exclusively Part-Time | 28.25 | 22.65 | 3.89 | 1.72 | 8.86 | 62.88 | |
| Mixed Enrollment | 37.93 | 28.14 | 3.06 | 6.73 | 16.76 | 45.31 | |
| Age Missing | Exclusively Full-Time | 34.60 | 33.36 | 1.10 | – | – | 65.21 |
| Exclusively Part-Time | 10.79 | 8.70 | – | – | 3.26 | 85.94 | |
| Mixed Enrollment | 17.75 | 16.51 | 0.99 | – | 3.72 | 78.53 | |
Table 13. Six-Year Outcomes of Women by Age at First Entry and Enrollment Intensity (N= 1,368,238)
| Age at First Entry | Enrollment Intensity | Total Completion Rate | Completion at Same Institution | Completion at Different Institution | Still Enrolled (At Any Institution) | Not Enrolled (At Any Institution) | |
| Two-Year | Four-Year | ||||||
| 20 and Younger | Exclusively Full-Time | 84.95 | 71.95 | 2.24 | 10.77 | 2.62 | 12.43 |
| Exclusively Part-Time | 13.15 | 9.93 | 2.18 | 1.03 | 13.38 | 73.47 | |
| Mixed Enrollment | 48.83 | 28.62 | 5.31 | 14.91 | 24.49 | 26.67 | |
| >20 – 24 | Exclusively Full-Time | 57.52 | 49.64 | 2.15 | 5.74 | 4.50 | 37.98 |
| Exclusively Part-Time | 16.11 | 11.25 | 3.33 | 1.54 | 13.32 | 70.57 | |
| Mixed Enrollment | 33.00 | 22.97 | 4.07 | 5.95 | 24.23 | 42.77 | |
| Older than 24 | Exclusively Full-Time | 60.32 | 56.01 | 1.20 | 3.11 | 3.44 | 36.24 |
| Exclusively Part-Time | 29.17 | 25.79 | 1.61 | 1.77 | 10.50 | 60.33 | |
| Mixed Enrollment | 39.36 | 30.12 | 2.99 | 6.25 | 18.18 | 42.47 | |
| Age Missing | Exclusively Full-Time | 35.65 | 32.66 | 2.17 | 0.82 | – | 64.16 |
| Exclusively Part-Time | 13.12 | 12.06 | – | – | 1.30 | 85.58 | |
| Mixed Enrollment | 22.52 | 19.53 | 2.04 | 0.95 | 3.14 | 74.34 | |
Table 14. Six-Year Outcomes by Starting Institution Type (N= 2,668,614)
| Total Completion Rate | Completion at Same Institution | Completion at Different Institution | Still Enrolled (At Any Institution) | Not Enrolled (At Any Institution) | ||
| Two-Year | Four-Year | |||||
| Overall | 55.03 | 42.06 | 3.19 | 9.78 | 14.71 | 30.26 |
| Four-Year Public | 62.85 | 49.80 | 3.51 | 9.55 | 14.44 | 22.71 |
| Four-Year Private Nonprofit | 73.57 | 59.82 | 2.59 | 11.16 | 9.26 | 17.17 |
| Four-Year Private For-Profit | 38.41 | 30.12 | 2.01 | 6.29 | 11.71 | 49.88 |
| Two-Year Public | 39.13 | 26.14 | 3.22 | 9.77 | 17.93 | 42.94 |
| Two-Year Private Nonprofit | 50.99 | 35.04 | 4.29 | 11.66 | 13.16 | 35.83 |
| Two-Year Private For-Profit | 57.12 | 51.44 | 4.00 | 1.67 | 6.04 | 36.84 |
Data in this table are displayed in the report in Figures 12 and 13.
Table 15. Six-Year Outcomes for Students Who Started at Four-Year Public Institutions by Enrollment Intensity (N= 1,113,125)
| Total Completion Rate | Completion at Same Institution | Completion at Different Institution | Still Enrolled (At Any Institution) | Not Enrolled (At Any Institution) | ||
| Four-Year | Two-Year | |||||
| Overall | 62.85 | 49.80 | 9.55 | 3.51 | 14.44 | 22.71 |
| Exclusively Full-Time | 82.51 | 72.16 | 8.22 | 2.14 | 3.56 | 13.93 |
| Exclusively Part-Time | 21.40 | 16.69 | 1.52 | 3.19 | 10.54 | 68.07 |
| Mixed Enrollment | 50.27 | 33.90 | 11.62 | 4.75 | 24.43 | 25.31 |
Data in this table are displayed in the report in Figure 14.
Table 16. Six-Year Outcomes for Students Who Started at Four-Year Public Institutions by Gender (N= 1,033,858)
| Total Completion Rate | Completion at Same Institution | Completion at Different Institution | Still Enrolled (At Any Institution) | Not Enrolled (At Any Institution) | ||
| Four-Year | Two-Year | |||||
| Overall | 62.85 | 49.80 | 9.55 | 3.51 | 14.44 | 22.71 |
| Men | 58.73 | 47.17 | 8.36 | 3.20 | 16.06 | 25.21 |
| Women | 66.87 | 51.94 | 10.98 | 3.95 | 13.48 | 19.65 |
Data in this table are displayed in the report in Figure 15.
Table 17. Six-Year Outcomes for Students Who Started at Four-Year Public Institutions by Age at First Entry (N= 1,113,125)
| Total Completion Rate | Completion at Same Institution | Completion at Different Institution | Still Enrolled (At Any Institution) | Not Enrolled (At Any Institution) | ||
| Four-Year | Two-Year | |||||
| Overall | 62.85 | 49.80 | 9.55 | 3.51 | 14.44 | 22.71 |
| 20 and Younger | 65.68 | 51.59 | 10.48 | 3.61 | 14.75 | 19.56 |
| >20 – 24 | 50.70 | 42.08 | 5.16 | 3.47 | 14.48 | 34.82 |
| Older than 24 | 45.85 | 39.20 | 3.90 | 2.76 | 12.14 | 42.01 |
| Age Missing | 16.28 | 14.24 | 0.72 | 1.32 | 2.11 | 81.61 |
Data in this table are displayed in the report in Figure 16.
Table 18. Six-Year Outcomes for Students Who Started at Four-Year Public Institutions by Gender and Age at First Entry (N= 1,033,858)
| Gender | Age at First Entry | Total Completion Rate | Completion at Same Institution | Completion at Different Institution | Still Enrolled (At Any Institution) | Not Enrolled (At Any Institution) | |
| Four-Year | Two-Year | ||||||
| Men | 20 and Younger | 61.12 | 48.88 | 9.10 | 3.13 | 16.58 | 22.30 |
| >20 – 24 | 46.95 | 38.18 | 5.11 | 3.66 | 15.36 | 37.69 | |
| Older than 24 | 45.29 | 37.93 | 3.80 | 3.57 | 12.16 | 42.55 | |
| Age Missing | 14.47 | 13.08 | – | 0.88 | 2.92 | 82.60 | |
| Women | 20 and Younger | 70.21 | 54.10 | 11.98 | 4.13 | 13.47 | 16.32 |
| >20 – 24 | 50.95 | 41.23 | 5.79 | 3.92 | 15.56 | 33.49 | |
| Older than 24 | 44.37 | 37.72 | 4.27 | 2.38 | 13.11 | 42.52 | |
| Age Missing | 17.70 | 14.63 | 1.13 | 1.95 | 1.88 | 80.41 | |
Data in this table are displayed in the report in Figure 17.
Table 19. Six-Year Outcomes for Students Who Started at Four-Year Public Institutions by Age at First Entry and Enrollment Intensity (N= 1,112,951)
| Age at First Entry | Enrollment Intensity | Total Completion Rate | Completion at Same Institution | Completion at Different Institution | Still Enrolled (At Any Institution) | Not Enrolled (At Any Institution) | |
| Four-Year | Two-Year | ||||||
| 20 and Younger | Exclusively Full-Time | 84.14 | 73.23 | 8.69 | 2.22 | 3.42 | 12.44 |
| Exclusively Part-Time | 8.58 | 5.52 | 1.05 | 2.01 | 11.80 | 79.62 | |
| Mixed Enrollment | 50.83 | 33.39 | 12.48 | 4.95 | 25.30 | 23.87 | |
| >20 – 24 | Exclusively Full-Time | 68.20 | 61.61 | 4.94 | 1.66 | 4.94 | 26.86 |
| Exclusively Part-Time | 17.53 | 9.43 | 1.94 | 6.15 | 12.59 | 69.88 | |
| Mixed Enrollment | 44.97 | 34.69 | 6.05 | 4.23 | 22.11 | 32.92 | |
| Older than 24 | Exclusively Full-Time | 67.79 | 64.02 | 2.67 | 1.10 | 5.32 | 26.89 |
| Exclusively Part-Time | 28.42 | 23.38 | 1.69 | 3.36 | 9.83 | 61.74 | |
| Mixed Enrollment | 48.44 | 39.09 | 6.24 | 3.11 | 17.43 | 34.14 | |
| Age Missing | Exclusively Full-Time | 23.00 | 20.17 | – | 2.22 | – | 76.93 |
| Exclusively Part-Time | 9.23 | 7.91 | – | – | 2.37 | 88.39 | |
| Mixed Enrollment | 14.57 | 12.90 | – | 0.99 | 4.17 | 81.26 | |
Data in this table are displayed in the report in Figure 18.
Table 20. Six-Year Outcomes of Men Who Started at Four-Year Public Institutions by Age at First Entry and Enrollment Intensity (N= 471,912)
| Age at First Entry | Enrollment Intensity | Total Completion Rate | Completion at Same Institution | Completion at Different Institution | Still Enrolled (At Any Institution) | Not Enrolled (At Any Institution) | |
| Four-Year | Two-Year | ||||||
| 20 and Younger | Exclusively Full-Time | 80.50 | 70.59 | 7.80 | 2.11 | 4.23 | 15.27 |
| Exclusively Part-Time | 7.42 | 5.06 | 0.77 | 1.59 | 11.88 | 80.69 | |
| Mixed Enrollment | 47.00 | 32.44 | 10.51 | 4.05 | 27.08 | 25.92 | |
| >20 – 24 | Exclusively Full-Time | 64.40 | 57.64 | 4.99 | 1.77 | 5.35 | 30.25 |
| Exclusively Part-Time | 16.95 | 8.30 | 1.52 | 7.12 | 11.90 | 71.15 | |
| Mixed Enrollment | 41.83 | 31.60 | 6.06 | 4.17 | 23.24 | 34.93 | |
| Older than 24 | Exclusively Full-Time | 65.56 | 61.89 | 2.59 | 1.09 | 5.13 | 29.31 |
| Exclusively Part-Time | 28.93 | 21.89 | 1.62 | 5.43 | 9.70 | 61.37 | |
| Mixed Enrollment | 46.68 | 36.95 | 6.24 | 3.49 | 18.19 | 35.12 | |
| Age Missing | Exclusively Full-Time | 19.14 | 17.43 | – | – | – | 80.67 |
| Exclusively Part-Time | 9.93 | 8.16 | – | – | 4.50 | 85.56 | |
| Mixed Enrollment | 12.63 | 12.01 | – | – | 4.78 | 82.59 | |
Table 21. Six-Year Outcomes of Women Who Started at Four-Year Public Institutions by Age at First Entry and Enrollment Intensity (N=561,784)
| Age at First Entry | Enrollment Intensity | Total Completion Rate | Completion at Same Institution | Completion at Different Institution | Still Enrolled (At Any Institution) | Not Enrolled (At Any Institution) | |
| Four-Year | Two-Year | ||||||
| 20 and Younger | Exclusively Full-Time | 87.69 | 75.74 | 9.60 | 2.35 | 2.79 | 9.52 |
| Exclusively Part-Time | 10.51 | 6.37 | 1.46 | 2.68 | 12.96 | 76.53 | |
| Mixed Enrollment | 54.85 | 34.20 | 14.71 | 5.94 | 24.10 | 21.04 | |
| >20 – 24 | Exclusively Full-Time | 70.06 | 62.50 | 5.55 | 2.01 | 4.48 | 25.46 |
| Exclusively Part-Time | 17.76 | 9.44 | 2.66 | 5.66 | 14.81 | 67.43 | |
| Mixed Enrollment | 45.03 | 33.53 | 6.65 | 4.85 | 23.38 | 31.59 | |
| Older than 24 | Exclusively Full-Time | 67.63 | 63.03 | 3.16 | 1.43 | 5.20 | 27.17 |
| Exclusively Part-Time | 28.35 | 24.63 | 1.78 | 1.93 | 10.68 | 60.97 | |
| Mixed Enrollment | 48.20 | 38.48 | 6.64 | 3.08 | 18.05 | 33.75 | |
| Age Missing | Exclusively Full-Time | 24.96 | 20.16 | – | 3.51 | – | 75.04 |
| Exclusively Part-Time | 10.30 | 8.85 | – | – | – | 88.47 | |
| Mixed Enrollment | 16.61 | 13.94 | – | – | 4.53 | 78.86 | |
Table 22. Six‐Year Outcomes and First Completion for Students Who Started at Two‐Year Public Institutions by Enrollment Intensity (N=983,433)
| Total Completion Rate | 1st Completion at Same Institution | 1st Completion at Different Institution | Subsequent Completion at a Four-Year | Total Four-Year Completion Rate | Still Enrolled (At Any Institution) | Not Enrolled (At Any Institution) | ||
| Two-Year | Four-Year | |||||||
| Overall | 39.13 | 26.14 | 3.22 | 9.77 | 6.41 | 16.18 | 17.93 | 42.94 |
| Exclusively Full-Time | 57.00 | 42.93 | 2.72 | 11.35 | 16.20 | 27.55 | 3.52 | 39.48 |
| Exclusively Part-Time | 18.79 | 16.50 | 1.44 | 0.85 | 1.47 | 2.32 | 10.93 | 70.28 |
| Mixed Enrollment | 35.89 | 21.81 | 3.62 | 10.46 | 3.79 | 14.25 | 23.75 | 40.35 |
Data in this table are displayed in the report in Figures 19 and 20.
Table 23. Six‐Year Outcomes and First Completion for Students Who Started at Two‐Year Public Institutions by Gender (N=910,485)
| Total Completion Rate | 1st Completion at Same Institution | 1st Completion at Different Institution | Subsequent Completion at a Four-Year | Total Four-Year Completion Rate | Still Enrolled (At Any Institution) | Not Enrolled (At Any Institution) | ||
| Two-Year | Four-Year | |||||||
| Overall | 39.13 | 26.14 | 3.22 | 9.77 | 6.41 | 16.18 | 17.93 | 42.94 |
| Men | 36.41 | 24.46 | 2.75 | 9.19 | 5.60 | 14.80 | 17.87 | 45.73 |
| Women | 42.62 | 28.28 | 3.73 | 10.61 | 7.38 | 18.00 | 18.55 | 38.83 |
Data in this table are displayed in the report in Figure 21.
Table 24. Six‐Year Outcomes and First Completion for Students Who Started at Two‐Year Public Institutions by Age at First Entry (N=983,433)
| Total Completion Rate | 1st Completion at Same Institution | 1st Completion at Different Institution | Subsequent Completion at a Four-Year | Total Four-Year Completion Rate | Still Enrolled (At Any Institution) | Not Enrolled (At Any Institution) | ||
| Two-Year | Four-Year | |||||||
| Overall | 39.13 | 26.14 | 3.22 | 9.77 | 6.41 | 16.18 | 17.93 | 42.94 |
| 20 and Younger | 41.23 | 25.76 | 3.47 | 12.00 | 7.59 | 19.59 | 19.64 | 39.12 |
| >20 – 24 | 27.76 | 20.01 | 2.87 | 4.87 | 3.30 | 8.17 | 17.33 | 54.91 |
| Older than 24 | 37.01 | 30.18 | 2.51 | 4.32 | 3.56 | 7.88 | 12.56 | 50.42 |
| Age Missing | 29.32 | 27.56 | 1.51 | 0.26 | 9.61 | 9.87 | 0.96 | 69.72 |
Data in this table are displayed in the report in Figures 22 and 23.
Table 25. Six‐Year Outcomes and First Completion for Students Who Started at Two‐Year Public Institutions by Gender and Age at First Entry (N=910,485)
| Gender | Age at First Entry | Total Completion Rate | 1st Completion at Same Institution | 1st Completion at Different Institution | Subsequent Completion at a Four-Year | Total Four-Year Completion Rate | Still Enrolled (At Any Institution) | Not Enrolled (At Any Institution) | |
| Two-Year | Four-Year | ||||||||
| Men | 20 and Younger | 37.66 | 23.84 | 2.90 | 10.92 | 6.41 | 17.34 | 19.81 | 42.52 |
| >20 – 24 | 26.43 | 19.22 | 2.47 | 4.74 | 3.06 | 7.80 | 15.98 | 57.59 | |
| Older than 24 | 36.78 | 29.93 | 2.34 | 4.51 | 3.53 | 8.04 | 11.05 | 52.16 | |
| Age Missing | 28.00 | 26.82 | 1.06 | – | 7.69 | 7.82 | 1.17 | 70.83 | |
| Women | 20 and Younger | 45.59 | 28.19 | 4.10 | 13.30 | 8.97 | 22.27 | 19.97 | 34.44 |
| >20 – 24 | 29.69 | 21.30 | 3.42 | 4.97 | 3.48 | 8.45 | 19.60 | 50.71 | |
| Older than 24 | 38.24 | 31.10 | 2.70 | 4.44 | 3.78 | 8.22 | 14.05 | 47.71 | |
| Age Missing | 31.57 | 29.17 | 1.98 | – | 11.42 | 11.85 | 1.03 | 67.40 | |
Data in this table are displayed in the report in Figure 24.
Table 26. Six‐Year Outcomes and First Completion for Students Who Started at Two‐Year Public Institutions by Age at First Entry and Enrollment Intensity (N=982,616)
| Age at First Entry | Enrollment Intensity | Total Completion Rate | 1st Completion at Same Institution | 1st Completion at Different Institution | Subsequent Completion at a Four-Year | Total Four-Year Completion Rate | Still Enrolled (At Any Institution) | Not Enrolled (At Any Institution) | |
| Two-Year | Four-Year | ||||||||
| 20 and Younger | Exclusively Full-Time | 61.55 | 44.35 | 3.01 | 14.19 | 19.76 | 33.95 | 3.76 | 34.68 |
| Exclusively Part-Time | 12.12 | 10.18 | 1.44 | 0.50 | 1.22 | 1.72 | 12.05 | 75.84 | |
| Mixed Enrollment | 36.83 | 20.88 | 3.77 | 12.18 | 4.10 | 16.28 | 25.44 | 37.73 | |
| >20 – 24 | Exclusively Full-Time | 38.37 | 30.11 | 2.46 | 5.80 | 7.27 | 13.07 | 4.21 | 57.42 |
| Exclusively Part-Time | 12.81 | 10.72 | 1.56 | 0.53 | 0.76 | 1.30 | 11.16 | 76.03 | |
| Mixed Enrollment | 26.87 | 18.22 | 3.26 | 5.38 | 2.37 | 7.76 | 23.17 | 49.96 | |
| Older than 24 | Exclusively Full-Time | 49.03 | 43.86 | 1.75 | 3.42 | 6.52 | 9.94 | 2.37 | 48.60 |
| Exclusively Part-Time | 26.61 | 23.93 | 1.41 | 1.27 | 1.89 | 3.15 | 9.93 | 63.46 | |
| Mixed Enrollment | 36.54 | 27.61 | 3.18 | 5.76 | 3.10 | 8.86 | 17.17 | 46.29 | |
| Age Missing | Exclusively Full-Time | 39.53 | 38.05 | 1.29 | – | 16.58 | 16.77 | – | 60.22 |
| Exclusively Part-Time | 13.35 | 12.41 | – | – | – | – | – | 85.25 | |
| Mixed Enrollment | 22.63 | 20.41 | 1.87 | – | 4.64 | 4.93 | 1.48 | 75.94 | |
Data in this table are displayed in the report in Figures 25 and 26.
Table 27. Overall Completion Rates of Men by Age at First Entry and Enrollment Intensity for Students Who Started at Two‐Year Public Institutions (N=412,140)
| Age at First Entry | Enrollment Intensity | Total Completion Rate | 1st Completion at Same Institution | 1st Completion at Different Institution | Subsequent Completion at a Four-Year | Total Four-Year Completion Rate | Still Enrolled (At Any Institution) | Not Enrolled (At Any Institution) | |
| Two-Year | Four-Year | ||||||||
| 20 and Younger | Exclusively Full-Time | 57.58 | 41.77 | 2.73 | 13.08 | 16.41 | 29.49 | 4.15 | 38.28 |
| Exclusively Part-Time | 10.61 | 9.10 | 1.18 | 0.33 | 0.87 | 1.20 | 11.14 | 78.25 | |
| Mixed Enrollment | 33.03 | 18.87 | 3.10 | 11.06 | 3.41 | 14.47 | 25.96 | 41.02 | |
| >20 – 24 | Exclusively Full-Time | 37.63 | 30.04 | 2.12 | 5.47 | 6.22 | 11.68 | 3.69 | 58.68 |
| Exclusively Part-Time | 11.08 | 9.51 | 1.32 | 0.25 | 0.56 | 0.80 | 9.77 | 79.15 | |
| Mixed Enrollment | 24.65 | 16.50 | 2.83 | 5.31 | 2.20 | 7.51 | 22.46 | 52.89 | |
| Older than 24 | Exclusively Full-Time | 49.96 | 44.83 | 1.65 | 3.48 | 5.69 | 9.16 | 2.10 | 47.94 |
| Exclusively Part-Time | 25.10 | 22.50 | 1.48 | 1.12 | 1.91 | 3.03 | 8.53 | 66.36 | |
| Mixed Enrollment | 34.53 | 25.32 | 2.98 | 6.22 | 3.05 | 9.27 | 16.33 | 49.14 | |
| Age Missing | Exclusively Full-Time | 38.50 | 37.55 | – | – | 12.24 | 12.24 | – | 61.26 |
| Exclusively Part-Time | 10.95 | 9.84 | – | – | – | – | – | 86.32 | |
| Mixed Enrollment | 20.62 | 19.16 | 1.31 | – | 4.30 | 4.45 | 1.83 | 77.55 | |
Table 28. Overall Completion Rates of Women by Age at First Entry and Enrollment Intensity for Students Who Started at Two‐Year Public Institutions (N=497,607)
| Age at First Entry | Enrollment Intensity | Total Completion Rate | 1st Completion at Same Institution | 1st Completion at Different Institution | Subsequent Completion at a Four-Year | Total Four-Year Completion Rate | Still Enrolled (At Any Institution) | Not Enrolled (At Any Institution) | |
| Two-Year | Four-Year | ||||||||
| 20 and Younger | Exclusively Full-Time | 67.26 | 48.31 | 3.39 | 15.56 | 23.91 | 39.47 | 3.51 | 29.23 |
| Exclusively Part-Time | 14.43 | 11.92 | 1.81 | 0.70 | 1.67 | 2.37 | 13.76 | 71.82 | |
| Mixed Enrollment | 41.05 | 23.08 | 4.48 | 13.48 | 4.84 | 18.33 | 25.52 | 33.44 | |
| >20 – 24 | Exclusively Full-Time | 40.83 | 31.62 | 3.13 | 6.07 | 8.51 | 14.59 | 5.28 | 53.89 |
| Exclusively Part-Time | 15.20 | 12.43 | 1.93 | 0.83 | 0.99 | 1.83 | 13.31 | 71.50 | |
| Mixed Enrollment | 29.30 | 20.09 | 3.76 | 5.44 | 2.54 | 7.98 | 24.79 | 45.91 | |
| Older than 24 | Exclusively Full-Time | 50.05 | 44.52 | 1.94 | 3.59 | 7.96 | 11.54 | 2.85 | 47.11 |
| Exclusively Part-Time | 28.66 | 25.79 | 1.40 | 1.47 | 1.98 | 3.45 | 11.12 | 60.22 | |
| Mixed Enrollment | 38.53 | 29.40 | 3.37 | 5.75 | 3.29 | 9.04 | 18.19 | 43.28 | |
| Age Missing | Exclusively Full-Time | 40.93 | 39.00 | 1.56 | – | 20.73 | 21.11 | – | 58.83 |
| Exclusively Part-Time | 17.83 | 16.78 | – | – | – | – | – | 81.64 | |
| Mixed Enrollment | 25.86 | 22.71 | 2.58 | – | 5.12 | 5.69 | 1.67 | 72.47 | |
Table 29. Six‐Year Outcomes and First Completion for Non‐Degree‐Seeking Students Who Started at Two‐Year Public Institutions by Enrollment Intensity (N=521,672)
| Total Completion Rate | 1st Completion at Same Institution | 1st Completion at Different Institution | Subsequent Completion at a Four-Year | Total Four-Year Completion Rate | Still Enrolled (At Any Institution) | Not Enrolled (At Any Institution) | ||
| Two-Year | Four-Year | |||||||
| Overall | 24.89 | 8.84 | 3.16 | 12.89 | 1.31 | 14.20 | 22.95 | 52.16 |
| Exclusively Full-Time | 7.25 | 3.68 | 2.62 | 0.95 | – | 1.44 | 9.31 | 83.44 |
| Exclusively Part-Time | 9.86 | 7.71 | 1.39 | 0.76 | 0.64 | 1.39 | 9.89 | 80.25 |
| Mixed Enrollment | 35.07 | 9.62 | 4.35 | 21.10 | 1.76 | 22.86 | 31.79 | 33.14 |
Table 30. Six‐Year Outcomes and First Completion for Non‐Degree‐Seeking Students Who Started at Two‐Year Public Institutions by Gender (N=482,504)
| Total Completion Rate | 1st Completion at Same Institution | 1st Completion at Different Institution | Subsequent Completion at a Four-Year | Total Four-Year Completion Rate | Still Enrolled (At Any Institution) | Not Enrolled (At Any Institution) | ||
| Two-Year | Four-Year | |||||||
| Overall | 24.89 | 8.84 | 3.16 | 12.89 | 1.31 | 14.20 | 22.95 | 52.16 |
| Men | 21.64 | 7.84 | 2.87 | 10.93 | 1.06 | 12.00 | 23.19 | 55.16 |
| Women | 28.78 | 10.04 | 3.54 | 15.19 | 1.61 | 16.80 | 23.73 | 47.50 |
Table 31. Six‐Year Outcomes and First Completion for Non‐Degree‐Seeking Students Who Started at Two‐Year Public Institutions by Age at First Entry (N=521,672)
| Total Completion Rate | 1st Completion at Same Institution | 1st Completion at Different Institution | Subsequent Completion at a Four-Year | Total Four-Year Completion Rate | Still Enrolled (At Any Institution) | Not Enrolled (At Any Institution) | ||
| Two-Year | Four-Year | |||||||
| Overall | 24.89 | 8.84 | 3.16 | 12.89 | 1.31 | 14.20 | 22.95 | 52.16 |
| 20 and Younger | 31.91 | 8.96 | 3.63 | 19.33 | 1.75 | 21.08 | 26.97 | 41.12 |
| >20 – 24 | 11.21 | 5.51 | 3.32 | 2.37 | 0.42 | 2.79 | 21.06 | 67.73 |
| Older than 24 | 14.45 | 9.59 | 2.19 | 2.67 | 0.66 | 3.32 | 15.35 | 70.20 |
| Age Missing | 7.63 | 6.09 | 1.24 | 0.30 | 0.51 | 0.81 | 11.80 | 80.57 |
Table 32. Six‐Year Outcomes and First Completion for Non‐Degree‐Seeking Students Who Started at Two‐Year Public Institutions by Gender and Age at First Entry (N=482,507)
| Gender | Age at First Entry | Total Completion Rate | 1st Completion at Same Institution | 1st Completion at Different Institution | Subsequent Completion at a Four-Year | Total Four-Year Completion Rate | Still Enrolled (At Any Institution) | Not Enrolled (At Any Institution) | |
| Two-Year | Four-Year | ||||||||
| Men | 20 and Younger | 26.86 | 7.83 | 3.06 | 15.97 | 1.32 | 17.28 | 27.47 | 45.67 |
| >20 – 24 | 10.10 | 4.86 | 3.01 | 2.23 | 0.43 | 2.67 | 19.45 | 70.45 | |
| Older than 24 | 13.88 | 8.94 | 2.42 | 2.52 | 0.70 | 3.22 | 14.87 | 71.26 | |
| Age Missing | 6.88 | 5.15 | 1.34 | – | – | 0.77 | 11.83 | 81.29 | |
| Women | 20 and Younger | 37.50 | 10.30 | 4.25 | 22.95 | 2.22 | 25.17 | 27.32 | 35.18 |
| >20 – 24 | 13.15 | 6.56 | 3.88 | 2.70 | 0.44 | 3.14 | 24.35 | 62.50 | |
| Older than 24 | 15.51 | 10.40 | 2.11 | 3.00 | 0.67 | 3.67 | 16.66 | 67.83 | |
| Age Missing | 8.96 | 7.69 | 0.96 | – | 0.72 | 1.02 | 13.38 | 77.66 | |
Table 33. Six‐Year Outcomes and First Completion for Non‐Degree‐Seeking Students Who Started at Two‐Year Public Institutions by Age at First Entry and Enrollment Intensity (N=521,672)
| Age at First Entry | Enrollment Intensity | Total Completion Rate | 1st Completion at Same Institution | 1st Completion at Different Institution | Subsequent Completion at a Four-Year | Total Four-Year Completion Rate | Still Enrolled (At Any Institution) | Not Enrolled (At Any Institution) | |
| Two-Year | Four-Year | ||||||||
| 20 and Younger | Exclusively Full-Time | 6.55 | 4.06 | 2.03 | – | – | – | 8.91 | 84.54 |
| Exclusively Part-Time | 8.41 | 6.43 | 1.49 | 0.48 | 0.85 | 1.33 | 9.91 | 81.68 | |
| Mixed Enrollment | 39.48 | 9.77 | 4.31 | 25.39 | 2.04 | 27.43 | 32.46 | 28.06 | |
| >20 – 24 | Exclusively Full-Time | 10.11 | – | 5.88 | – | – | – | 9.14 | 80.75 |
| Exclusively Part-Time | 7.52 | 5.07 | 1.74 | 0.71 | 0.26 | 0.97 | 9.97 | 82.51 | |
| Mixed Enrollment | 15.55 | 6.06 | 5.15 | 4.34 | 0.60 | 4.93 | 34.21 | 50.24 | |
| Older than 24 | Exclusively Full-Time | 6.96 | 3.49 | 1.92 | – | – | 2.11 | 10.08 | 82.96 |
| Exclusively Part-Time | 11.51 | 9.28 | 1.25 | 0.98 | 0.57 | 1.55 | 10.00 | 78.49 | |
| Mixed Enrollment | 21.05 | 10.35 | 4.29 | 6.42 | 0.85 | 7.26 | 27.25 | 51.69 | |
| Age Missing | Exclusively Full-Time | – | – | – | – | – | – | – | 92.31 |
| Exclusively Part-Time | 7.15 | 5.89 | 0.98 | – | 0.37 | 0.65 | 5.08 | 87.77 | |
| Mixed Enrollment | 9.51 | 7.00 | 2.12 | – | – | 1.46 | 38.37 | 52.12 | |
Table 34. Six‐Year Outcomes and First Completion for Male Non‐Degree‐Seeking Students Who Started at Two‐Year Public Institutions by Age at First Entry and Enrollment Intensity (N=220,310)
| Age at First Entry | Enrollment Intensity | Total Completion Rate | 1st Completion at Same Institution | 1st Completion at Different Institution | Subsequent Completion at a Four-Year | Total Four-Year Completion Rate | Still Enrolled (At Any Institution) | Not Enrolled (At Any Institution) | |
| Two-Year | Four-Year | ||||||||
| 20 and Younger | Exclusively Full-Time | 6.12 | 4.03 | – | – | – | – | 8.89 | 84.99 |
| Exclusively Part-Time | 6.50 | 5.12 | 1.08 | 0.30 | 0.46 | 0.76 | 9.31 | 84.19 | |
| Mixed Enrollment | 34.46 | 8.85 | 3.80 | 21.81 | 1.64 | 23.45 | 34.25 | 31.29 | |
| >20 – 24 | Exclusively Full-Time | – | – | – | – | – | – | – | 84.40 |
| Exclusively Part-Time | 6.75 | 4.46 | 1.65 | 0.63 | 0.27 | 0.91 | 9.08 | 84.18 | |
| Mixed Enrollment | 14.49 | 5.39 | 4.75 | 4.35 | 0.63 | 4.98 | 33.15 | 52.36 | |
| Older than 24 | Exclusively Full-Time | 8.03 | – | – | – | – | – | 9.38 | 82.59 |
| Exclusively Part-Time | 11.37 | 8.87 | 1.56 | 0.93 | 0.64 | 1.57 | 10.09 | 78.54 | |
| Mixed Enrollment | 20.15 | 9.17 | 4.52 | 6.46 | 0.87 | 7.33 | 26.75 | 53.10 | |
| Age Missing | Exclusively Full-Time | – | – | – | – | – | – | – | – |
| Exclusively Part-Time | 6.53 | 4.93 | 1.19 | – | – | – | 5.09 | 88.39 | |
| Mixed Enrollment | 8.39 | 6.13 | – | – | – | – | 39.74 | 51.87 | |
Table 35. Six‐Year Outcomes and First Completion for Female Non‐Degree‐Seeking Students Who Started at Two‐Year Public Institutions by Age at First Entry and Enrollment Intensity (N=262,197)
| Age at First Entry | Enrollment Intensity | Total Completion Rate | 1st Completion at Same Institution | 1st Completion at Different Institution | Subsequent Completion at a Four-Year | Total Four-Year Completion Rate | Still Enrolled (At Any Institution) | Not Enrolled (At Any Institution) | |
| Two-Year | Four-Year | ||||||||
| 20 and Younger | Exclusively Full-Time | 7.36 | 3.80 | – | – | – | – | 9.57 | 83.08 |
| Exclusively Part-Time | 11.27 | 8.51 | 2.02 | 0.74 | 1.40 | 2.14 | 11.40 | 77.32 | |
| Mixed Enrollment | 44.29 | 10.77 | 4.83 | 28.69 | 2.44 | 31.13 | 31.45 | 24.26 | |
| >20 – 24 | Exclusively Full-Time | 9.02 | – | – | – | – | – | 13.64 | 77.34 |
| Exclusively Part-Time | 9.28 | 6.45 | 1.94 | 0.89 | 0.26 | 1.15 | 11.90 | 78.82 | |
| Mixed Enrollment | 17.00 | 6.72 | 5.79 | 4.49 | 0.61 | 5.10 | 36.72 | 46.28 | |
| Older than 24 | Exclusively Full-Time | 6.15 | – | – | – | – | – | 11.89 | 81.96 |
| Exclusively Part-Time | 12.17 | 10.01 | 1.04 | 1.13 | 0.58 | 1.71 | 10.63 | 77.20 | |
| Mixed Enrollment | 22.17 | 11.24 | 4.24 | 6.69 | 0.86 | 7.55 | 28.55 | 49.29 | |
| Age Missing | Exclusively Full-Time | – | – | – | – | – | – | – | – |
| Exclusively Part-Time | 8.56 | 7.72 | – | – | – | 0.84 | 5.68 | 85.76 | |
| Mixed Enrollment | 10.22 | 7.66 | – | – | – | – | 42.35 | 47.43 | |
Table 36. Six‐Year Outcomes for Students Who Started at Four‐Year Private Nonprofit Institutions by Enrollment Intensity (N=464,805)
| Total Completion Rate | Completion at Same Institution | Completion at Different Institution | Still Enrolled (At Any Institution) | Not Enrolled (At Any Institution) | ||
| Four-Year | Two-Year | |||||
| Overall | 73.57 | 59.82 | 11.16 | 2.59 | 9.26 | 17.17 |
| Exclusively Full-Time | 86.65 | 76.59 | 8.75 | 1.31 | 2.44 | 10.91 |
| Exclusively Part-Time | 33.31 | 26.95 | 2.39 | 3.98 | 8.36 | 58.33 |
| Mixed Enrollment | 53.19 | 31.59 | 16.72 | 4.88 | 22.36 | 24.45 |
Data in this table are displayed in the report in Figure 27.
Table 37. Six‐Year Outcomes for Students Who Started at Four‐Year Private Nonprofit Institutions by Gender (N=433,621)
| Total Completion Rate | Completion at Same Institution | Completion at Different Institution | Still Enrolled (At Any Institution) | Not Enrolled (At Any Institution) | ||
| Four-Year | Two-Year | |||||
| Overall | 73.57 | 59.82 | 11.16 | 2.59 | 9.26 | 17.17 |
| Men | 69.83 | 56.99 | 10.22 | 2.61 | 10.84 | 19.33 |
| Women | 76.86 | 61.85 | 12.31 | 2.70 | 8.30 | 14.84 |
Data in this table are displayed in the report in Figure 28.
Table 38. Six‐Year Outcomes for Students Who Started at Four‐Year Private Nonprofit Institutions by Age at First Entry (N= 464,805)
| Total Completion Rate | Completion at Same Institution | Completion at Different Institution | Still Enrolled (At Any Institution) | Not Enrolled (At Any Institution) | ||
| Four-Year | Two-Year | |||||
| Overall | 73.57 | 59.82 | 11.16 | 2.59 | 9.26 | 17.17 |
| 20 and Younger | 76.65 | 61.74 | 12.28 | 2.63 | 9.17 | 14.18 |
| >20 – 24 | 61.83 | 52.12 | 6.82 | 2.89 | 10.03 | 28.14 |
| Older than 24 | 55.30 | 48.59 | 4.44 | 2.26 | 9.75 | 34.94 |
| Age Missing | 26.95 | 24.91 | – | – | 4.34 | 68.71 |
Data in this table are displayed in the report in Figure 29.
Table 39. Six‐Year Outcomes for Students Who Started at Four‐Year Private Nonprofit Institutions by Gender and Age at First Entry (N= 433,621)
| Gender | Age at First Entry | Total Completion Rate | Completion at Same Institution | Completion at Different Institution | Still Enrolled (At Any Institution) | Not Enrolled (At Any Institution) | |
| Four-Year | Two-Year | ||||||
| Men | 20 and Younger | 72.37 | 58.85 | 11.10 | 2.42 | 10.95 | 16.68 |
| >20 – 24 | 57.91 | 47.62 | 6.73 | 3.58 | 11.77 | 30.31 | |
| Older than 24 | 55.53 | 46.83 | 4.98 | 3.73 | 9.71 | 34.76 | |
| Age Missing | 23.67 | 20.41 | – | – | 5.31 | 70.61 | |
| Women | 20 and Younger | 80.37 | 63.98 | 13.52 | 2.87 | 7.97 | 11.66 |
| >20 – 24 | 62.80 | 51.89 | 8.05 | 2.86 | 9.93 | 27.27 | |
| Older than 24 | 53.95 | 48.36 | 4.18 | 1.42 | 10.51 | 35.54 | |
| Age Missing | 28.37 | 26.93 | – | – | 3.72 | 67.91 | |
Data in this table are displayed in the report in Figure 30.
Table 40. Six‐Year Outcomes for Students Who Started at Four‐Year Private Nonprofit Institutions by Age at First Entry and Enrollment Intensity (N= 464,604)
| Age at First Entry | Enrollment Intensity | Total Completion Rate | Completion at Same Institution | Completion at Different Institution | Still Enrolled (At Any Institution) | Not Enrolled (At Any Institution) | |
| Four-Year | Two-Year | ||||||
| 20 and Younger | Exclusively Full-Time | 88.08 | 77.59 | 9.16 | 1.33 | 2.35 | 9.56 |
| Exclusively Part-Time | 9.09 | 3.12 | 2.39 | 3.58 | 9.71 | 81.20 | |
| Mixed Enrollment | 53.29 | 28.88 | 19.05 | 5.36 | 23.66 | 23.06 | |
| >20 – 24 | Exclusively Full-Time | 73.57 | 66.25 | 6.25 | 1.07 | 3.12 | 23.32 |
| Exclusively Part-Time | 25.29 | 11.63 | 2.43 | 11.23 | 9.43 | 65.29 | |
| Mixed Enrollment | 49.07 | 36.21 | 8.39 | 4.47 | 20.91 | 30.02 | |
| Older than 24 | Exclusively Full-Time | 72.30 | 67.33 | 3.90 | 1.07 | 3.47 | 24.23 |
| Exclusively Part-Time | 37.30 | 31.29 | 2.42 | 3.58 | 8.26 | 54.45 | |
| Mixed Enrollment | 54.06 | 45.58 | 6.14 | 2.34 | 15.52 | 30.42 | |
| Age Missing | Exclusively Full-Time | 46.34 | 44.23 | – | – | – | 53.66 |
| Exclusively Part-Time | 15.45 | 13.70 | – | – | – | 83.18 | |
| Mixed Enrollment | 24.83 | 22.90 | – | – | 14.68 | 60.49 | |
Data in this table are displayed in the report in Figure 31.
Table 41. Overall Completion Rates of Men Who Started at Four‐Year Private Nonprofit Institutions by Age at First Entry and Enrollment Intensity (N= 189,717)
| Age at First Entry | Enrollment Intensity | Total Completion Rate | Completion at Same Institution | Completion at Different Institution | Still Enrolled (At Any Institution) | Not Enrolled (At Any Institution) | |
| Four-Year | Two-Year | ||||||
| 20 and Younger | Exclusively Full-Time | 85.54 | 76.08 | 8.21 | 1.26 | 3.10 | 11.36 |
| Exclusively Part-Time | 6.14 | 2.21 | – | 3.09 | 8.59 | 85.27 | |
| Mixed Enrollment | 48.33 | 26.94 | 16.77 | 4.62 | 25.94 | 25.73 | |
| >20 – 24 | Exclusively Full-Time | 70.55 | 62.98 | 6.16 | 1.41 | 3.67 | 25.78 |
| Exclusively Part-Time | 24.88 | 9.34 | – | 14.65 | 10.30 | 64.82 | |
| Mixed Enrollment | 45.43 | 32.11 | 8.35 | 4.97 | 23.16 | 31.41 | |
| Older than 24 | Exclusively Full-Time | 71.21 | 64.77 | 4.71 | 1.73 | 3.69 | 25.10 |
| Exclusively Part-Time | 39.32 | 29.89 | 2.78 | 6.66 | 7.78 | 52.89 | |
| Mixed Enrollment | 53.09 | 42.96 | 6.59 | 3.54 | 16.00 | 30.91 | |
| Age Missing | Exclusively Full-Time | 37.89 | 35.49 | – | – | – | 62.11 |
| Exclusively Part-Time | 12.71 | – | – | – | – | 87.29 | |
| Mixed Enrollment | 23.75 | 21.89 | – | – | 21.96 | 54.29 | |
Table 42. Overall Completion Rates of Women Who Started at Four‐Year Private Nonprofit Institutions by Age at First Entry and Enrollment Intensity (N=243,721)
| Age at First Entry | Enrollment Intensity | Total Completion Rate | Completion at Same Institution | Completion at Different Institution | Still Enrolled (At Any Institution) | Not Enrolled (At Any Institution) | |
| Four-Year | Two-Year | ||||||
| 20 and Younger | Exclusively Full-Time | 90.42 | 78.93 | 10.07 | 1.42 | 1.83 | 7.75 |
| Exclusively Part-Time | 13.02 | 4.44 | 3.92 | 4.66 | 11.04 | 75.94 | |
| Mixed Enrollment | 58.17 | 30.45 | 21.56 | 6.16 | 21.99 | 19.84 | |
| >20 – 24 | Exclusively Full-Time | 75.51 | 67.08 | 7.32 | 1.11 | 2.56 | 21.93 |
| Exclusively Part-Time | 26.22 | 12.82 | 4.34 | 9.06 | 9.37 | 64.41 | |
| Mixed Enrollment | 48.75 | 34.36 | 9.82 | 4.57 | 21.67 | 29.58 | |
| Older than 24 | Exclusively Full-Time | 72.29 | 68.47 | 3.13 | 0.70 | 3.35 | 24.35 |
| Exclusively Part-Time | 35.99 | 31.98 | 2.30 | 1.71 | 8.99 | 55.02 | |
| Mixed Enrollment | 54.03 | 46.32 | 6.03 | 1.68 | 16.00 | 29.97 | |
| Age Missing | Exclusively Full-Time | 54.54 | 52.35 | – | – | – | 45.46 |
| Exclusively Part-Time | 16.36 | 16.36 | – | – | – | 81.21 | |
| Mixed Enrollment | 23.22 | 21.00 | – | – | – | 66.78 | |
Table 43. Six‐Year Outcomes for Students Who Started at Four‐Year Private For‐Profit Institutions by Enrollment Intensity (N= 101,426)
| Total Completion Rate | Completion at Same Institution | Completion at Different Institution | Still Enrolled (At Any Institution) | Not Enrolled (At Any Institution) | ||
| Four-Year | Two-Year | |||||
| Overall | 38.41 | 30.12 | 6.29 | 2.01 | 11.71 | 49.88 |
| Exclusively Full-Time | 58.21 | 53.04 | 4.03 | 1.15 | 3.45 | 38.33 |
| Exclusively Part-Time | 17.46 | 13.65 | 2.47 | 1.35 | 8.12 | 74.42 |
| Mixed Enrollment | 24.45 | 12.73 | 8.87 | 2.85 | 19.50 | 56.05 |
Data in this table are displayed in the report in Figure 32.
Table 44. Six‐Year Outcomes for Students Who Started at Four‐Year Private For‐Profit Institutions by Gender (N=97,977)
| Total Completion Rate | Completion at Same Institution | Completion at Different Institution | Still Enrolled (At Any Institution) | Not Enrolled (At Any Institution) | ||
| Four-Year | Two-Year | |||||
| Overall | 38.41 | 30.12 | 6.29 | 2.01 | 11.71 | 49.88 |
| Men | 36.24 | 27.07 | 6.96 | 2.22 | 11.23 | 52.53 |
| Women | 39.80 | 32.25 | 5.62 | 1.93 | 12.17 | 48.03 |
Data in this table are displayed in the report in Figure 33.
Table 45. Six‐Year Outcomes for Students Who Started at Four‐Year Private For‐Profit Institutions by Age at First Entry (N=101,426)
| Total Completion Rate | Completion at Same Institution | Completion at Different Institution | Still Enrolled (At Any Institution) | Not Enrolled (At Any Institution) | ||
| Four-Year | Two-Year | |||||
| Overall | 38.41 | 30.12 | 6.29 | 2.01 | 11.71 | 49.88 |
| 20 and Younger | 38.80 | 22.20 | 12.86 | 3.74 | 14.94 | 46.26 |
| >20 – 24 | 26.44 | 18.32 | 5.16 | 2.96 | 16.14 | 57.42 |
| Older than 24 | 40.24 | 33.41 | 5.29 | 1.54 | 10.44 | 49.32 |
| Age Missing | 29.58 | 27.33 | – | – | – | 68.47 |
Data in this table are displayed in the report in Figure 34.
Table 46. Six‐Year Outcomes for Students Who Started at Four‐Year Private For‐Profit Institutions by Gender and Age at First Entry (N=97,977)
| Gender | Age at First Entry | Total Completion Rate | Completion at Same Institution | Completion at Different Institution | Still Enrolled (At Any Institution) | Not Enrolled (At Any Institution) | |
| Four-Year | Two-Year | ||||||
| Men | 20 and Younger | 37.41 | 20.80 | 13.30 | 3.31 | 13.91 | 48.68 |
| >20 – 24 | 23.32 | 14.02 | 5.88 | 3.42 | 16.20 | 60.48 | |
| Older than 24 | 38.08 | 30.57 | 5.73 | 1.78 | 9.83 | 52.09 | |
| Age Missing | – | – | – | – | – | 60.23 | |
| Women | 20 and Younger | 40.18 | 23.60 | 12.25 | 4.34 | 16.35 | 43.47 |
| >20 – 24 | 28.10 | 20.82 | 4.50 | 2.78 | 16.50 | 55.40 | |
| Older than 24 | 41.55 | 35.28 | 4.82 | 1.45 | 10.90 | 47.55 | |
| Age Missing | – | – | – | – | – | 79.24 | |
Data in this table are displayed in the report in Figure 35.
Table 47. Six‐Year Outcomes for Students Who Started at Four‐Year Private For‐Profit Institutions by Age at First Entry and Enrollment Intensity (N=101,334)
| Age at First Entry | Enrollment Intensity | Total Completion Rate | Completion at Same Institution | Completion at Different Institution | Still Enrolled (At Any Institution) | Not Enrolled (At Any Institution) | |
| Four-Year | Two-Year | ||||||
| 20 and Younger | Exclusively Full-Time | 58.73 | 41.58 | 14.39 | 2.76 | 3.42 | 37.85 |
| Exclusively Part-Time | 6.02 | 3.30 | – | 1.91 | 9.22 | 84.77 | |
| Mixed Enrollment | 31.13 | 13.70 | 13.05 | 4.37 | 21.41 | 47.46 | |
| >20 – 24 | Exclusively Full-Time | 43.65 | 38.19 | 3.86 | 1.60 | 5.15 | 51.20 |
| Exclusively Part-Time | 6.24 | 2.98 | 1.32 | 1.93 | 8.08 | 85.68 | |
| Mixed Enrollment | 18.27 | 7.94 | 6.41 | 3.92 | 23.82 | 57.91 | |
| Older than 24 | Exclusively Full-Time | 59.93 | 56.30 | 2.74 | 0.89 | 3.25 | 36.82 |
| Exclusively Part-Time | 20.16 | 16.15 | 2.80 | 1.22 | 8.01 | 71.83 | |
| Mixed Enrollment | 24.05 | 13.46 | 8.33 | 2.27 | 18.17 | 57.78 | |
| Age Missing | Exclusively Full-Time | 43.12 | 43.12 | – | – | – | 53.29 |
| Exclusively Part-Time | – | – | – | – | – | – | |
| Mixed Enrollment | – | – | – | – | – | 86.67 | |
Data in this table are displayed in the report in Figure 36.
Table 48. Six‐Year Outcomes for Men Who Started at Four‐Year Private For‐Profit Institutions by Age at First Entry and Enrollment Intensity (N=35,405)
| Age at First Entry | Enrollment Intensity | Total Completion Rate | Completion at Same Institution | Completion at Different Institution | Still Enrolled (At Any Institution) | Not Enrolled (At Any Institution) | |
| Four-Year | Two-Year | ||||||
| 20 and Younger | Exclusively Full-Time | 57.96 | 41.85 | 13.58 | 2.52 | 2.72 | 39.32 |
| Exclusively Part-Time | 2.96 | 1.74 | 0.33 | 0.88 | 9.81 | 87.23 | |
| Mixed Enrollment | 31.43 | 13.12 | 14.41 | 3.90 | 19.35 | 49.22 | |
| >20 – 24 | Exclusively Full-Time | 39.01 | 32.11 | 4.43 | 2.47 | 5.41 | 55.57 |
| Exclusively Part-Time | 4.47 | – | – | – | 8.28 | 87.25 | |
| Mixed Enrollment | 17.43 | 5.97 | 7.34 | 4.12 | 23.15 | 59.41 | |
| Older than 24 | Exclusively Full-Time | 56.96 | 53.11 | 2.54 | 1.31 | 3.30 | 39.74 |
| Exclusively Part-Time | 16.32 | 11.62 | 3.33 | 1.36 | 7.82 | 75.87 | |
| Mixed Enrollment | 24.25 | 12.70 | 9.25 | 2.30 | 16.47 | 59.28 | |
| Age Missing | Exclusively Full-Time | – | – | – | – | – | – |
| Exclusively Part-Time | – | – | – | – | – | – | |
| Mixed Enrollment | – | – | – | – | – | – | |
Table 49. Six‐Year Outcomes for Women Who Started at Four‐Year Private For‐Profit Institutions by Age at First Entry and Enrollment Intensity (N= 62,485)
| Age at First Entry | Enrollment Intensity | Total Completion Rate | Completion at Same Institution | Completion at Different Institution | Still Enrolled (At Any Institution) | Not Enrolled (At Any Institution) | |
| Four-Year | Two-Year | ||||||
| 20 and Younger | Exclusively Full-Time | 59.84 | 41.93 | 14.82 | 3.09 | 3.99 | 36.17 |
| Exclusively Part-Time | 9.46 | 4.43 | – | – | 8.56 | 81.98 | |
| Mixed Enrollment | 30.34 | 13.87 | 11.37 | 5.10 | 24.26 | 45.39 | |
| >20 – 24 | Exclusively Full-Time | 46.05 | 41.48 | 3.34 | 1.24 | 5.12 | 48.83 |
| Exclusively Part-Time | 7.85 | 4.20 | – | – | 8.54 | 83.61 | |
| Mixed Enrollment | 17.94 | 8.52 | 5.56 | 3.86 | 24.85 | 57.21 | |
| Older than 24 | Exclusively Full-Time | 61.44 | 58.05 | 2.70 | 0.69 | 3.25 | 35.31 |
| Exclusively Part-Time | 22.59 | 18.86 | 2.61 | 1.11 | 8.34 | 69.07 | |
| Mixed Enrollment | 23.05 | 13.22 | 7.49 | 2.33 | 19.66 | 57.30 | |
| Age Missing | Exclusively Full-Time | – | – | – | – | – | 75.23 |
| Exclusively Part-Time | – | – | – | – | – | – | |
| Mixed Enrollment | – | – | – | – | – | – | |
Table 50. Completion Rates at Different Institutions Across State Lines by Enrollment Intensity (N=2,576,968)
| Total Completion Rate | Completion At Same Institution | Completion At Different Institution, In-State | Completion At Different Institution, Out-Of-State | Completion At Different Institution, Multiple State | ||||
| Two-Year | Four-Year | Two-Year | Four-Year | Two-Year | Four-Year | |||
| Overall | 55.51 | 42.38 | 2.30 | 6.70 | 0.71 | 2.90 | 0.21 | 0.31 |
| Exclusively Full-Time | 77.76 | 66.68 | 1.46 | 5.74 | 0.43 | 3.13 | 0.13 | 0.20 |
| Exclusively Part-Time | 21.15 | 17.60 | 0.84 | 0.64 | 1.29 | 0.40 | 0.16 | 0.21 |
| Mixed Enrollment | 43.56 | 27.76 | 3.10 | 8.16 | 0.84 | 3.04 | 0.26 | 0.41 |
Note: Students who started at multistate institutions are not included in the rates presented in this table. Data in this table are displayed in the report in Figure 37.
Table 51. Completion Rates at Different Institutions Across State Lines by Gender (N=2,392,821)
| Total Completion Rate | Completion At Same Institution | Completion At Different Institution, In-State | Completion At Different Institution, Out-Of-State | Completion At Different Institution, Multiple State | ||||
| Two-Year | Four-Year | Two-Year | Four-Year | Two-Year | Four-Year | |||
| Overall | 55.51 | 42.38 | 2.30 | 6.70 | 0.71 | 2.90 | 0.21 | 0.31 |
| Men | 51.98 | 40.08 | 2.02 | 6.04 | 0.79 | 2.71 | 0.10 | 0.24 |
| Women | 59.24 | 44.56 | 2.64 | 7.48 | 0.68 | 3.19 | 0.29 | 0.39 |
Note: Students who began at multistate institutions are not included in the rates presented in this table. Data in this table are displayed in the report in Figure 38.
Table 52. Completion Rates at Different Institutions Across State Lines by Age at First Entry (N=2,576,968)
| Total Completion Rate | Completion At Same Institution | Completion At Different Institution, In-State | Completion At Different Institution, Out-Of-State | Completion At Different Institution, Multiple State | ||||
| Two-Year | Four-Year | Two-Year | Four-Year | Two-Year | Four-Year | |||
| Overall | 55.51 | 42.38 | 2.30 | 6.70 | 0.71 | 2.90 | 0.21 | 0.31 |
| 20 and Younger | 59.38 | 44.64 | 2.54 | 7.76 | 0.63 | 3.34 | 0.21 | 0.26 |
| >20 – 24 | 39.03 | 30.78 | 1.66 | 3.15 | 1.10 | 1.59 | 0.28 | 0.47 |
| Older than 24 | 42.27 | 35.53 | 1.34 | 2.59 | 1.00 | 1.10 | 0.14 | 0.56 |
| Age Missing | 24.56 | 22.70 | 0.94 | 0.23 | 0.13 | 0.13 | 0.30 | 0.14 |
Note: Students who began at multistate institutions are not included in the rates presented in this table. Data in this table are displayed in the report in Figure 39.
Table 53. Completion Rates at Different Institutions Across State Lines by Gender and Age at First Entry (N=2,392,821)
| Gender | Age at First Entry | Total Completion Rate | Completion At Same Institution | Completion At Different Institution, In-State | Completion At Different Institution, Out-Of-State | Completion At Different Institution, Multiple State | |||
| Two-Year | Four-Year | Two-Year | Four-Year | Two-Year | Four-Year | ||||
| Men | 20 and Younger | 54.94 | 41.91 | 2.20 | 6.88 | 0.62 | 3.04 | 0.11 | 0.18 |
| >20 – 24 | 37.01 | 28.95 | 1.53 | 3.02 | 1.33 | 1.71 | 0.11 | 0.37 | |
| Older than 24 | 42.24 | 35.07 | 1.19 | 2.54 | 1.60 | 1.25 | 0.08 | 0.52 | |
| Age Missing | 23.88 | 22.48 | 0.81 | – | – | – | – | – | |
| Women | 20 and Younger | 64.01 | 47.39 | 2.91 | 8.71 | 0.66 | 3.72 | 0.30 | 0.32 |
| >20 – 24 | 39.21 | 30.16 | 1.98 | 3.31 | 1.01 | 1.59 | 0.49 | 0.68 | |
| Older than 24 | 42.09 | 35.26 | 1.50 | 2.73 | 0.68 | 1.07 | 0.19 | 0.66 | |
| Age Missing | 25.69 | 23.13 | 1.19 | 0.39 | – | – | 0.52 | – | |
Data in this table are displayed in the report in Figure 40.
Table 54. Completion Rates at Different Institutions Across State Lines by Age at First Entry and Enrollment Intensity (N=2,575,754)
| Age at First Entry | Enrollment Intensity | Total Completion Rate | Completion At Same Institution | Completion At Different Institution, In-State | Completion At Different Institution, Out-Of-State | Completion At Different Institution, Multiple State | |||
| Two-Year | Four-Year | Two-Year | Four-Year | Two-Year | Four-Year | ||||
| 20 and Younger | Exclusively Full-Time | 81.08 | 69.09 | 1.54 | 6.26 | 0.43 | 3.45 | 0.13 | 0.18 |
| Exclusively Part-Time | 10.94 | 8.53 | 1.03 | 0.30 | 0.33 | 0.21 | 0.33 | 0.21 | |
| Mixed Enrollment | 44.80 | 27.25 | 3.40 | 9.34 | 0.80 | 3.42 | 0.27 | 0.32 | |
| >20 – 24 | Exclusively Full-Time | 57.06 | 49.64 | 1.18 | 3.27 | 0.46 | 1.96 | 0.20 | 0.35 |
| Exclusively Part-Time | 14.98 | 10.30 | 0.89 | 0.48 | 2.55 | 0.38 | 0.12 | 0.26 | |
| Mixed Enrollment | 33.70 | 24.28 | 2.07 | 3.61 | 1.17 | 1.63 | 0.36 | 0.58 | |
| Older than 24 | Exclusively Full-Time | 58.70 | 53.99 | 0.87 | 2.21 | 0.35 | 0.76 | 0.12 | 0.40 |
| Exclusively Part-Time | 28.75 | 24.68 | 0.73 | 0.88 | 1.67 | 0.53 | 0.05 | 0.20 | |
| Mixed Enrollment | 41.51 | 32.51 | 1.86 | 3.62 | 0.97 | 1.55 | 0.19 | 0.81 | |
| Age Missing | Exclusively Full-Time | 35.15 | 33.20 | 1.20 | – | – | – | – | – |
| Exclusively Part-Time | 11.25 | 9.94 | – | – | – | – | – | – | |
| Mixed Enrollment | 19.88 | 17.89 | 1.03 | 0.30 | – | – | 0.42 | – | |
Data in this table are displayed in the report in Figure 41.
Table 55. Completion Rates for Men at Different Institutions Across State Lines by Age at First Entry and Enrollment Intensity (N=1,076,642)
| Age at First Entry | Enrollment Intensity | Total Completion Rate | Completion At Same Institution | Completion At Different Institution, In-State | Completion At Different Institution, Out-Of-State | Completion At Different Institution, Multiple State | |||
| Two-Year | Four-Year | Two-Year | Four-Year | Two-Year | Four-Year | ||||
| 20 and Younger | Exclusively Full-Time | 77.19 | 66.20 | 1.45 | 5.69 | 0.46 | 3.19 | 0.07 | 0.13 |
| Exclusively Part-Time | 9.50 | 7.65 | 0.80 | 0.20 | 0.35 | 0.15 | 0.21 | 0.13 | |
| Mixed Enrollment | 40.98 | 25.82 | 2.83 | 8.14 | 0.74 | 3.10 | 0.13 | 0.23 | |
| >20 – 24 | Exclusively Full-Time | 53.89 | 46.65 | 1.19 | 3.13 | 0.56 | 2.04 | 0.07 | 0.25 |
| Exclusively Part-Time | 13.93 | 9.02 | 0.76 | 0.22 | 3.35 | 0.33 | – | 0.21 | |
| Mixed Enrollment | 31.72 | 22.52 | 1.89 | 3.53 | 1.37 | 1.80 | 0.14 | 0.47 | |
| Older than 24 | Exclusively Full-Time | 57.97 | 53.25 | 0.85 | 2.16 | 0.49 | 0.81 | 0.07 | 0.34 |
| Exclusively Part-Time | 28.79 | 23.30 | 0.61 | 0.77 | 3.29 | 0.67 | – | 0.13 | |
| Mixed Enrollment | 40.25 | 30.83 | 1.69 | 3.65 | 1.37 | 1.80 | 0.10 | 0.81 | |
| Age Missing | Exclusively Full-Time | 34.60 | 33.35 | 0.98 | – | – | – | – | – |
| Exclusively Part-Time | 10.65 | 8.52 | – | – | – | – | – | – | |
| Mixed Enrollment | 17.78 | 16.62 | 0.77 | – | – | – | – | – | |
Table 56. Completion Rates for Women at Different Institutions Across State Lines by Age at First Entry and Enrollment Intensity (N=1,315,077)
| Age at First Entry | Enrollment Intensity | Total Completion Rate | Completion At Same Institution | Completion At Different Institution, In-State | Completion At Different Institution, Out-Of-State | Completion At Different Institution, Multiple State | |||
| Two-Year | Four-Year | Two-Year | Four-Year | Two-Year | Four-Year | ||||
| 20 and Younger | Exclusively Full-Time | 85.04 | 72.01 | 1.66 | 6.83 | 0.42 | 3.74 | 0.16 | 0.21 |
| Exclusively Part-Time | 13.18 | 9.99 | 1.38 | 0.44 | 0.32 | 0.28 | 0.47 | 0.30 | |
| Mixed Enrollment | 48.95 | 28.71 | 4.03 | 10.66 | 0.88 | 3.86 | 0.40 | 0.41 | |
| >20 – 24 | Exclusively Full-Time | 58.80 | 50.35 | 1.41 | 3.56 | 0.45 | 2.05 | 0.41 | 0.57 |
| Exclusively Part-Time | 16.45 | 11.53 | 1.15 | 0.80 | 2.01 | 0.42 | 0.19 | 0.35 | |
| Mixed Enrollment | 34.47 | 24.35 | 2.39 | 3.68 | 1.08 | 1.60 | 0.59 | 0.79 | |
| Older than 24 | Exclusively Full-Time | 58.68 | 53.60 | 0.98 | 2.34 | 0.27 | 0.76 | 0.18 | 0.55 |
| Exclusively Part-Time | 29.43 | 26.09 | 0.83 | 0.99 | 0.73 | 0.47 | 0.07 | 0.26 | |
| Mixed Enrollment | 42.29 | 33.15 | 2.01 | 3.72 | 0.80 | 1.46 | 0.25 | 0.89 | |
| Age Missing | Exclusively Full-Time | 35.68 | 32.73 | 1.59 | – | – | – | – | – |
| Exclusively Part-Time | 13.21 | 12.14 | – | – | – | – | – | – | |
| Mixed Enrollment | 22.64 | 19.70 | 1.38 | – | – | – | – | – | |
Table 57. Completion Rates for Students Who Started at Multistate Institutions by Enrollment Intensity (N=91,646)
| Total Completion Rate | Completion at Same Institution | Completion at Different Institution | ||
| Two-Year | Four-Year | |||
| Overall | 41.52 | 33.02 | 2.29 | 6.21 |
| Exclusively Full-Time | 63.41 | 58.44 | 1.27 | 3.70 |
| Exclusively Part-Time | 17.99 | 12.90 | 2.29 | 2.80 |
| Mixed Enrollment | 23.87 | 11.46 | 3.28 | 9.13 |
Table 58. Completion Rates for Students Who Started at Multistate Institutions by Gender (N=88,412)
| Total Completion Rate | Completion at Same Institution | Completion at Different Institution | ||
| Two-Year | Four-Year | |||
| Overall | 41.52 | 33.02 | 2.22 | 5.84 |
| Men | 26.93 | 20.21 | 1.71 | 5.01 |
| Women | 63.37 | 52.55 | 3.19 | 7.62 |
Table 59. Completion Rates for Students Who Started at Multistate Institutions by Age at First Entry (N=91,646)
| Total Completion Rate | Completion at Same Institution | Completion at Different Institution | ||
| Two-Year | Four-Year | |||
| Overall | 41.52 | 33.02 | 2.29 | 6.21 |
| 20 and Younger | 51.72 | 37.41 | 3.49 | 10.81 |
| >20 – 24 | 26.95 | 18.92 | 3.49 | 4.54 |
| Older than 24 | 41.08 | 34.12 | 1.76 | 5.20 |
| Age Missing | 21.83 | 16.77 | – | – |
Table 60. Completion Rates for Students Who Started at Multistate Institutions by Gender and Age at First Entry (N= 88,412)
| Gender | Age at First Entry | Total Completion Rate | Completion at Same Institution | Completion at Different Institution | |
| Two-Year | Four-Year | ||||
| Men | 20 and Younger | 51.25 | 36.32 | 2.96 | 11.97 |
| >20 – 24 | 25.60 | 15.43 | 4.22 | 5.95 | |
| Older than 24 | 39.21 | 30.89 | 2.16 | 6.16 | |
| Age Missing | – | – | – | – | |
| Women | 20 and Younger | 51.70 | 37.96 | 4.23 | 9.51 |
| >20 – 24 | 27.48 | 20.93 | 3.03 | 3.52 | |
| Older than 24 | 42.30 | 36.37 | 1.54 | 4.39 | |
| Age Missing | – | – | – | – | |
Table 61. Completion Rates for Students Who Started at Multistate Institutions by Age at First Entry and Enrollment Intensity (N=91,573)
| Age at First Entry | Enrollment Intensity | Total Completion Rate | Completion at Same Institution | Completion at Different Institution | |
| Two-Year | Four-Year | ||||
| 20 and Younger | Exclusively Full-Time | 75.43 | 64.55 | 1.99 | 8.89 |
| Exclusively Part-Time | 4.64 | 1.59 | 2.10 | – | |
| Mixed Enrollment | 34.04 | 15.79 | 4.94 | 13.31 | |
| >20 – 24 | Exclusively Full-Time | 46.27 | 41.59 | 1.74 | 2.95 |
| Exclusively Part-Time | 6.62 | 2.60 | 3.19 | – | |
| Mixed Enrollment | 17.02 | 6.44 | 4.63 | 5.95 | |
| Older than 24 | ExclusivelyFull-Time | 62.34 | 58.94 | 1.02 | 2.39 |
| Exclusively Part-Time | 21.47 | 15.93 | 2.20 | 3.34 | |
| Mixed Enrollment | 22.11 | 11.16 | 2.48 | 8.48 | |
| Age Missing | Exclusively Full-Time | – | – | – | – |
| Exclusively Part-Time | – | – | – | – | |
| Mixed Enrollment | – | – | – | – | |
Table 62. Completion Rates for Men Who Started at Multistate Institutions by Age at First Entry and Enrollment Intensity (N=35,182)
| Age at First Entry | Enrollment Intensity | Total Completion Rate | Completion at Same Institution | Completion at Different Institution | |
| Two-Year | Four-Year | ||||
| 20 and Younger | Exclusively Full-Time | 75.96 | 64.40 | 1.58 | 9.98 |
| Exclusively Part-Time | 2.46 | – | – | – | |
| Mixed Enrollment | 35.05 | 16.06 | 4.29 | 14.70 | |
| >20 – 24 | Exclusively Full-Time | 43.92 | 36.88 | 2.89 | 4.15 |
| Exclusively Part-Time | 6.73 | – | 4.36 | – | |
| Mixed Enrollment | 17.72 | 5.10 | 4.96 | 7.66 | |
| Older than 24 | Exclusively Full-Time | 59.87 | 55.40 | 1.58 | 2.89 |
| Exclusively Part-Time | 18.51 | 10.87 | 3.34 | 4.30 | |
| Mixed Enrollment | 23.12 | 10.98 | 2.49 | 9.65 | |
| Age Missing | Exclusively Full-Time | – | – | – | – |
| Exclusively Part-Time | – | – | – | – | |
| Mixed Enrollment | – | – | – | – | |
Table 63. Completion Rates for Women Who Started at Multistate Institutions by Age at First Entry and Enrollment Intensity (N=53,162)
| Age at First Entry | Enrollment Intensity | Total Completion Rate | Completion at Same Institution | Completion at Different Institution | |
| Two-Year | Four-Year | ||||
| 20 and Younger | Exclusively Full-Time | 74.28 | 63.64 | 2.58 | 8.07 |
| Exclusively Part-Time | 8.94 | – | – | – | |
| Mixed Enrollment | 32.10 | 14.92 | 5.86 | 11.32 | |
| >20 – 24 | Exclusively Full-Time | 47.22 | 43.89 | 1.19 | 2.14 |
| Exclusively Part-Time | 6.90 | 3.46 | – | – | |
| Mixed Enrollment | 15.79 | 6.80 | 4.31 | 4.69 | |
| Older than 24 | Exclusively Full-Time | 63.60 | 60.85 | 0.74 | 2.02 |
| Exclusively Part-Time | 23.62 | 19.26 | 1.46 | 2.90 | |
| Mixed Enrollment | 20.42 | 10.57 | 2.49 | 7.35 | |
| Age Missing | Exclusively Full-Time | – | – | – | – |
| Exclusively Part-Time | – | – | – | – | |
| Mixed Enrollment | – | – | – | – | |
Table S-1. Eight-Year Outcomes for Fall 2006 Cohort by Enrollment Intensity (N=1,871,443)
| Total Completion Rate | Completion at Same Institution | Completion at Different Institution | Still Enrolled (At Any Institution) | Not Enrolled (At Any Institution) | ||
| Two-Year | Four-Year | |||||
| Overall | 60.11 | 44.37 | 3.82 | 11.92 | 8.06 | 31.82 |
| Full-Time | 79.71 | 68.02 | 2.05 | 9.65 | 1.09 | 19.20 |
| Part-Time | 23.64 | 19.76 | 2.37 | 1.50 | 6.13 | 70.24 |
| Mixed Enrollment | 49.75 | 29.37 | 5.38 | 15.01 | 13.67 | 36.58 |
Data in this table are displayed in the report in Figures S-1 and S-2.
Table S-2. Eight-Year Outcomes for Fall 2006 Cohort by Age at First Entry (N=1,856,104)
| Total Completion Rate | Completion at Same Institution | Completion at Different Institution | Still Enrolled (At Any Institution) | Not Enrolled (At Any Institution) | ||
| Two-Year | Four-Year | |||||
| Overall | 60.11 | 44.37 | 3.82 | 11.92 | 8.06 | 31.82 |
| 20 and Younger | 64.98 | 46.93 | 4.13 | 13.92 | 8.15 | 26.88 |
| 21 – 24 | 45.81 | 34.47 | 3.72 | 7.62 | 9.81 | 44.38 |
| Older than 24 | 45.85 | 37.67 | 2.65 | 5.53 | 7.33 | 46.82 |
| Age Missing | 38.12 | 35.30 | 1.79 | 1.03 | 1.30 | 60.59 |
Data in this table are displayed in the report in Figure S-3.
Table S-3. Eight-Year Outcomes for Fall 2006 Cohort by Starting Institution Type (N=1,871,443)
| Total Completion Rate | Completion at Same Institution | Completion at Different Institution | Still Enrolled (At Any Institution) | Not Enrolled (At Any Institution) | ||
| Two-Year | Four-Year | |||||
| Overall | 60.11 | 44.37 | 3.82 | 11.92 | 8.06 | 31.82 |
| Four-Year Public | 67.47 | 52.04 | 4.16 | 11.27 | 7.31 | 25.23 |
| Four-Year Private Nonprofit | 75.87 | 60.13 | 2.95 | 12.79 | 4.56 | 19.57 |
| Four-Year Private For-Profit | 43.96 | 37.07 | 2.68 | 4.21 | 9.06 | 46.98 |
| Two-Year Public | 42.73 | 25.82 | 3.98 | 12.93 | 10.99 | 46.28 |
| Two-Year Private Nonprofit | 58.69 | 42.76 | 4.53 | 11.40 | 8.00 | 33.31 |
| Two-Year Private For-Profit | 57.76 | 53.47 | 1.48 | 2.81 | 5.87 | 36.37 |
Data in this table are displayed in the report in Figure S-4.