
Current Term Enrollment – Fall 2016
In fall 2016, overall postsecondary enrollments decreased 1.4 percent from the previous fall.

In fall 2016, overall postsecondary enrollments decreased 1.4 percent from the previous fall.

This fifth annual report on national college completion rates offers a look at the six-year outcomes for students who began postsecondary education in fall 2010, toward the end of the Great Recession. It looks at the various pathways students took toward degree completion, as well as the completion rates through May 2016 for the different student types who followed each pathway.

Our fourth annual report provides new data on high school graduates’ college access, persistence, and completion outcomes. The data in this report are presented for students from different types of high schools, such as low versus higher income and low versus high minority, to enable more focused discussions, particularly about low income and minority students traditionally not well served by higher education.
This report examines time to degree completion for a cohort of students who earned an associate degree as their first and only postsecondary degree or a bachelor’s degree as their first four-year degree between July 1, 2014, and June 30, 2015. Overall, the average time enrolled for associate and bachelor’s degree earners was 3.3 years and 5.1 years, respectively. However, as the report shows, the time required for successful degree attainment could be influenced by the pathway the student followed as well as by factors, such as stop outs and less than full-time enrollment status.
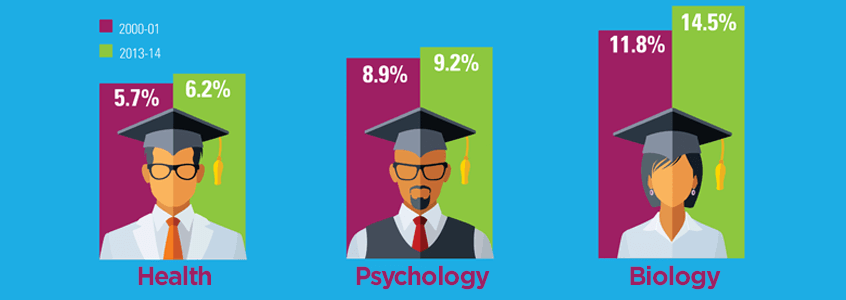
During the Great Recession, there was a slight increase in the percentage of bachelor’s degree earners who opted to continue their educations at two-year institutions. However, that percentage has now dropped well below pre-recession levels, with only 5.8 percent of 2013-14 bachelor’s degree earners having returned to college at two-year institutions.

Of all associate degrees reported to the National Student Clearinghouse for the 2009-10 academic year, 536,351 were earned by students with no previous degrees or certificates. Within the next six academic years, over 64 percent of these students enrolled at a four-year institution and 41 percent earned a bachelor’s degree.

In spring 2016, overall postsecondary enrollments decreased 1.3 percent from the previous spring.

Of all students who started college in fall 2014, 72.1 percent persisted at any U.S. institution in fall 2015, while 60.6 percent were retained at their starting institution.

During the 2014-15 academic year, 9.4 percent of all students attended more than one institution, a figure that has remained constant for the last three years. In each year shown, the mobility rate was highest for students who began the academic year at a two-year public institution.

This snapshot goes beyond traditional measures of postsecondary attainment by tracking the fall 2009 entering cohort over time, and showing persistence, stop-out, and completion rates at the end of each subsequent academic year. The model tracks outcomes for both full-time and part-time starters, and takes spring and summer terms into account.

In the state supplement to our tenth Signature Report, a national study on college completion, we take a state-by-state look at the various pathways that students take to complete a college degree or certificate.

The overall persistence rate for students who entered college in Fall 2013 was 1.0 percentage points higher than that of students who entered college in Fall 2012, while the retention rate increased by 1.1 percentage points.