

Yearly Success & Progress Rates – 2019
This snapshot goes beyond traditional measures of postsecondary attainment by tracking the fall 2012 entering cohort over time, and showing persistence, stop-out, and completion rates at the end of each subsequent academic year. The model tracks outcomes for both full-time and part-time starters, and takes spring and summer terms into account.
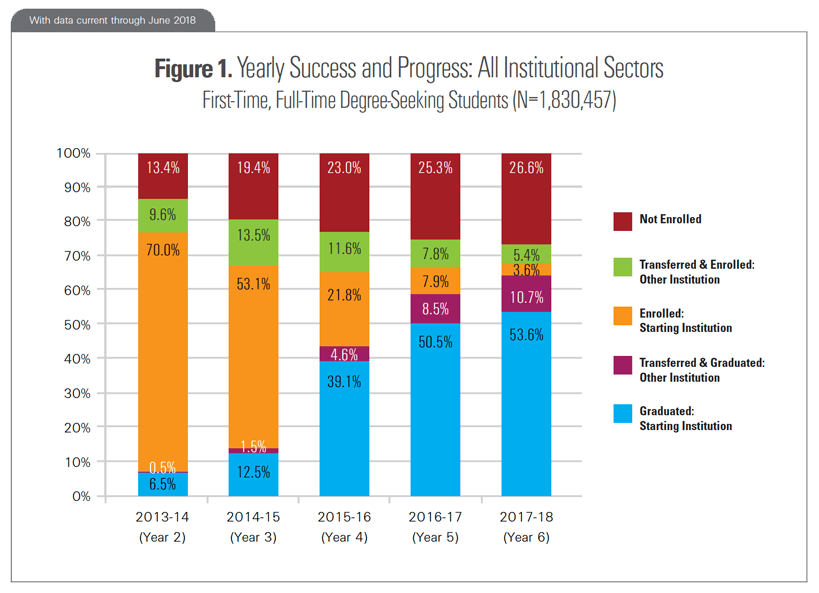
All Institutional Sectors First-Time, Full-Time
Figure 1 shows yearly success and progress rates for individuals who began college in Fall 2012 as full-time degree-seeking students. It shows the highest level of academic progress made by these students at the end of each subsequent academic year.
By the end of year four, 43.7 percent had completed a postsecondary credential, while 23.0 percent were no longer enrolled. By the end of year six, 64.3 percent had graduated, while 26.6 percent had left college without earning a credential.
The outcome categories are modeled after those used in the Student Achievement Measure (SAM), and can be used by participating institutions for benchmarking purposes.
More detailed notes on the cohort and outcome definitions are included at the end of this report.
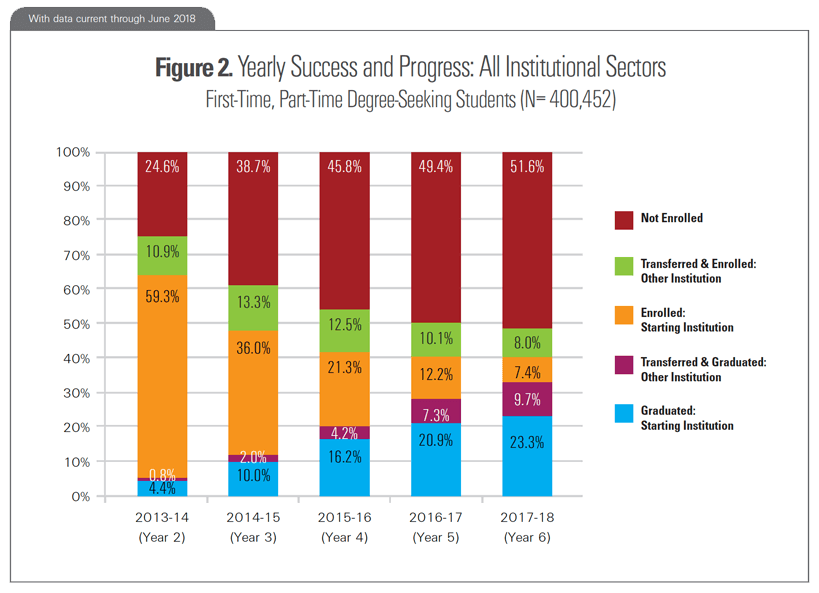
All Institutional Sectors First-Time, Part-Time
Figure 2 shows yearly success and progress rates for individuals who began college in Fall 2012 as part-time degree-seeking students.
By the end of year four, 20.4 percent had completed a postsecondary credential, while 45.8 percent were no longer enrolled. By the end of year six, 33.0 percent had graduated, while 51.6 percent had left college without earning a credential.
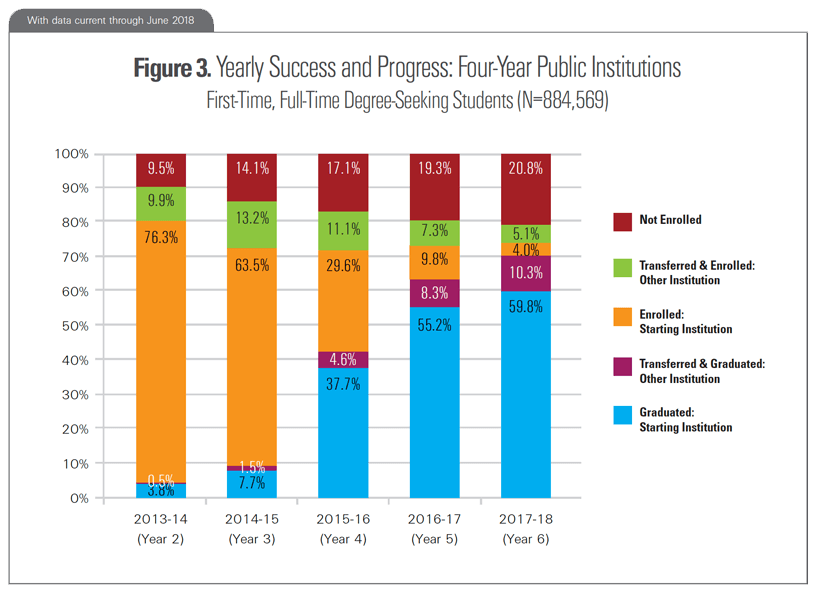
Four-Year Publics First-Time, Full-Time
Figure 3 shows yearly success and progress rates for individuals who began college in Fall 2012 as full-time degree-seeking students at four-year public institutions.
By the end of year four, 42.3 percent had completed a postsecondary credential, while 17.1 percent were no longer enrolled. By the end of year six, 70.1 percent had graduated, while 20.8 percent had left college without earning a credential.
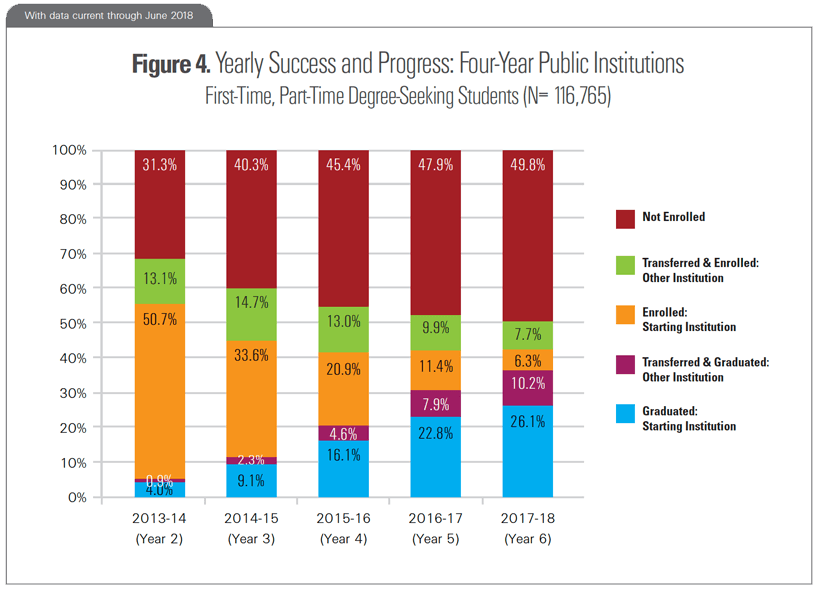
Four-Year Publics First-Time, Part-Time
Figure 4 shows yearly success and progress rates for individuals who began college in Fall 2012 as part-time degree-seeking students at four-year public institutions.
By the end of year four, 20.7 percent had completed a postsecondary credential, while 45.4 percent were no longer enrolled. By the end of year six, 36.3 percent had graduated, while 49.8 percent had left college without earning a credential.
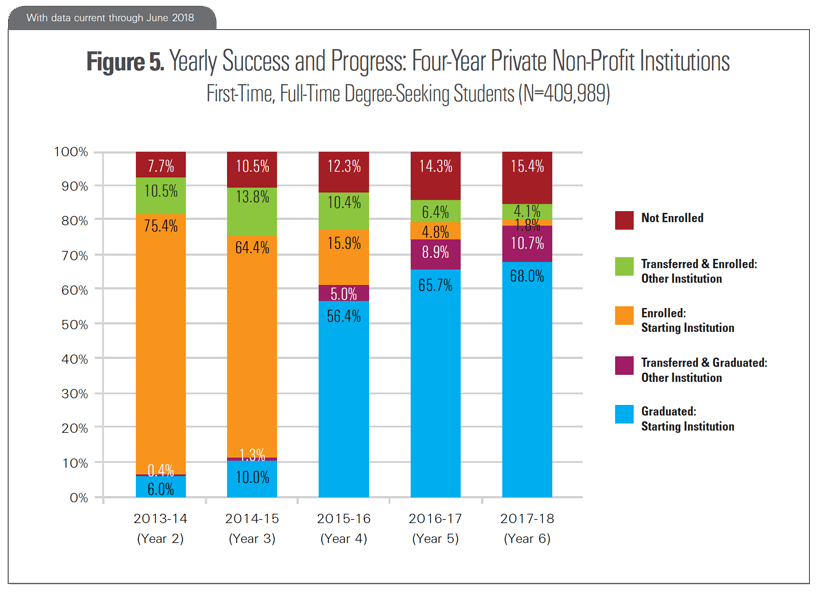
Four-Year Privates First-Time, Full-Time
Figure 5 shows yearly success and progress rates for individuals who began college in Fall 2012 as full-time degree-seeking students at four-year private non-profit institutions.
By the end of year four, 61.4 percent completed a postsecondary credential, while 12.3 percent were no longer enrolled. By the end of year six, 78.7 percent had graduated, while 15.4 percent had left college without earning a credential.
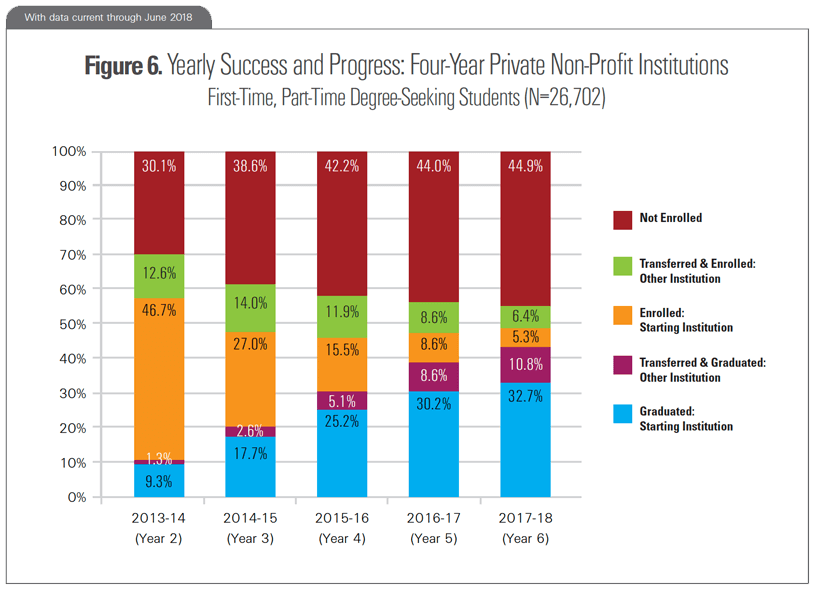
Four-Year Privates First-Time, Part-Time
Figure 6 shows yearly success and progress rates for individuals who began college in Fall 2012 as part-time degree-seeking students at four-year private non-profit institutions.
By the end of year four, 30.3 percent had completed a postsecondary credential, while 42.2 percent were no longer enrolled. By the end of year six, 43.5 percent had graduated, while 44.9 percent had left college without earning a credential.
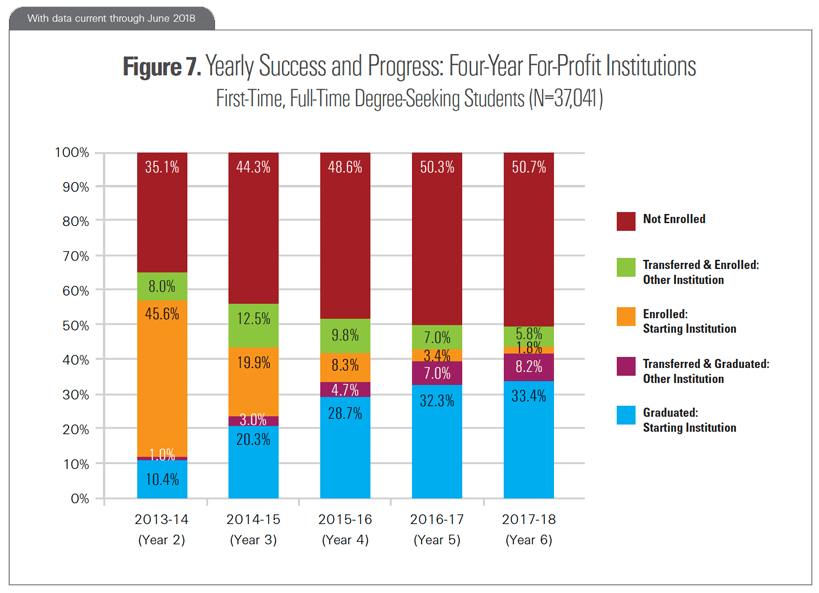
Four-Year For-Profits First-Time, Full-Time
Figure 7 shows yearly success and progress rates for individuals who began college in Fall 2012 as full-time degree-seeking students at four-year for-profit institutions.
By the end of year four, 33.4 percent had completed a postsecondary credential, while 48.6 percent were no longer enrolled. By the end of year six, 41.6 percent had graduated, while 50.7 percent had left college without earning a credential.
Note that most of the Year 2 and Year 3 completions in the for-profit sector are for associate degrees.
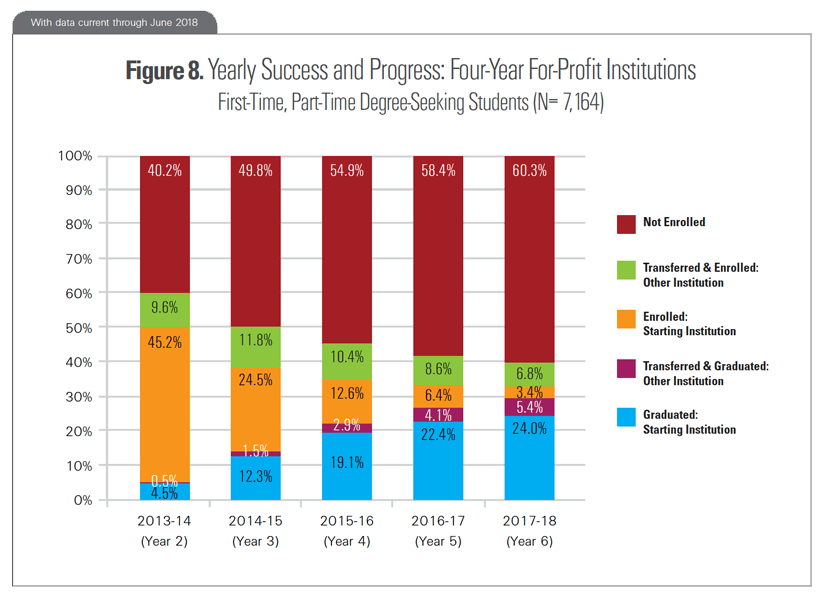
Four-Year For-Profits First-Time, Part-Time
Figure 8 shows yearly success and progress rates for individuals who began college in Fall 2012 as part-time degree-seeking students at four-year for-profit institutions.
By the end of year four, 22.0 percent had completed a postsecondary credential, while 54.9 percent were no longer enrolled. By the end of year six, 29.4 percent had graduated, while 60.3 percent had left college without earning a credential.
Note that most of the Year 2 and Year 3 completions in the for-profit sector are for associate degrees.
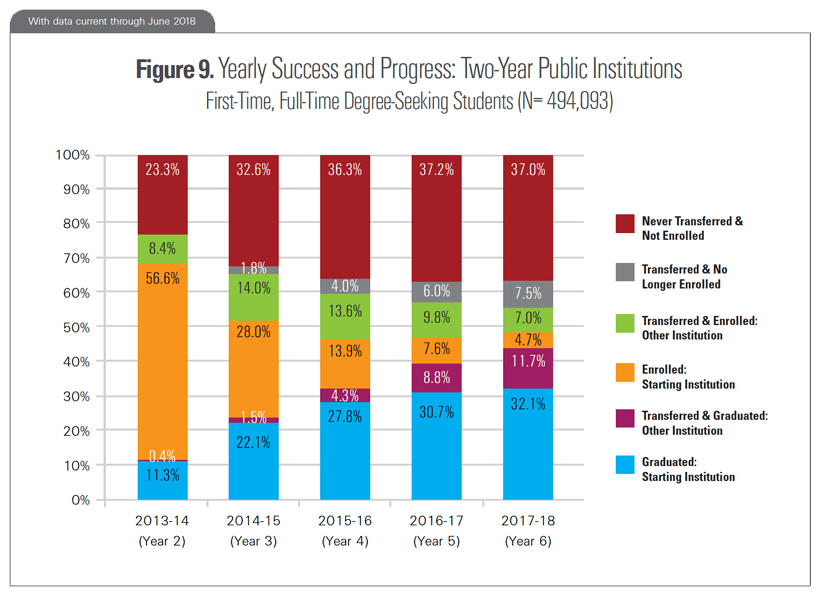
Two-Year Publics First-Time, Full-Time
Figure 9 shows yearly success and progress rates for individuals who began college in Fall 2012 as full-time degree-seeking students at two-year public institutions.
By the end of year three, 67.4 percent had either completed a postsecondary credential (23.6 percent), were still enrolled in college (42.0 percent), or had transferred to a different institution before withdrawing (1.8 percent).
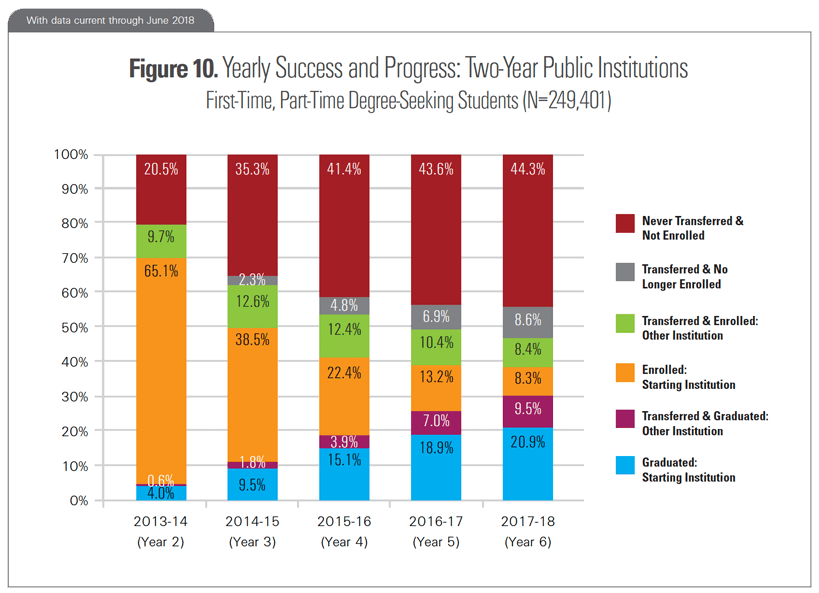
Two-Year Publics First-Time, Part-Time
Figure 10 shows yearly success and progress rates for individuals who began college in Fall 2012 as part-time degree-seeking students at two-year public institutions.
By the end of year three, 64.7 percent had either completed a postsecondary credential (11.3 percent), were still enrolled in college (51.1 percent), or had transferred to a different institution before withdrawing (2.3 percent).
Outcome Definitions for Yearly Success and Progress Rates
Students are counted in only one outcome category per year (the highest ranking outcome they achieve in any particular year). The outcome categories are defined below, listed in hierarchical order. Academic years run from July 1 through June 30.
Graduated from Starting Institution – Student received a certificate or degree from the same institution in which she started college. Once a student completes a credential at the starting institution, the student will be counted in this category in all subsequent years since this is the highest ranking outcome in this model.
Transferred and Graduated from Other Institution – Student did not receive a credential from the starting institution, but did receive a certificate or degree from a different institution. Student will be counted in this category in all subsequent years unless the student eventually completes a credential at the starting institution.
Enrolled at Starting Institution – Student has not yet received a certificate or degree, but is still enrolled at the starting institution.
Transferred and Enrolled at Other Institution – Student has not yet received a certificate or degree, but is still enrolled in college at an institution other than the starting institution.
Not Enrolled – Student had no college enrollments during the academic year in question. This is not a terminal outcome. In other words, a student can be counted as not enrolled in one academic year, but then counted as enrolled in a subsequent year if the student returns to college.
For two-year institutions only, the not enrolled category is further disaggregated into the following two categories:
Transferred and No Longer Enrolled – Student had no enrollments for the academic year in question, but in a previous academic year, had transferred to an institution other than the starting institution.
Never Transferred and Not Enrolled – Student had no enrollments during the academic year in question, and had never transferred to an institution other than the starting institution.
Note on Certificates – Unlike the Student Achievement Measure, this snapshot includes postsecondary certificates in graduation counts for four-year institutions in addition to two-year institutions. The inclusion of certificates increases six-year graduation counts by 1.6 percent at four-year publics, 0.6 percent at four-year private nonprofits, and 4.9 percent at four-year for-profits.