

Persistence & Retention – 2015
The overall persistence rate for students who entered college in Fall 2013 was 1.0 percentage points higher than that of students who entered college in Fall 2012, while the retention rate increased by 1.1 percentage points.
Overall Persistence and Retention Rates Improve
The overall persistence rate for students who entered college in fall 2013 was 1.0 percentage points higher than that of students who entered college in fall 2012, while the retention rate increased by 1.1 percentage points. The persistence rate is the percentage of students who return to college at any institution for their second year, while the retention rate is the percentage of students who return to the same institution for their second year. Of all students who started college in fall 2013, 69.6 percent returned to college at any U.S. institution in fall 2014, and 59.3 percent returned to the same institution. On average, the overall persistence rate is about 11 percentage points higher than the retention rate. Thus, about one in nine students who start college in any fall term, transfer to a different institution by the following fall.
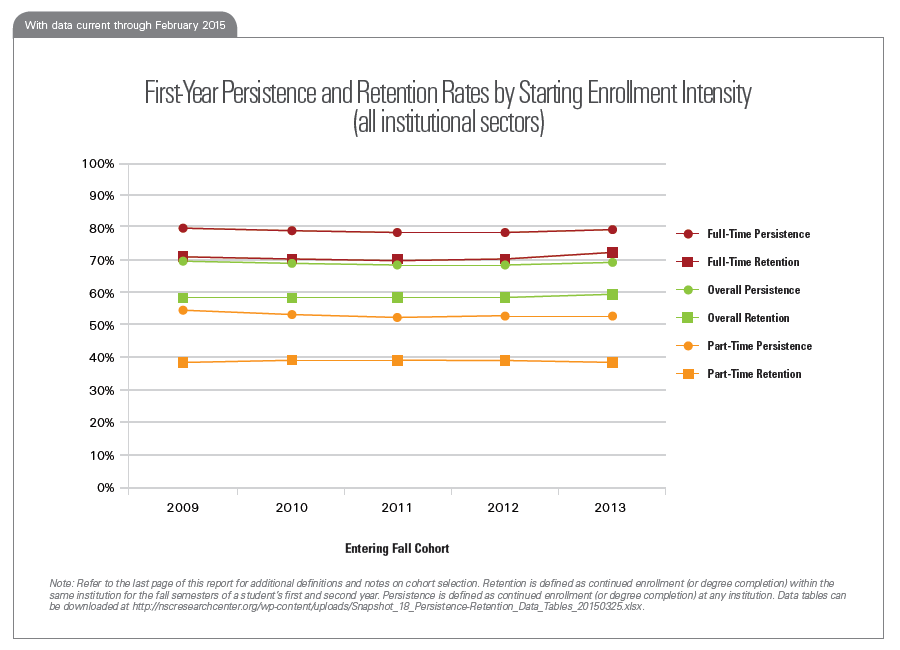
Note: See below for additional definitions and notes on cohort selection. Retention is defined as continued enrollment (or degree completion) within the same institution for the fall semesters of a student’s first and second year. Persistence is defined as continued enrollment (or degree completion) at any institution.
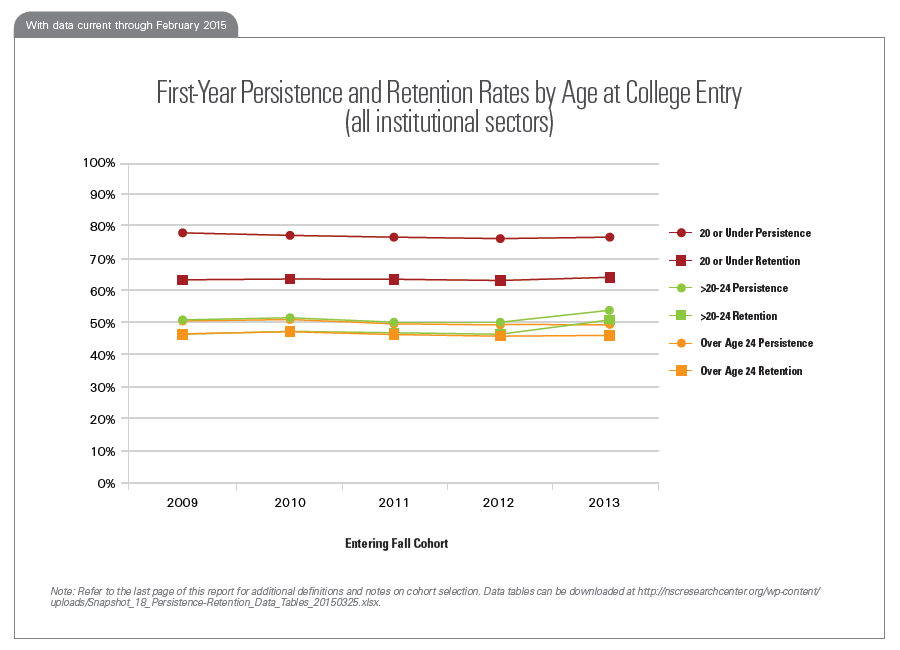
Persistence Rates Up for All Age Groups
For students in the 20 and under age group, the persistence rate was 76.3 percent, up 0.4 percentage points from the prior year, but down 1.4 percentage points since 2009. Students in the >20 to 24 age group saw the largest gains in persistence, although this group accounts for only 7.5% of the overall fall 2013 entering cohort. The persistence rate for this group was 53.7 percent, an increase of 3.4 percentage points over the prior year, and up 2.8 percentage points since 2009. For students over age 24 at college entry, the persistence rate was 49.3 percent, up 0.7 percentage points from the prior year, but down 0.7 percentage points since 2009.
Note: See below for additional definitions and notes on cohort selection.
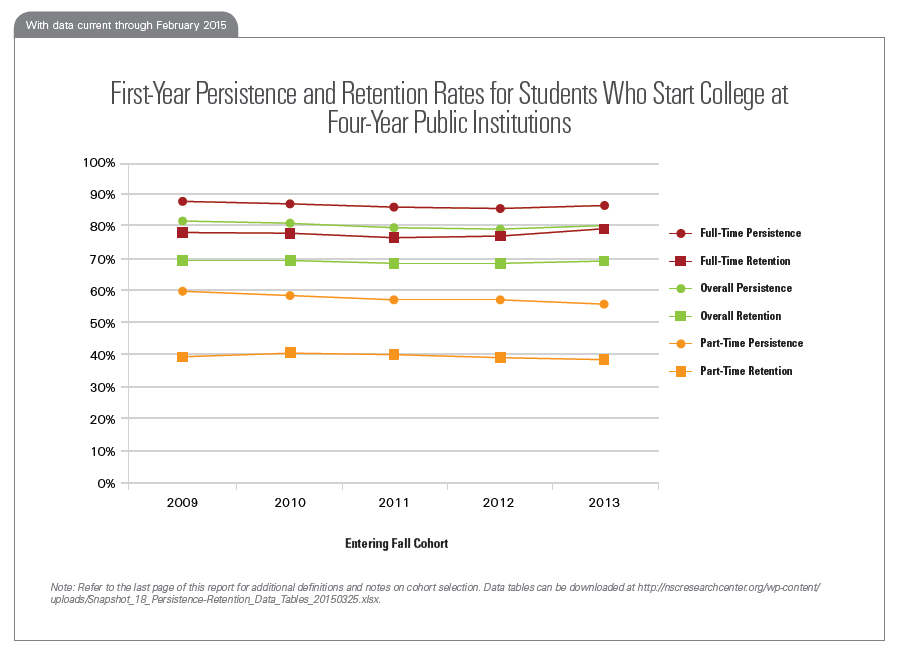
Four-Year Publics: Persistence Up Slightly Over Prior Year
For students who started college in four-year public institutions, the persistence rate was 79.3 percent, up 0.6 percentage points from the prior year, but down 2.1 percentage points since 2009. Of all students who started college in this sector in fall 2013, 79.3 percent returned to college at any U.S. institution in fall 2014, and 68.8 percent returned to the same institution. For students in this sector whose entering status was full-time, the persistence rate was 86.4 percent, up 1.2 percentage points from the prior year, but down 1.3 percentage points since 2009. For students in this sector whose entering status was part-time, the persistence rate was 56.0 percent, down 1.1 percentage points from the prior year, and down 3.2 percentage points since 2009.
Note: See below for additional definitions and notes on cohort selection and for information regarding institution-level changes.
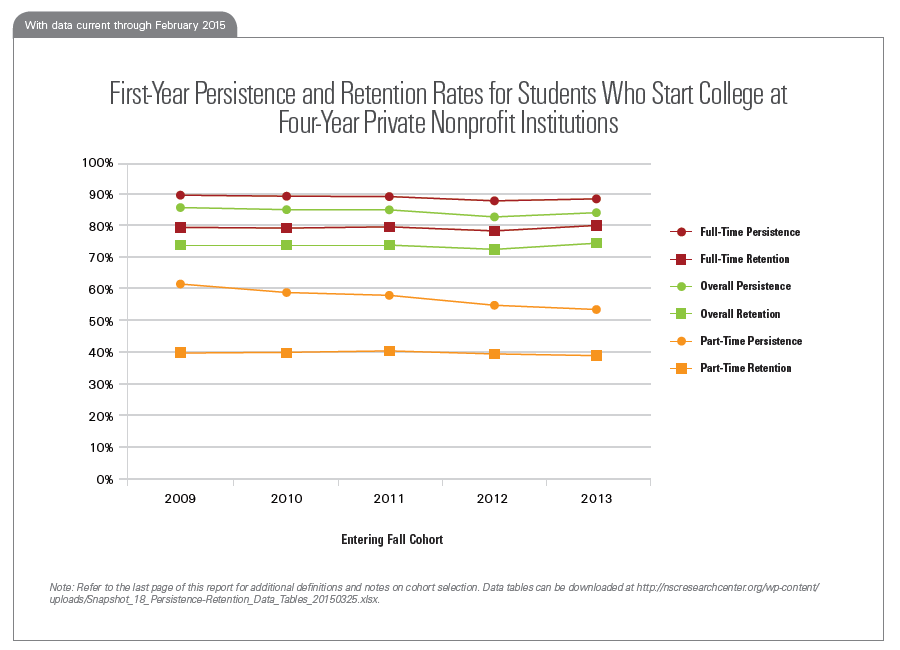
Four-Year Privates: Persistence Up Slightly Over Prior Year
For students who started college in four-year private nonprofit institutions, the persistence rate was 83.7 percent, up 0.7 percentage points from the prior year, but down 2.1 percentage points since 2009. Of all students who started college in this sector in fall 2013, 83.7 percent returned to college at any U.S. institution in fall 2014, and 74.1 percent returned to the same institution. For students in this sector whose entering status was full-time, the persistence rate was 88.6 percent, up 0.8 percentage points from the prior year, but down 1.4 percentage points since 2009. For students in this sector whose entering status was part-time, the persistence rate was 54.0 percent, down 0.9 percentage points from the prior year, and down 7.8 percentage points since 2009. (This group makes up less than 12 percent of the sector’s entering cohort.)
Note: See below for additional definitions and notes on cohort selection and for information regarding institution-level changes.
Four-Year For-Profits: Persistence Up Slightly Over Prior Year
For students who started college in four-year for-profit institutions, the persistence rate was 51.8 percent, up 0.6 percentage points from the prior year, and up 1.3 percentage points since 2010. Of all students who started college in this sector in fall 2013, 51.8 percent returned to college at any U.S. institution in fall 2014, and 46.7 percent returned to the same institution. For students in this sector whose entering status was full-time, the persistence rate was 57.7 percent, up 3.3 percentage points from the prior year, and up 4.9 percentage points since 2010. For students in this sector whose entering status was part-time, the persistence rate was 42.8 percent, up 0.6 percentage points from the prior year, but down 4.1 percentage points since 2010.
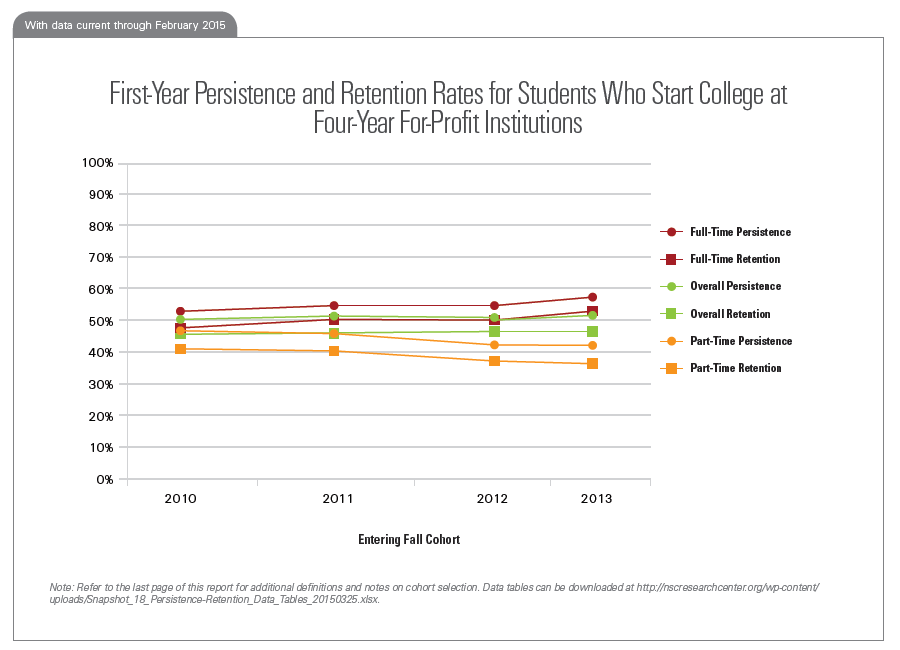
Note: Due to reporting changes, the fall 2009 entering cohort in this sector is not directly comparable to subsequent cohorts and is excluded from this analysis. See below for additional definitions and notes on cohort selection and for information regarding institution-level changes.
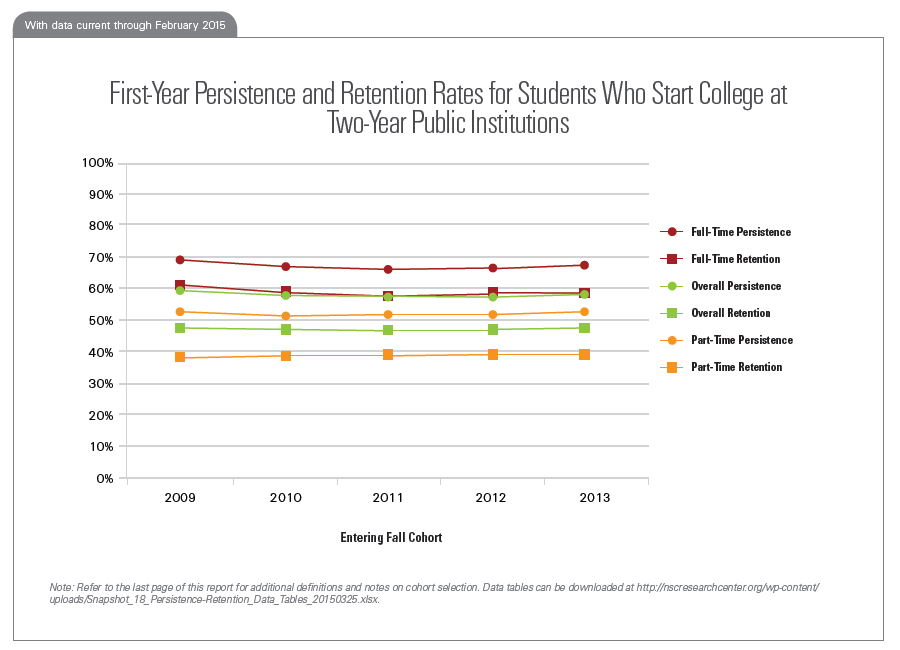
Two-Year Publics: Persistence Up Slightly Over Prior Year
For students who started college in two-year public institutions, the persistence rate was 57.6 percent, up 0.8 percentage points from the prior year, but down 1.6 percentage points since 2009. Of all students who started college in this sector in fall 2013, 57.6 percent returned to college at any U.S. institution in fall 2014, and 46.9 percent returned to the same institution. For students in this sector whose entering status was full-time, the persistence rate was 66.7 percent, up 0.6 percentage points from the prior year, but down 2.3 percentage points since 2009. For students in this sector whose entering status was part-time, the persistence rate was 52.0 percent, up 0.5 percentage points from the prior year, but down 0.7 percentage points since 2009.
Note: See below for additional definitions and notes on cohort selection and for information regarding institution-level changes.
Definitions and Notes on Cohort Selection
- Retention – Defined in this report as continued enrollment (or degree completion) within the same higher education institution in the fall semesters of a student’s first and second year.
- Persistence – Defined in this report as continued enrollment (or degree completion) at any higher education institution — including one different from the institution of initial enrollment — in the fall semesters of a student’s first and second year.
- Enrollment Intensity – A student is classified as having started college in a full- or part-time status based on his or her earliest reported enrollment intensity within the entering fall term. The part-time grouping comprises three-quarter-time, half-time, and less-than-half-time students, some of whom may be non-degree-seeking.
- First-Time Status – This report uses historical Clearinghouse enrollment and degree data to confirm that students included in the study (1) showed no previous college enrollment in the four years prior to the entering cohort year and (2) had not previously completed a college degree. In order to reliably identify students with prior enrollments, this report is limited to institutions that began submitting enrollment data to the Clearinghouse for terms beginning on or before June 1, 2005.
- Included Institutions – This report is based on a fixed panel of institutions for all four starting cohorts. These are U.S. Title IV degree-granting institutions that have been submitting student enrollment data to the Clearinghouse since at least June 1, 2005.
- Institution Categories – Between 2009 and 2012, a number of public sector institutions (16) were reclassified from two- to four-year by the Department of Education’s IPEDS system. To account for this, the public sector results for the 2009 to 2012 entering cohorts have been restated from those published in the previous year’s report. Only results for the two-year public and four-year public sectors have been restated. There has been no change to the overall results or the results for the four-year private or four-year nonprofit sectors.
- Degree-Seeking Status – The retention rates reported by IPEDS are limited to degree-seeking students. This report differs in that it includes all entering students.
- Former Dual Enrollment Students – The cohorts used in this study include former dual enrollment students: first‐time college students who had taken college courses prior to graduating from high school. Students were identified as former dual enrollment students if their enrollment or degree record prior to the entering cohort year was before the student turned 18 years old.
- Fall Enrollment – A student is counted as having been enrolled in the fall if they were enrolled for any length of time in a term that began between August 13 and October 31, inclusive.