
Completing College – State – 2017
…degree from a four-year institution within six years, with or without a prior associate’s degree. In 16 states, this percentage was higher than the national average. In four states (Iowa,…

…degree from a four-year institution within six years, with or without a prior associate’s degree. In 16 states, this percentage was higher than the national average. In four states (Iowa,…
…Earn Half of All S&E Bachelor’s Degrees In the 2012-13 academic year, women earned 57% of bachelor’s degrees in all disciplines, 50% of bachelor’s degrees in S&E, and 61% of…
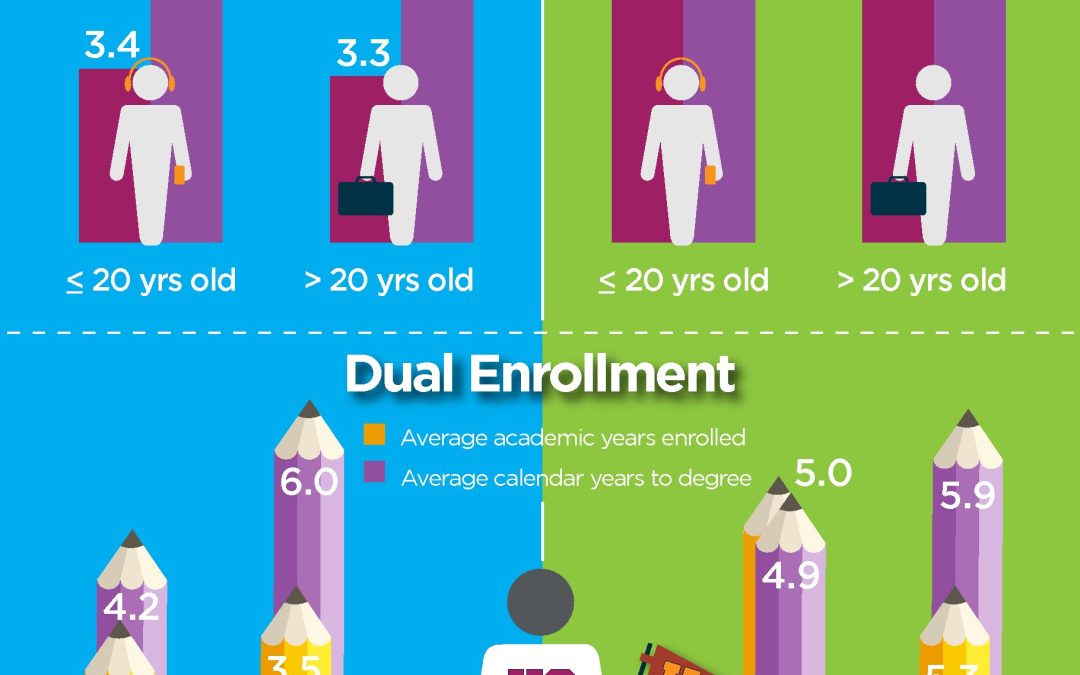
…of 2014-15 degree earners reveals that the majority of students no longer follow the traditional path taking 2 years for an associate degree or 4 years for a bachelor’s degree….
…all S&E bachelor’s degrees. Older Students Experiencing Fastest Growth in S&E Bachelor’s Degrees Over the last five years, the overall number of science and engineering (S&E) bachelor’s degree completions has…

…present: Total college-going rate, including: Enrollment in the first fall after high school graduation Enrollment at any time in the first year after high school graduation Enrollment at any time…
…5,283,906 0.0% Part-Time 2,081,091 0.4% 2,073,217 -1.9% 2,113,106 -0.3% Four-Year, Private Nonprofit Full-Time 2,821,072 2.1% 2,762,099 0.3% 2,755,060 3.2% Part-Time 873,227 1.7% 858,541 1.4% 846,324 5.7% Four-Year, For-Profit Full-Time 922,895…

…comprises half-time and less-than-half-time students, some of whom may be non-degree-seeking. First-Time Status – This report uses historical Clearinghouse enrollment and degree data to confirm that students included in the…

…category includes: post-baccalaureate certificate, master’s degree, doctoral degree, first-professional degree, graduate/professional certificate, and special non-credential programs that have been specifically classified by institutions as graduate-level programs. Table 4: Estimated National…

…who returned to college (anywhere) at any time in the second year out of all students from the high school graduating class who enrolled at any time in the first…
Postsecondary Pathways of First-Time Students In our second Signature Report, we analyze students’ transfer behaviors to better understand their postsecondary pathways. A detailed view of transfer rates is critical in…

…college completion outcomes. Further results are included, showing state-level six-year outcomes for students: By enrollment intensity across the six-year study period—exclusively full time (Tables 2, 11, 20), exclusively part time…

…Enrollment at any time in the first year after high school graduation Enrollment at any time in the first two years after high school graduation Persistence from first to second…