
Completing College
National and State Reports
With Six- and Eight-Year Completion Rates Dashboards

November 30, 2023
Continuing a trend of stagnation over the last two years, the overall completion rates for the fall 2017 cohort remained at the level of the 2016 cohort (-0.1 pp). Trends differed at the sector level, however, with improvements in community college completion rates (+0.4 pp) building on their previous year’s growth, while all four-year sectors experienced completion rate declines.
Most states saw completion rate gains continue, as well, however this also varied widely by sector. Nationally, only nine states saw completion rate gains of 1 percentage point or larger, an improvement from just five states gaining in the previous year.
As the twelfth in the Completing College series, this report updates the six-year college completion rates nationally and by state, by tracking the enrollment and completion outcomes for the fall 2017 cohort of beginning college students through June 2023. The report also features national eight-year completion outcomes for fall 2015 through June 2023.
The longitudinal data dashboards offer six-year and eight-year national and cross-state comparisons through interactive visualizations and analysis tools. Underlying data are also available for downloading.
About this report
The Completing College report series provides a comprehensive overview of postsecondary completion trends nationally and by state. For all students who enter postsecondary education for the first time each year, it examines the diverse pathways the student traversed toward completion, as well as a degree or certificate completion rate within six and eight years of enrolling.
The completion rates account for all students who enter postsecondary education for the first time each year, enrolling full-time or part-time at two-year or four-year institutions, and completing at any U.S. degree-granting institution. The results include those who complete after transfer, not just completions at the starting institution. Thus, the report more fully captures today’s students’ diverse pathways to success, that increasingly involve mobility across institutions and across state lines, re-entry after stop-out, and changes in enrollment intensities.
Highlights
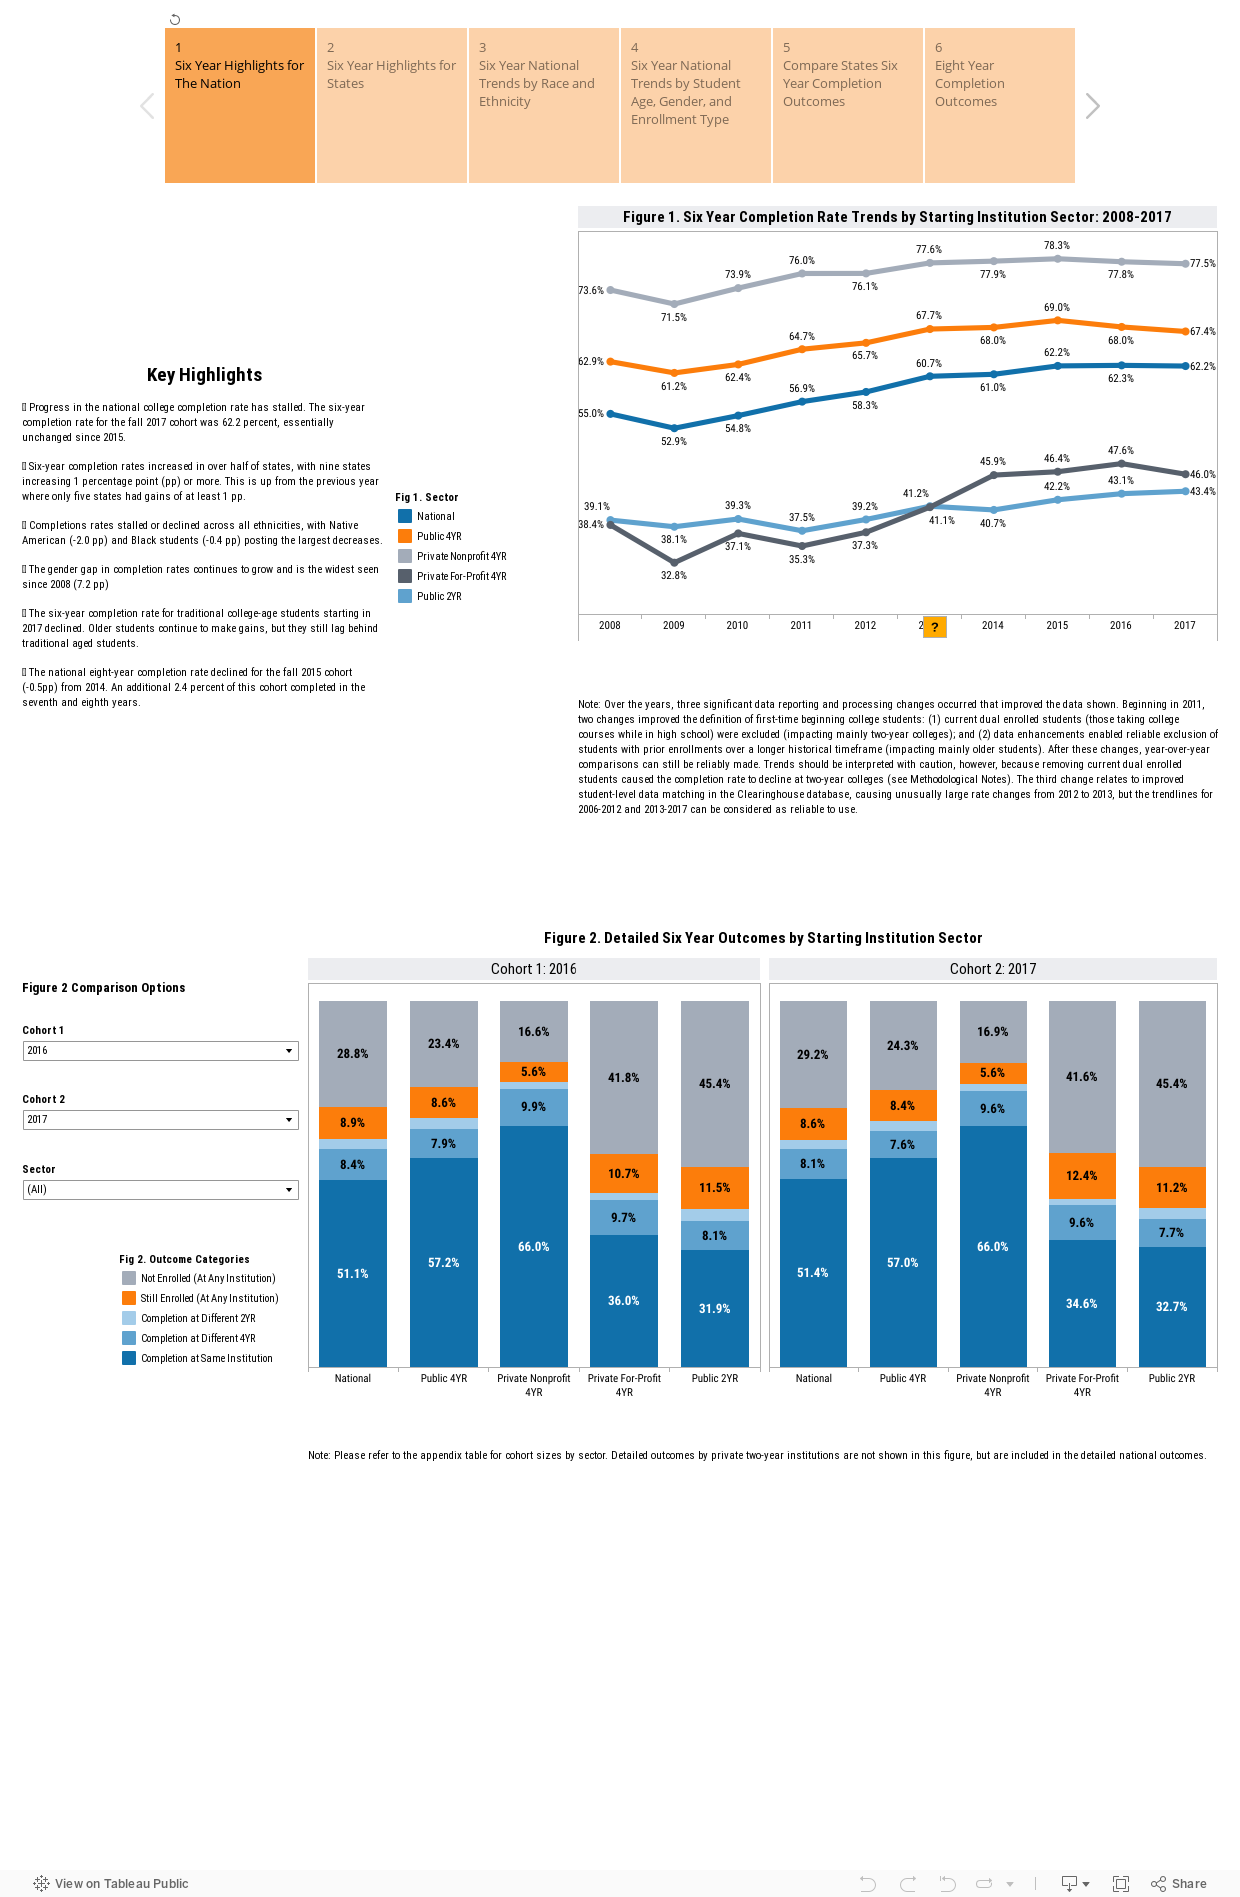
- Progress in the national college completion rate has stalled. The six-year completion rate for the fall 2017 cohort was 62.2 percent, essentially unchanged since 2015.
- Six-year completion rates increased in over half of states, with nine states increasing 1 percentage point (pp) or more. This is up from the previous year when only five states had gains of at least 1 pp.
- Completions rates stalled or declined across all ethnicities, with Native American (-2.0 pp) and Black students (-0.4 pp) posting the largest decreases.
- The gender gap in completion rates continues to grow and is the widest seen since 2008 (7.2 pp)
- Traditional-aged students entering college in fall 2017 saw declines in their overall six-year completion rate. Older students continue to make gains, but they still lag behind traditional aged students.
- The national eight-year completion rate for the fall 2015 cohort declined 0.5pp from 2014. Only 2.4 percent of the cohort completed in the seventh and eighth years.
Navigate details using the tabs at the top of the dashboard.
Past Reports
2022: Full Report | Data Dashboard | Data Download
2021: Full Report | Data Dashboard | Data Download
2020: National/State | 50 States